140
Quantity of labor
(workers)
Total product
(widgets per day)
0
0
1
5
2
15
3
35
4
50
5
60
6
65
Total product
(widgets per
day)
TFC
TVC
TC
0
5
15
35
50
60
65
Total product
(widgets per
day)
AFC
AVC
ATC
MC
0
5
15
35
50
60
65
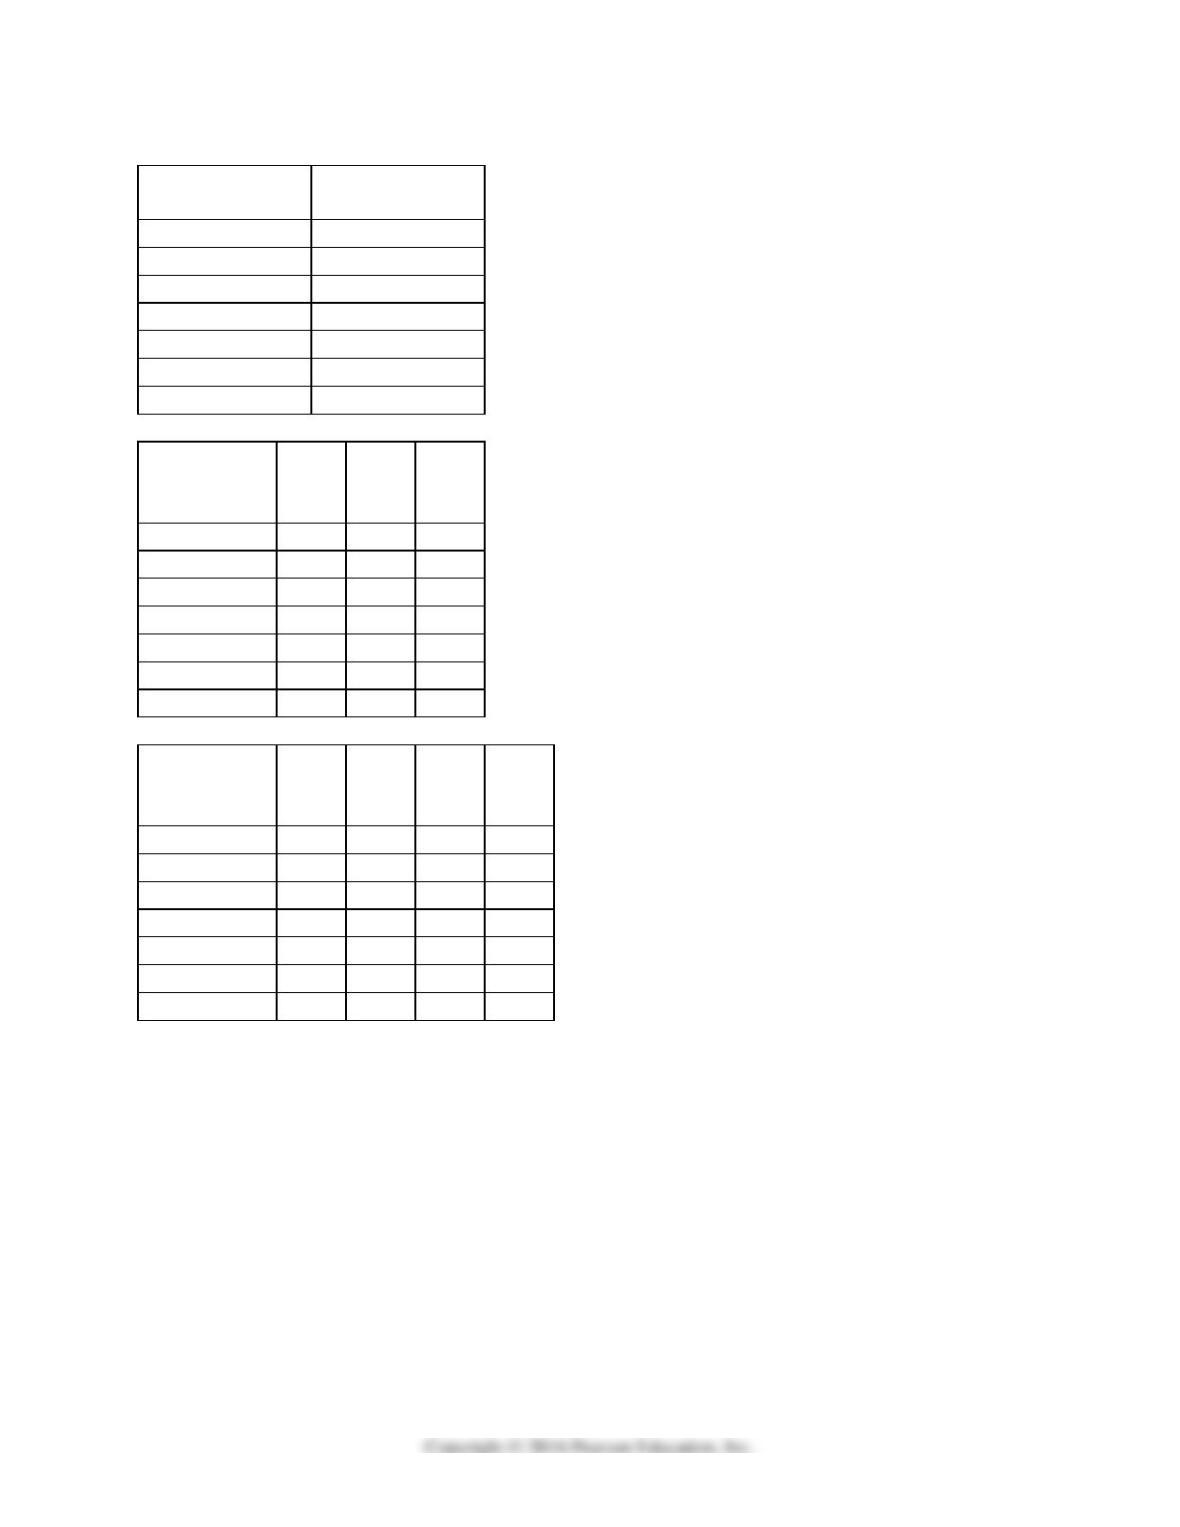
5) The first table above has the total product schedule for an imaginary good called a widget.
Each unit of labor costs $25 and the total cost of capital is $100.
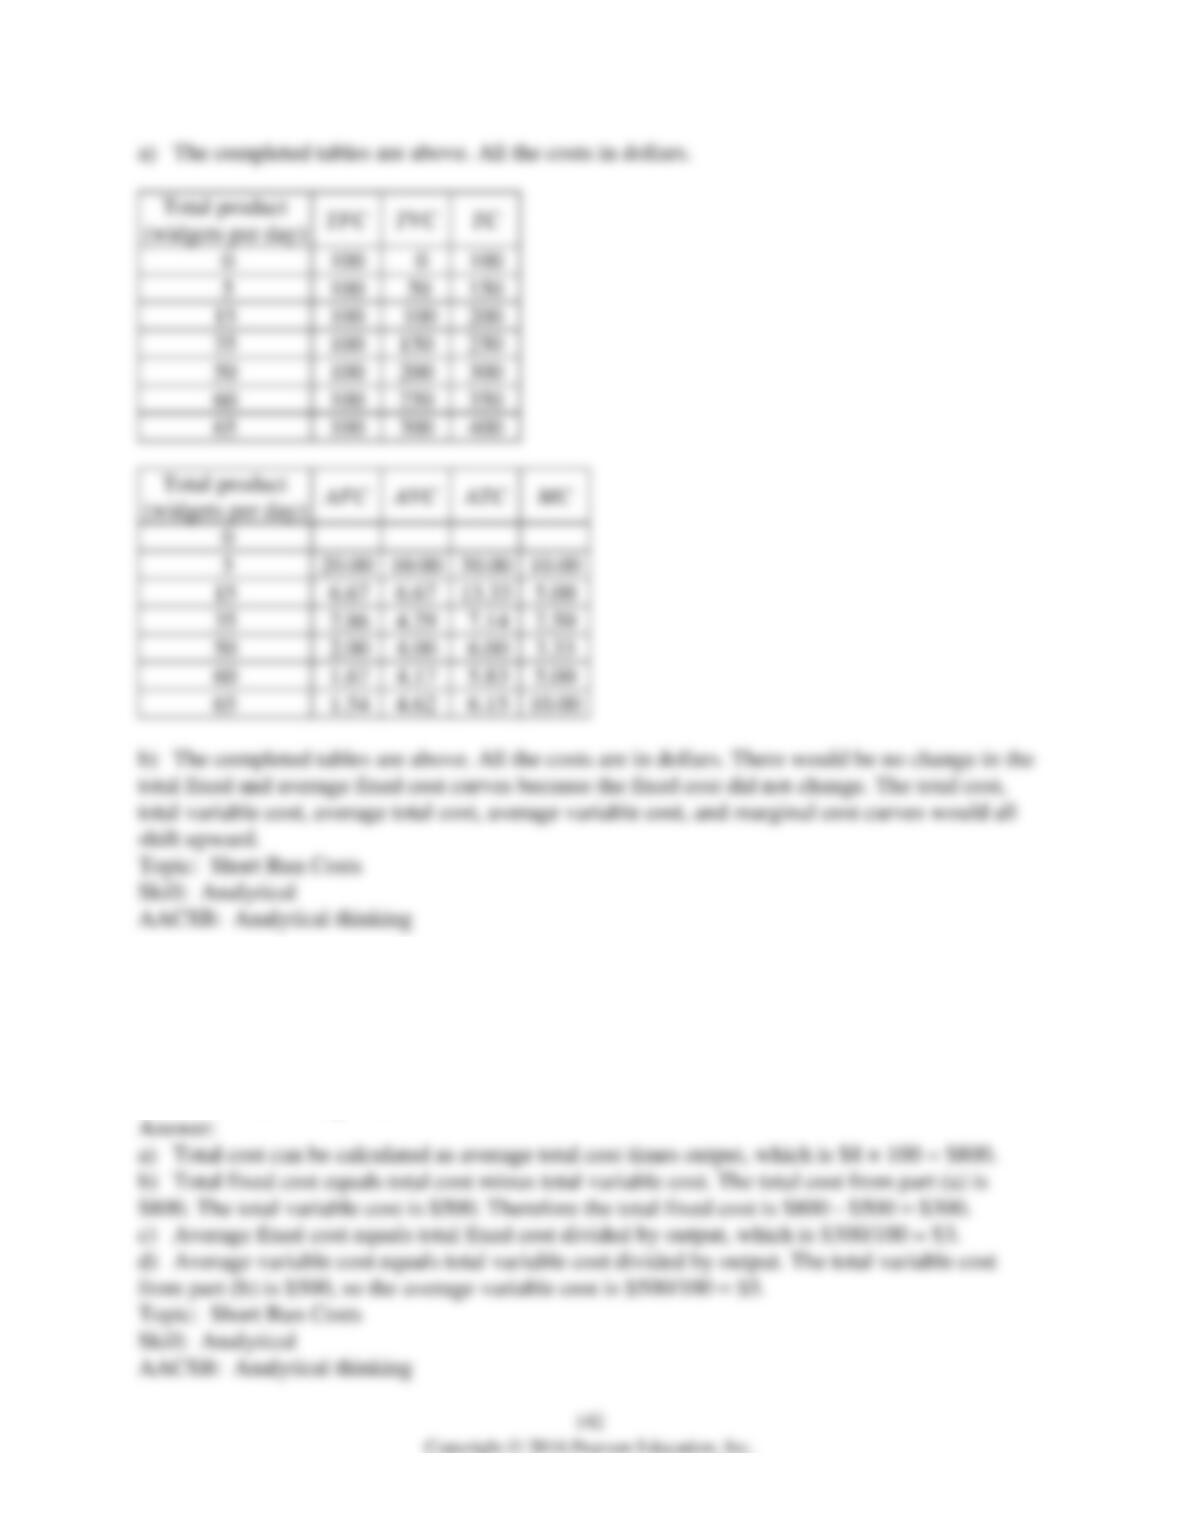
a) Use this information to complete the remaining two tables. In the tables, TFC is the total
fixed cost, TVC is the total variable cost, TC is the total cost, AFC is the average fixed cost, AVC
is the average variable cost, ATC is the average total cost, and MC is the marginal cost.

141
Quantity of labor
(workers)
Total product
(widgets per day)
0
0
1
5
2
15
3
35
4
50
5
60
6
65
Total product
(widgets per
day)
TFC
TVC
TC
0
5
15
35
50
60
65
b) Suppose that labor becomes twice as expensive (so that one unit of labor now costs $50) but
nothing else changes. Complete the above tables with the new cost schedules. If you plotted the
cost curves, how would the increased wage rate affect the cost curves?
Total product
(widgets per day)
0
5
15
35
50
60
65
Total product
(widgets per day)
0
5
15
35
50
6) This month, the local widget factory produced 100 widgets. The total variable cost of
production was $500 and the average total cost of production was $8.
a) What is the total cost?
b) What is the total fixed cost?
c) What is the average fixed cost?
d) What is the average variable cost?
143
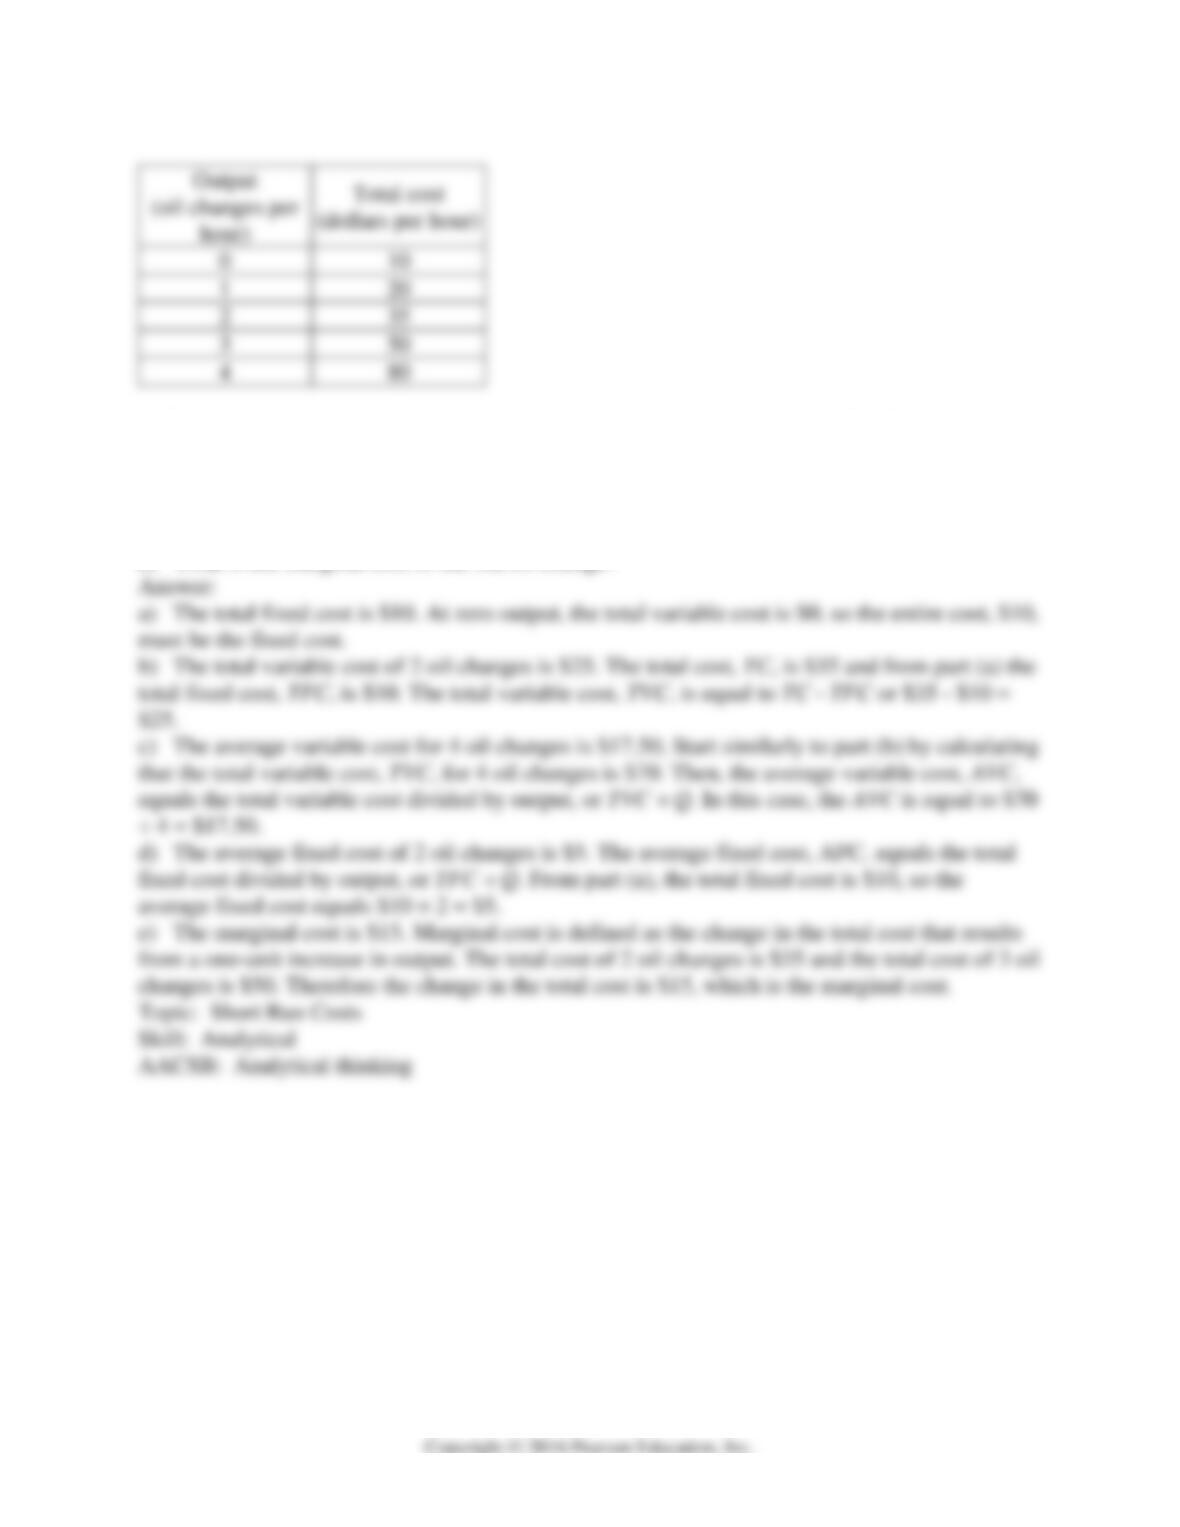
7) The above table gives the total cost schedule for oil changes at the local Jiffy Lube.
a) What is Jiffy Lube’s total fixed cost?
b) What is the total variable cost of 2 oil changes?
c) What is the average variable cost of 4 oil changes?
d) What is the average fixed cost of 2 oil changes?
e) What is the marginal cost of the 3rd oil change?
144
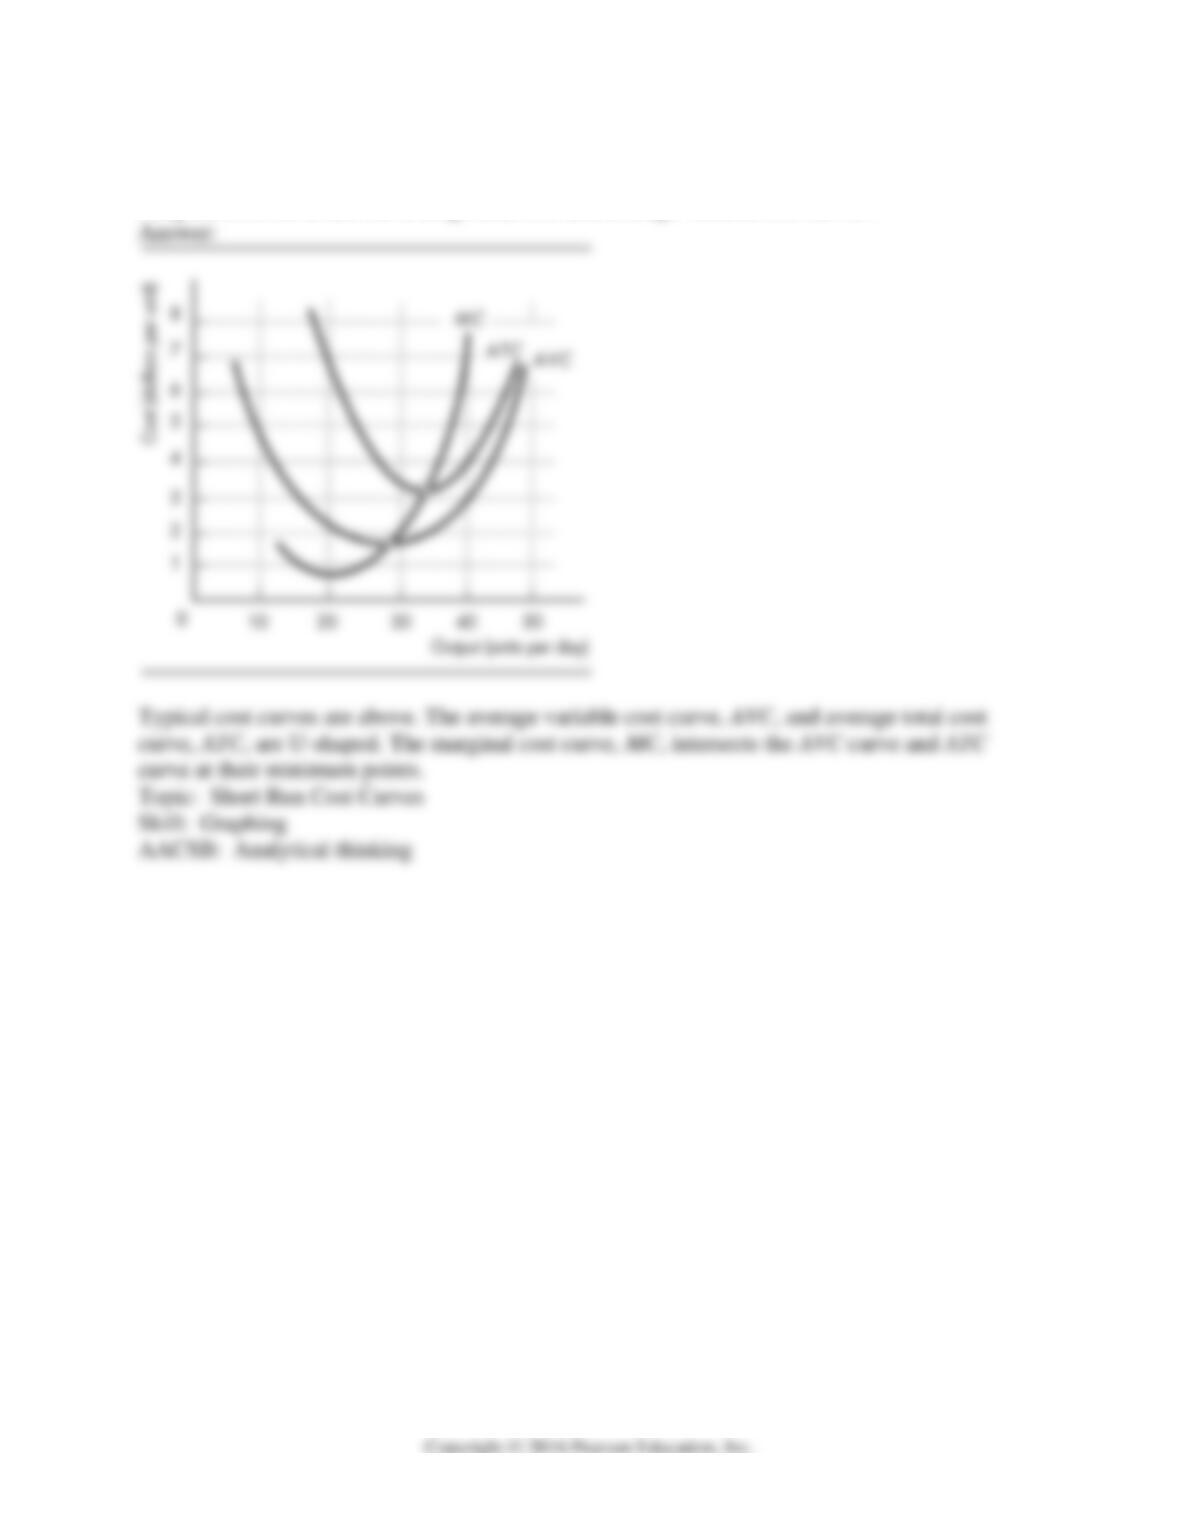
8) Draw an average total cost curve, an average variable cost, and a marginal cost curve all on
the same graph. Make sure to correctly label the axes. What relationship must exist between the
marginal cost curve and the average total cost and average variable cost curves?
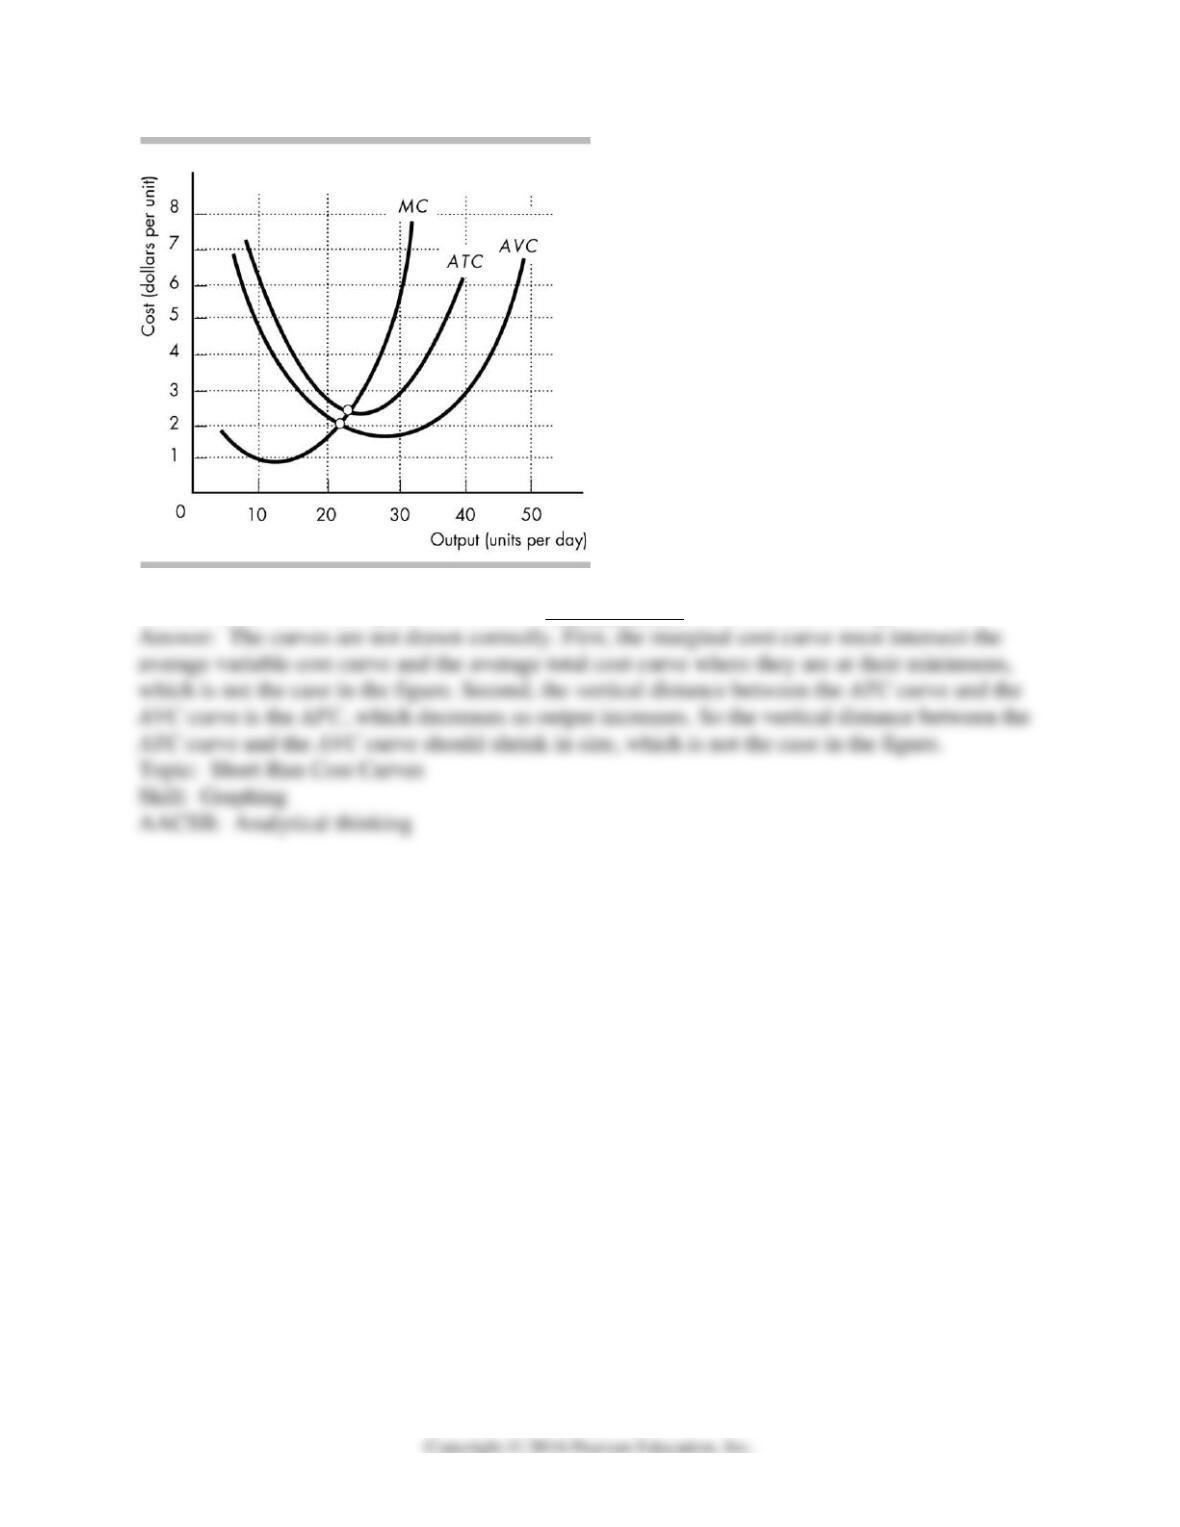
145
9) Are the curves in the figure above drawn CORRECTLY? If not, what’s wrong?
146
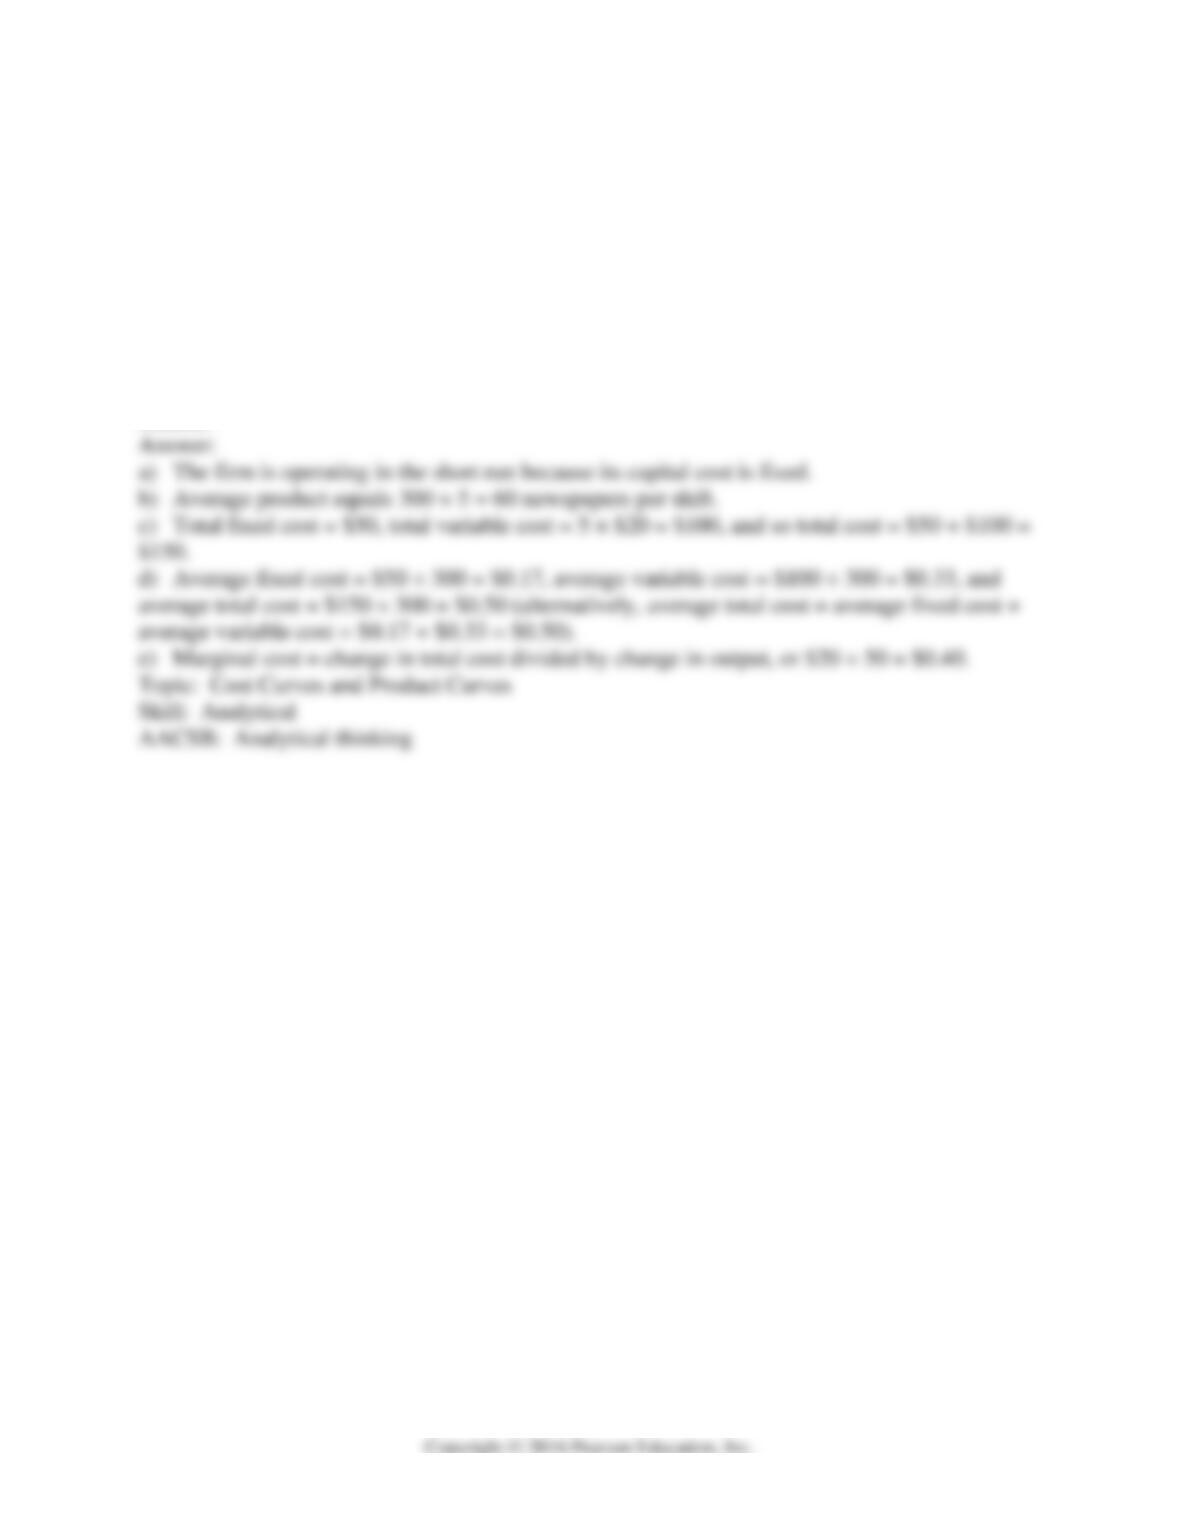
10) Suppose the local newspaper hires students to fold and bag newspapers for delivery and pays
them $20 per shift. Five students can fold and bag 300 newspapers per shift. The fourth student
added 50 newspapers to total output. The capital cost is fixed at $50 per shift.
a) Is the newspaper operating in the long run or short run? Why?
b) What is the average product of 5 students?
c) Calculate the total fixed, total variable, and total costs of folding and bagging 300
newspapers.
d) Calculate the average fixed, average variable, and average total costs of folding and bagging
300 newspapers.
e) What is the marginal cost of one of the 50 newspapers folded and bagged by the fourth
student?
147
Year
Total product
Total cost
(dollars)
Average cost
(dollars)
1
100
1,000
___
2
240
2,000
___
3
500
4,000
___
4
1,000
8,000
___
5
1,800
16,000
___
6
2,500
32,000
___
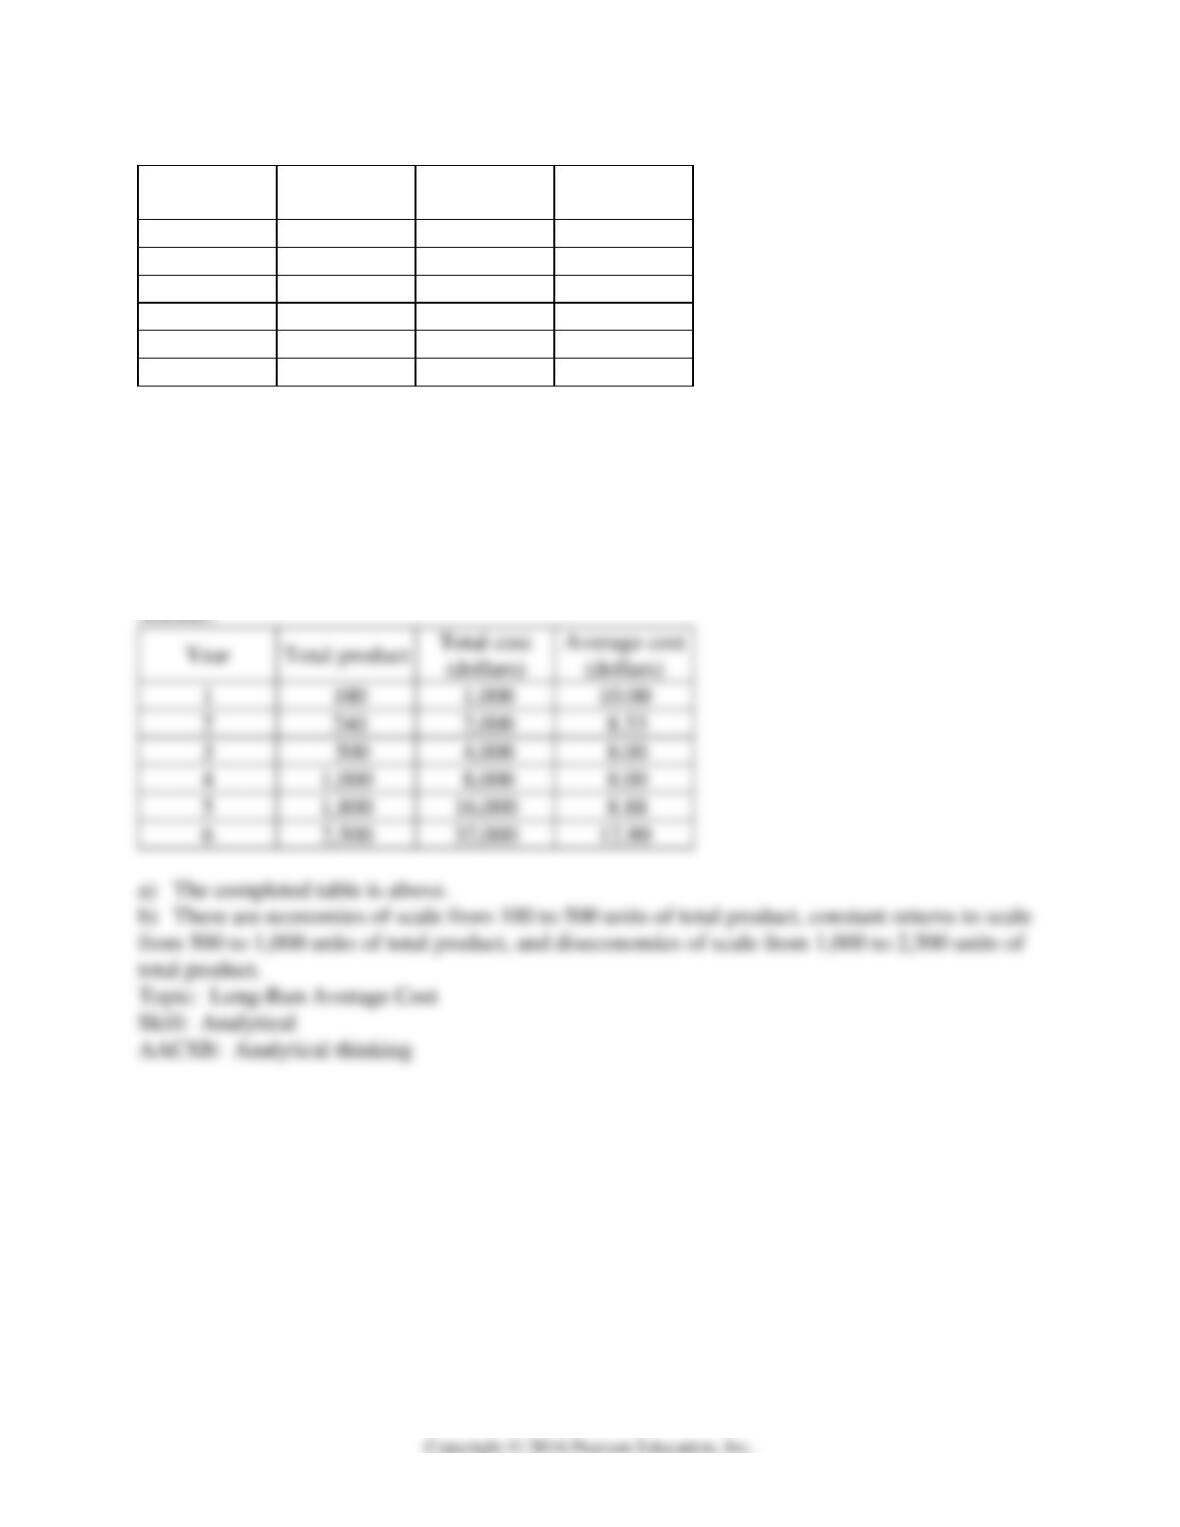
11) Jones Production started business with a small scale plant. Fortunately for Smith, the owner
of Jones Production, the business grew rapidly. It doubled its plant scale and its labor force every
year for the next six years. The table above gives the total costs and the associated total products
for each year.
a) Complete the table by finding the average cost for each scale.
b) Over what range of total product (output) did Jones Production experience economies of
scale, constant returns to scale, and diseconomies of scale?
Year
Total product
Total cost
(dollars)
Average cost
(dollars)
1
10.00
2
8.33
3
500
8.00
4
1,000
8.00
5
1,800
16,000
8.88
6
2,500
32,000
12.80
148
12) Ayanna grows herbs. Last year she grew 2,000 pounds of herbs in a year while using 250
square feet of land and 1 worker. This year she doubled her land to 500 square feet, doubled her
workers to 2, and grew 4,500 pounds of herbs. She sells her rare, organic herbs for $50 a pound.
She pays her workers $25,000 a year and rents her land for $100 per square foot for a year.
These are her only costs.
a) What was Ayanna’s total cost last year and this year?
b) What was Ayanna’s average total cost last year and this year?
c) Did Ayanna experience economies or diseconomies of scale?
149
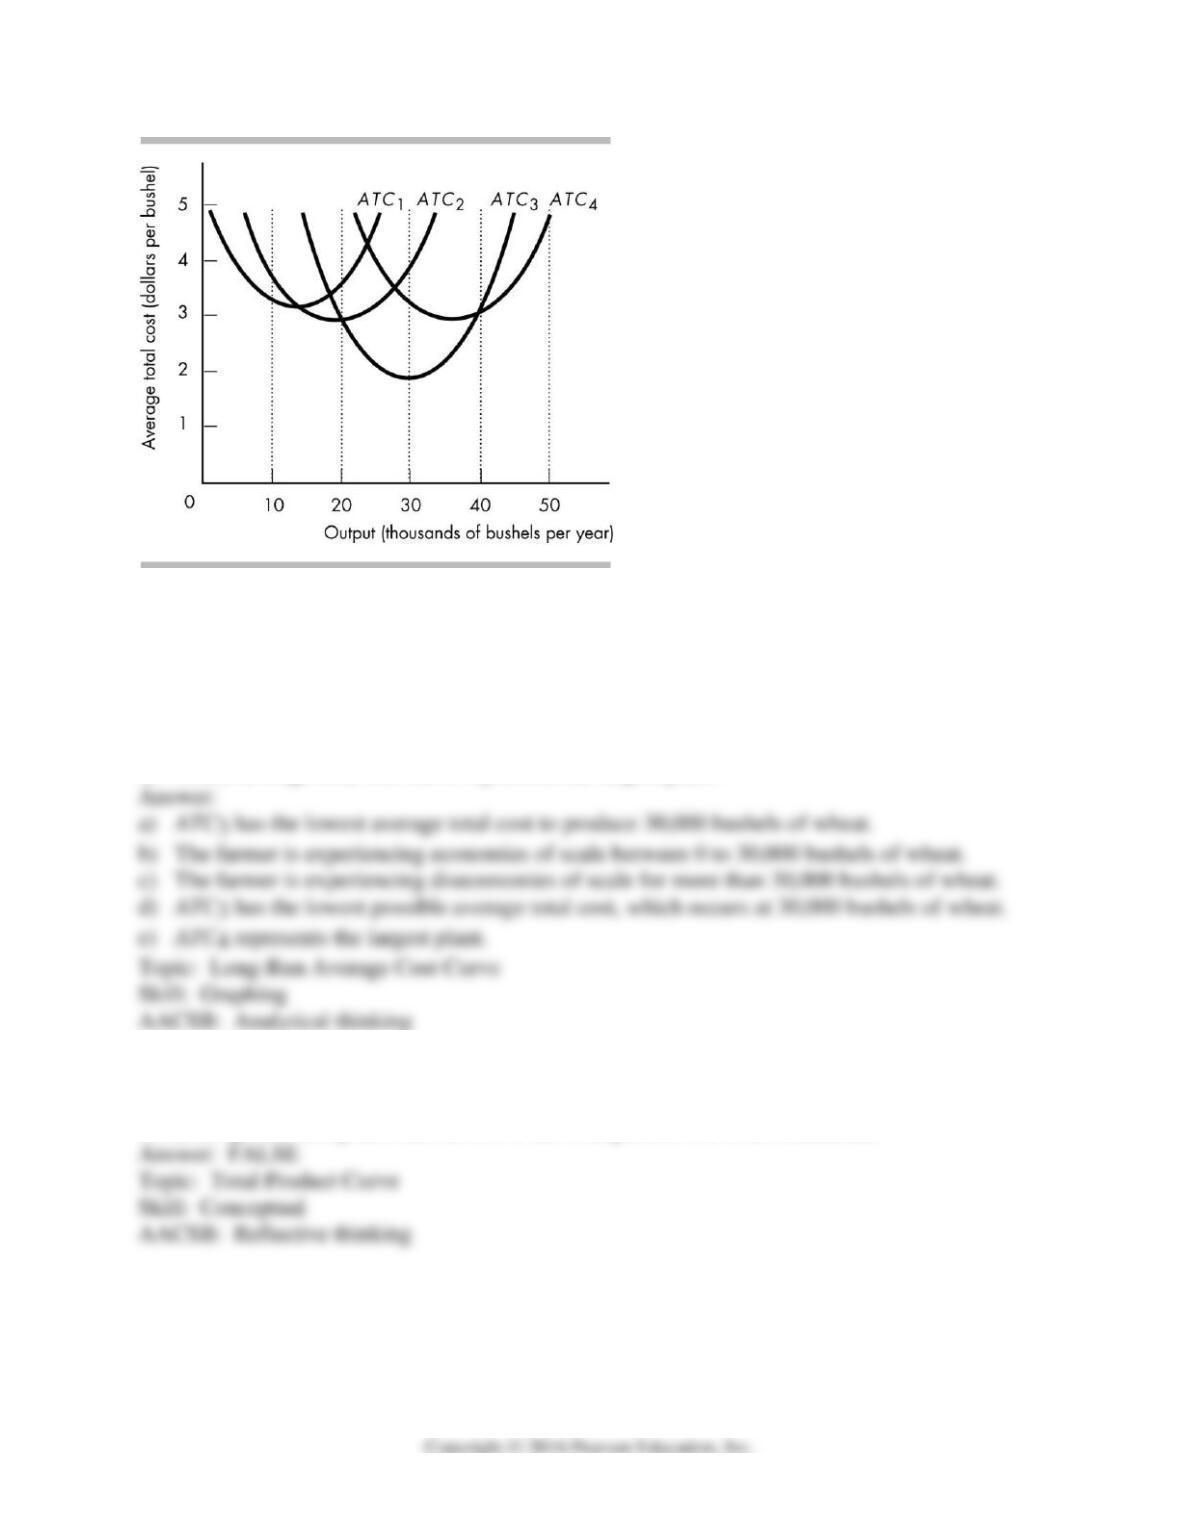
13) The above figure represents the average total cost curves of a wheat farmer.
a) Which average total cost curve has the lowest average total cost of producing 30,000 bushels
of wheat?
b) Over what range of output is the farmer experiencing economies of scale?
c) Over what range of output is the farmer experiencing diseconomies of scale?
d) Which average total cost curve has the lowest possible average cost of production?
e) Which average total cost curve represents the largest plant?
8 True or False
1) All the production points that lie above the total product curve are inefficient.

150
2) The marginal product of labor is defined as the increase in output attributable to the last
worker hired divided by the total number of workers employed.
3) When there are diminishing marginal returns to labor, the marginal product of the last worker
hired must be negative.
4) When the marginal product of labor exceeds the average product of labor, the average product
must increase when employment increases.
5) When the marginal product of labor is below the average product of labor, the average product
must increase when employment increases.
6) A firm’s total cost in the short run is the sum of its fixed cost plus its variable cost plus its
marginal cost.
7) The term “fixed cost” refers to the cost a firm incurs to produce a specific fixed quantity of
output.
8) In the short run, average fixed cost is constant as output increases.
151
9) Marginal cost refers to the increase in cost attributable to hiring one more unit of labor,
capital, or some other input.
10) The vertical distance between the average variable cost curve and the average total cost
11) The marginal cost curve intersects the average fixed, average variable, and average total cost
curves all at their minimum points.
12) When marginal cost is greater than average cost, average cost decreases as output increases.
13) Over the range of output for which the average product of labor curve is negatively sloped,
the average variable cost curve is positively sloped.
14) Over the range of output for which the marginal product of labor curve is negatively sloped,
the marginal cost curve is negatively sloped.
15) In the long run, total fixed cost equals zero.
152
16) In the long run, total variable cost is zero.
17) A firm’s minimum efficient scale is the largest quantity of output at which long-run average
cost reaches its highest level.
18) When a firm’s long-run average cost is constant as output increases, the firm is experiencing
constant returns to scale.
19) Diminishing marginal returns and diseconomies of scale are two different names for the
same thing.
20) The long-run average cost curve is the relationship between the highest attainable average
total cost and output when both the plant size and labor are varied.
21) A firm’s long-run average cost curve is derived from a series of short-run average total cost
curves.
153
22) A firm’s long-run average cost curve is derived by adding together its short-run average total
cost curves.
154
9 Extended Problems
Output (pizzas per day)
Labor
(workers)
Plant 1
Plant 2
Plant 3
Plant 4
1
8
11
13
14
2
18
22
24
25
3
26
30
33
35
4
31
36
40
43
5
34
40
45
50
6
35
42
48
54
7
33
40
47
54
Ovens
1
2
3
4
1) Tony’s Pizza’s production function is shown in the table above.
a) Suppose Tony operates Plant 2. He hires 2 workers and produces 20 pizzas a day. Is the
pizzeria technologically efficient? Why or why not?
b) Suppose Tony operates Plant 1. He hires 2 workers and produces 18 pizzas per day. Is Tony’s
Pizza technologically efficient? Why or why not? Can Tony increase production to 22 pizzas a
day in the short run? If yes, how?
c) Suppose Tony operates Plant 3. What is the marginal product of labor when the fourth
worker is hired? When operating Plant 3, does Tony experience diminishing marginal returns?
Explain.
d) Suppose Tony currently uses Plant 3. Can he increase production from 40 to 50 pizzas per
day in the short run? In the long run? If yes, how?
Answer:
155
2) Tony’s Pizza’s production function is shown in the table above. Tony currently operates Plant
1. He hires workers at a wage rate of $50 a day and his total fixed cost is $100.
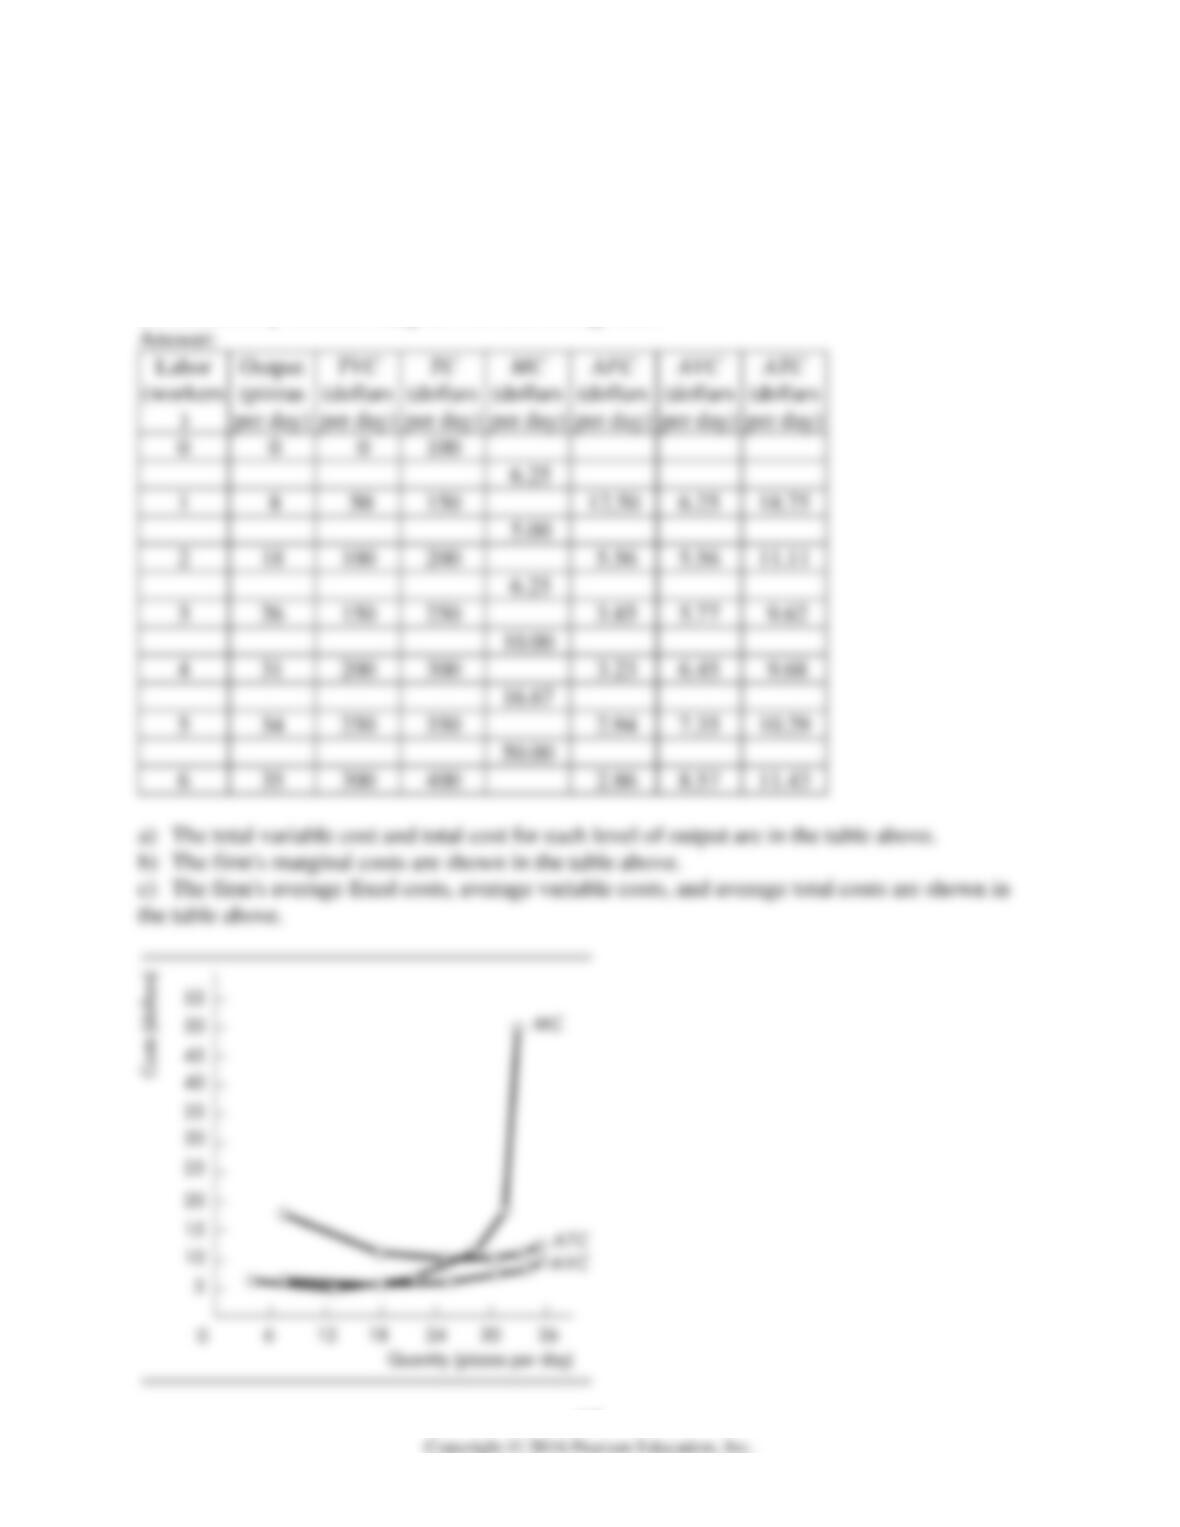
a) Calculate Tony’s Pizza’s total variable cost and total cost for each output level.
b) Calculate Tony’s marginal costs.
c) Calculate the average fixed costs, average variable costs, and average total costs.
d) Draw Tony’s marginal, average variable, and average total cost curves in one figure. What is
the relationship between marginal cost and average cost?
156
3) Tony’s Pizza’s production function is shown in the table above. Tony currently operates Plant
2. He hires workers at a wage rate of $50 a day and his total fixed cost is $150.
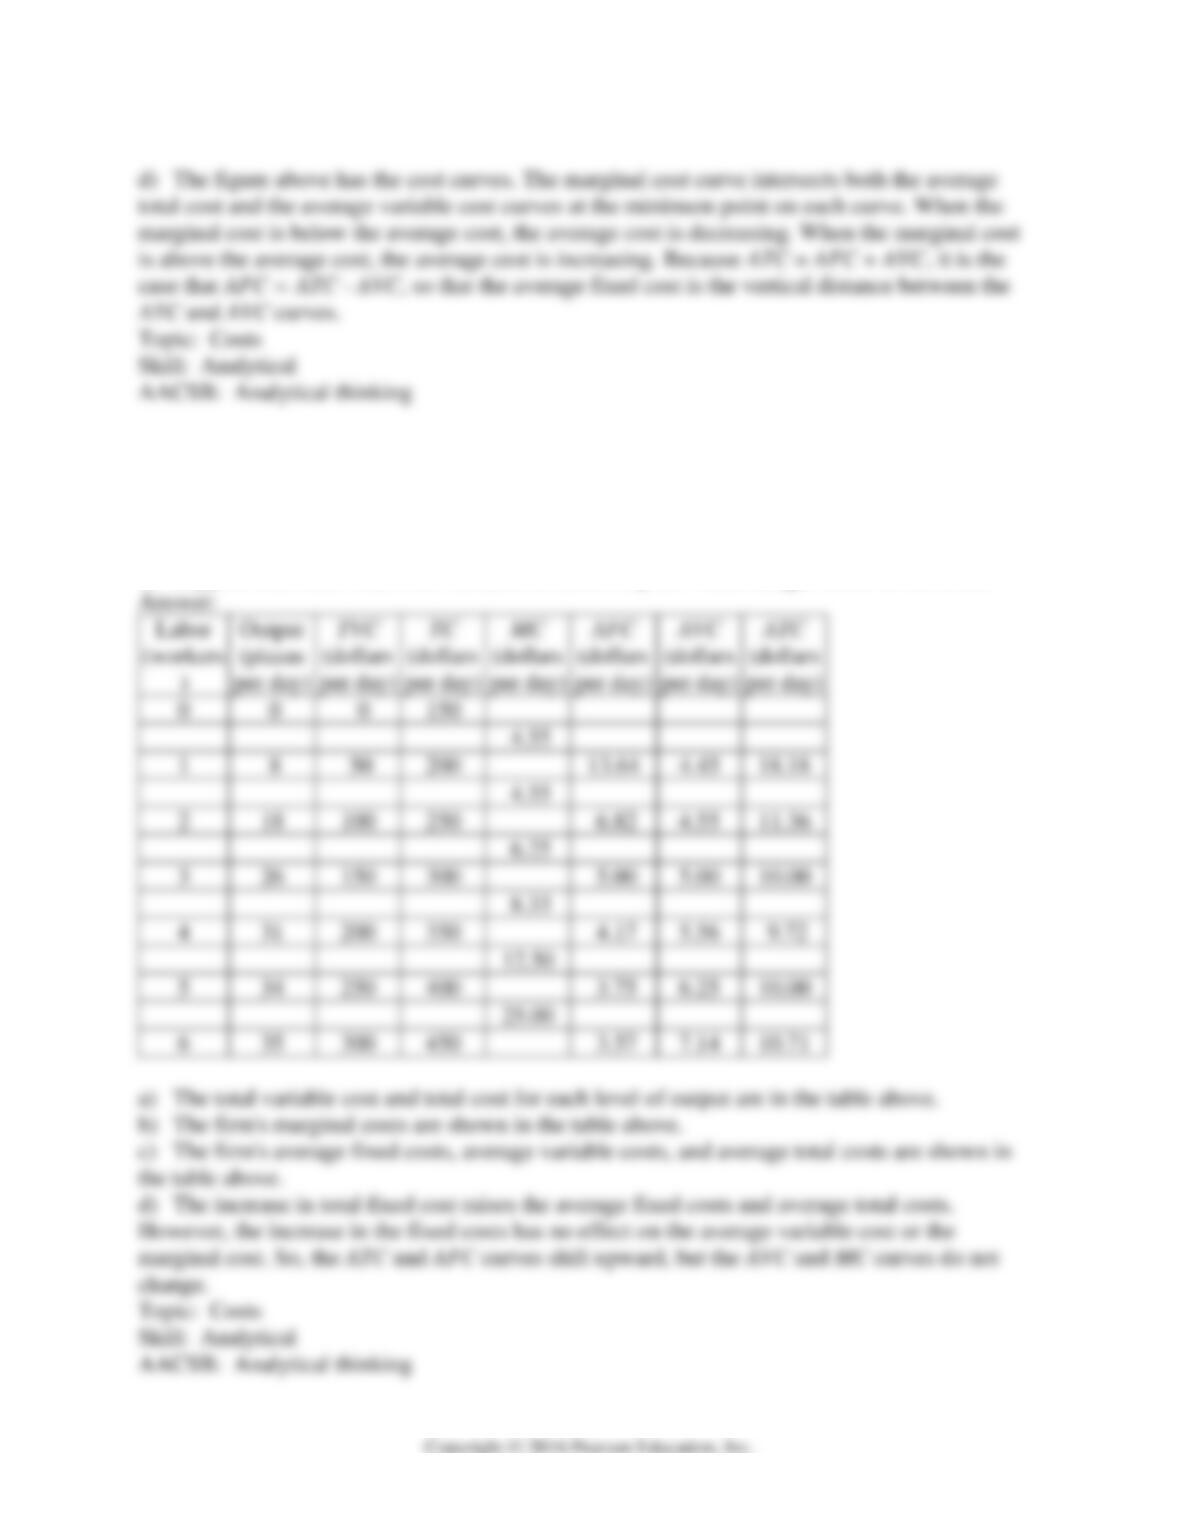
a) Calculate Tony’s Pizza’s total variable cost and total cost for each output level.
b) Calculate the marginal costs.
c) Calculate the average fixed costs, average variable costs, and average total costs.
d) Suppose that total fixed cost increases to $200. Explain what changes occur in the costs.
157
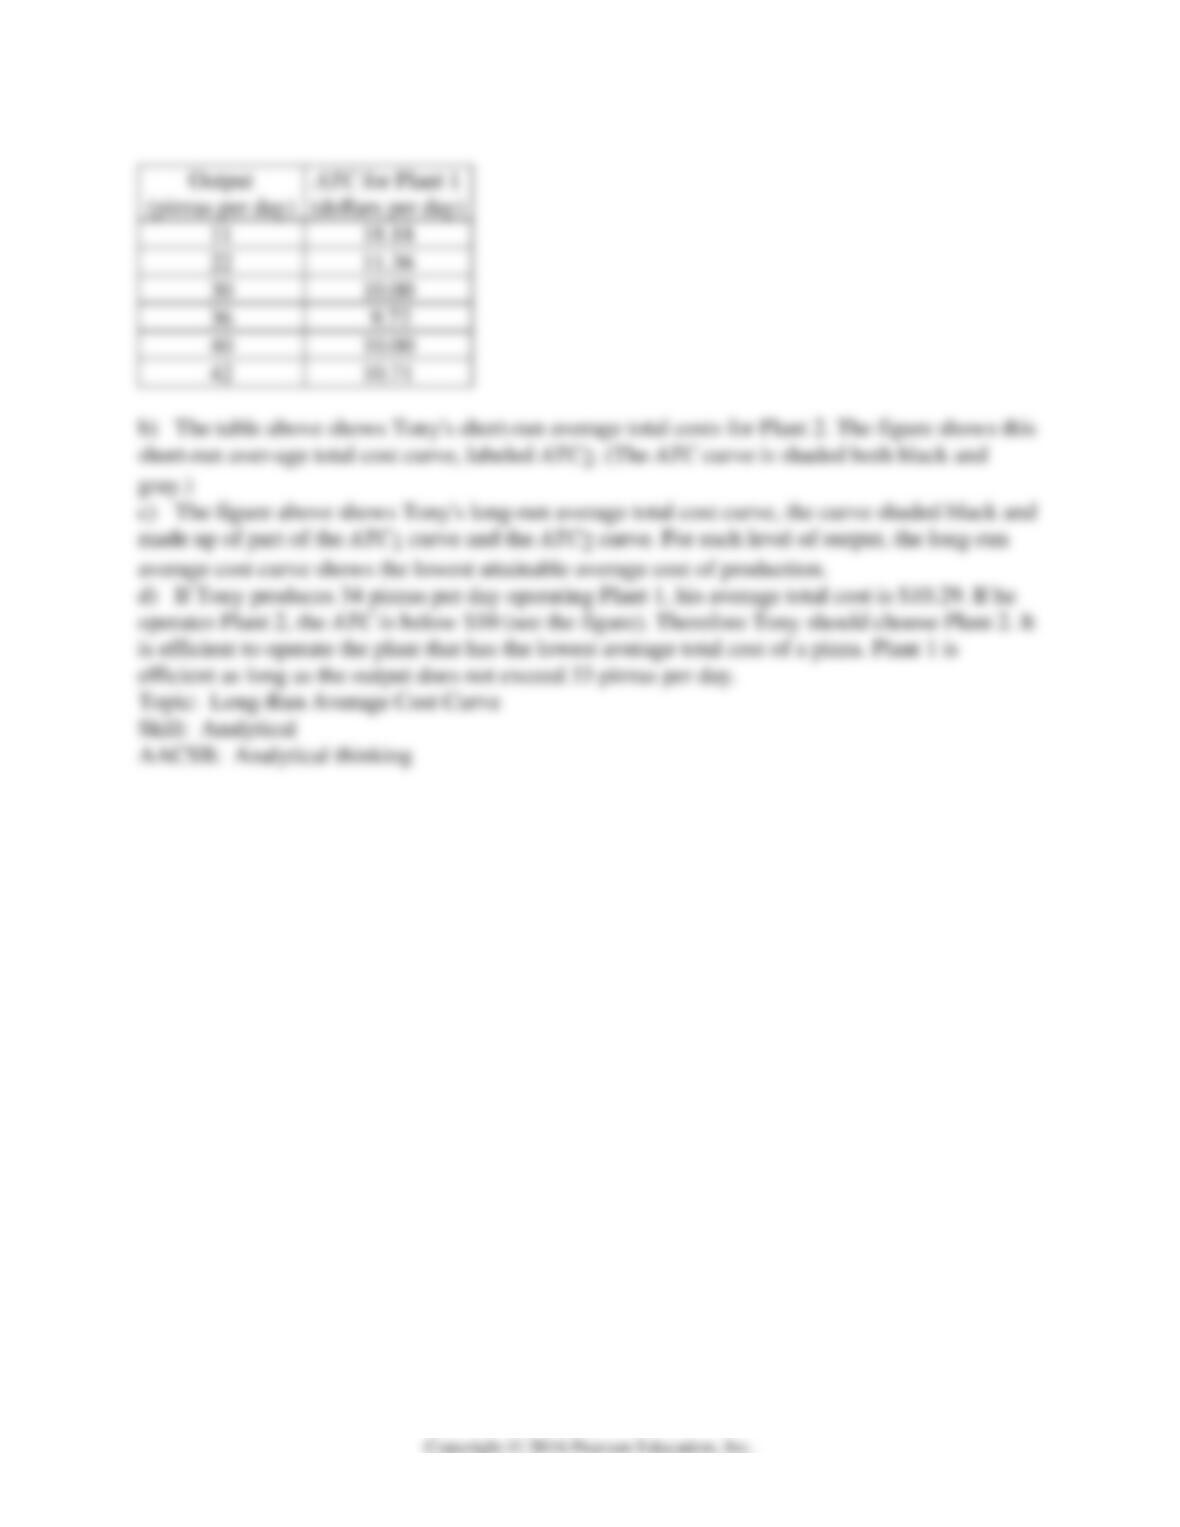
4) Tony’s Pizza’s production function is shown in the table above. Tony hires workers at a wage
rate of $50 a day and his total fixed cost is $100 for Plant 1 and $150 for Plant 2.
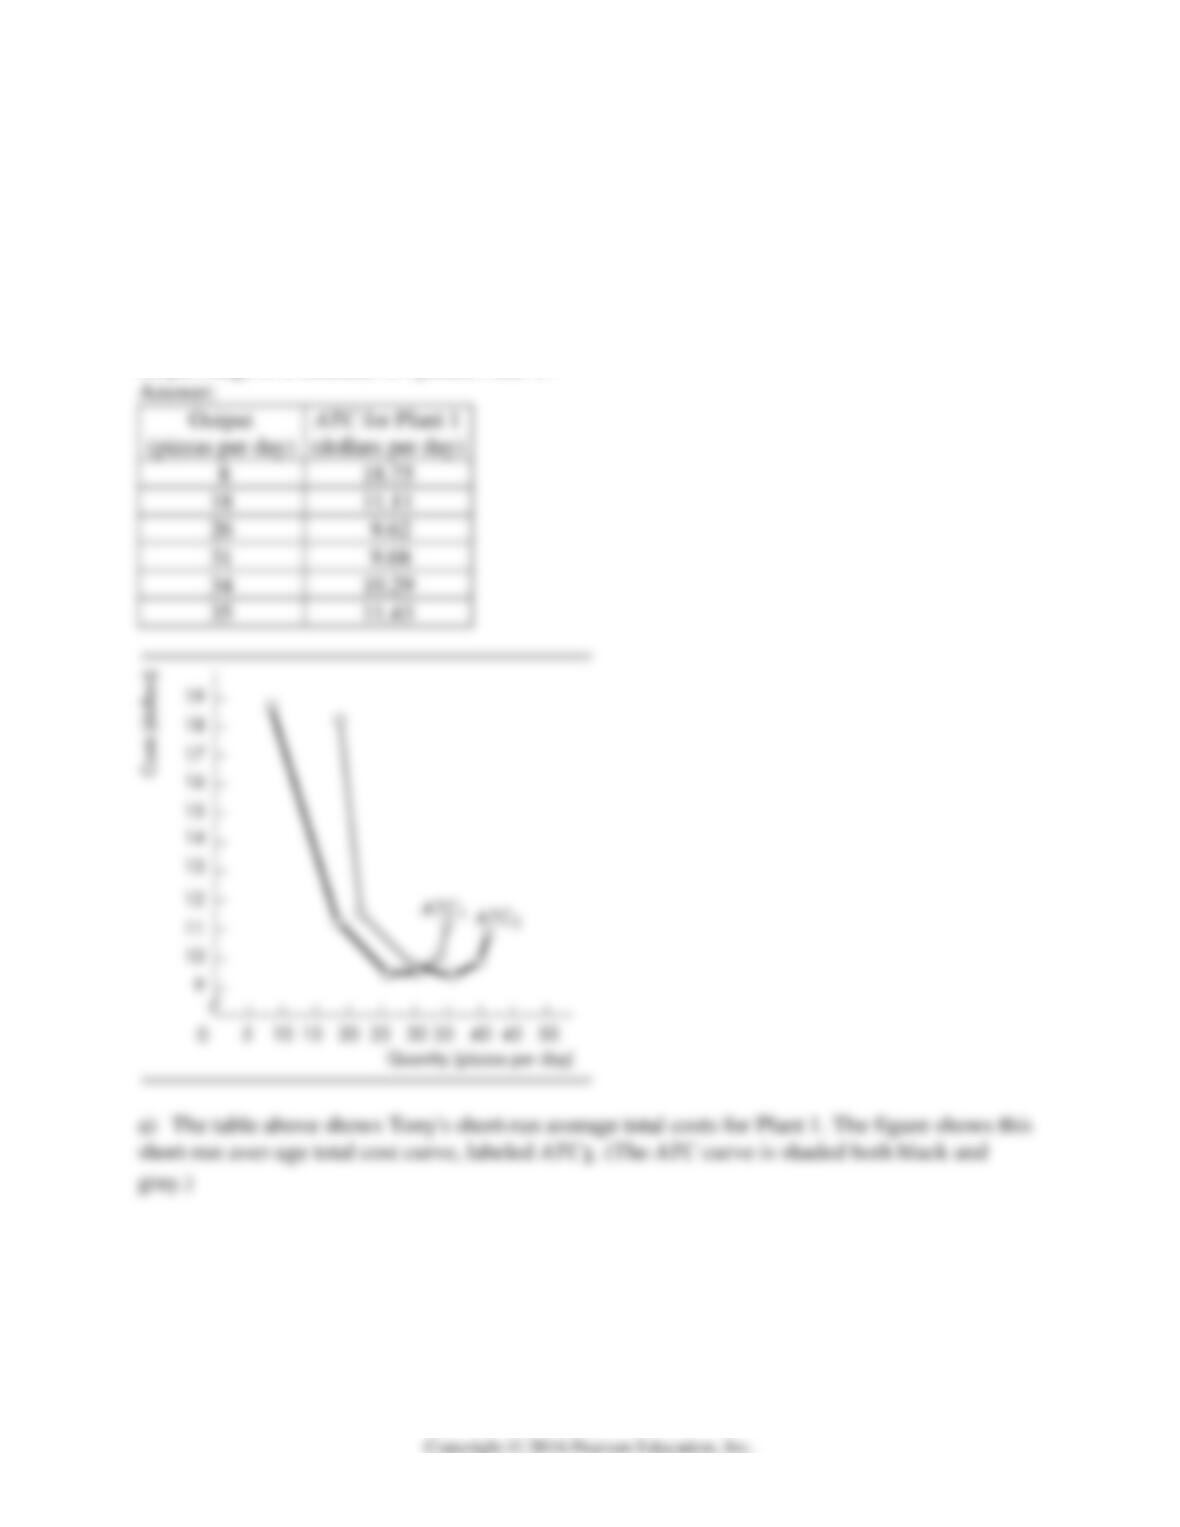
a) Calculate Tony’s Pizza’s average total costs for Plant 1. Draw the short-run average total cost
curve.
b) Calculate average total costs for Plant 2. Draw the short-run average total cost curve on the
same figure that you used for part a.
c) In the figure, illustrate Tony’s long-run average cost curve.
d) If Tony wants to produce 34 pizzas per day, what plant size should he choose? Over what
output range is it efficient to operate Plant 1?
158