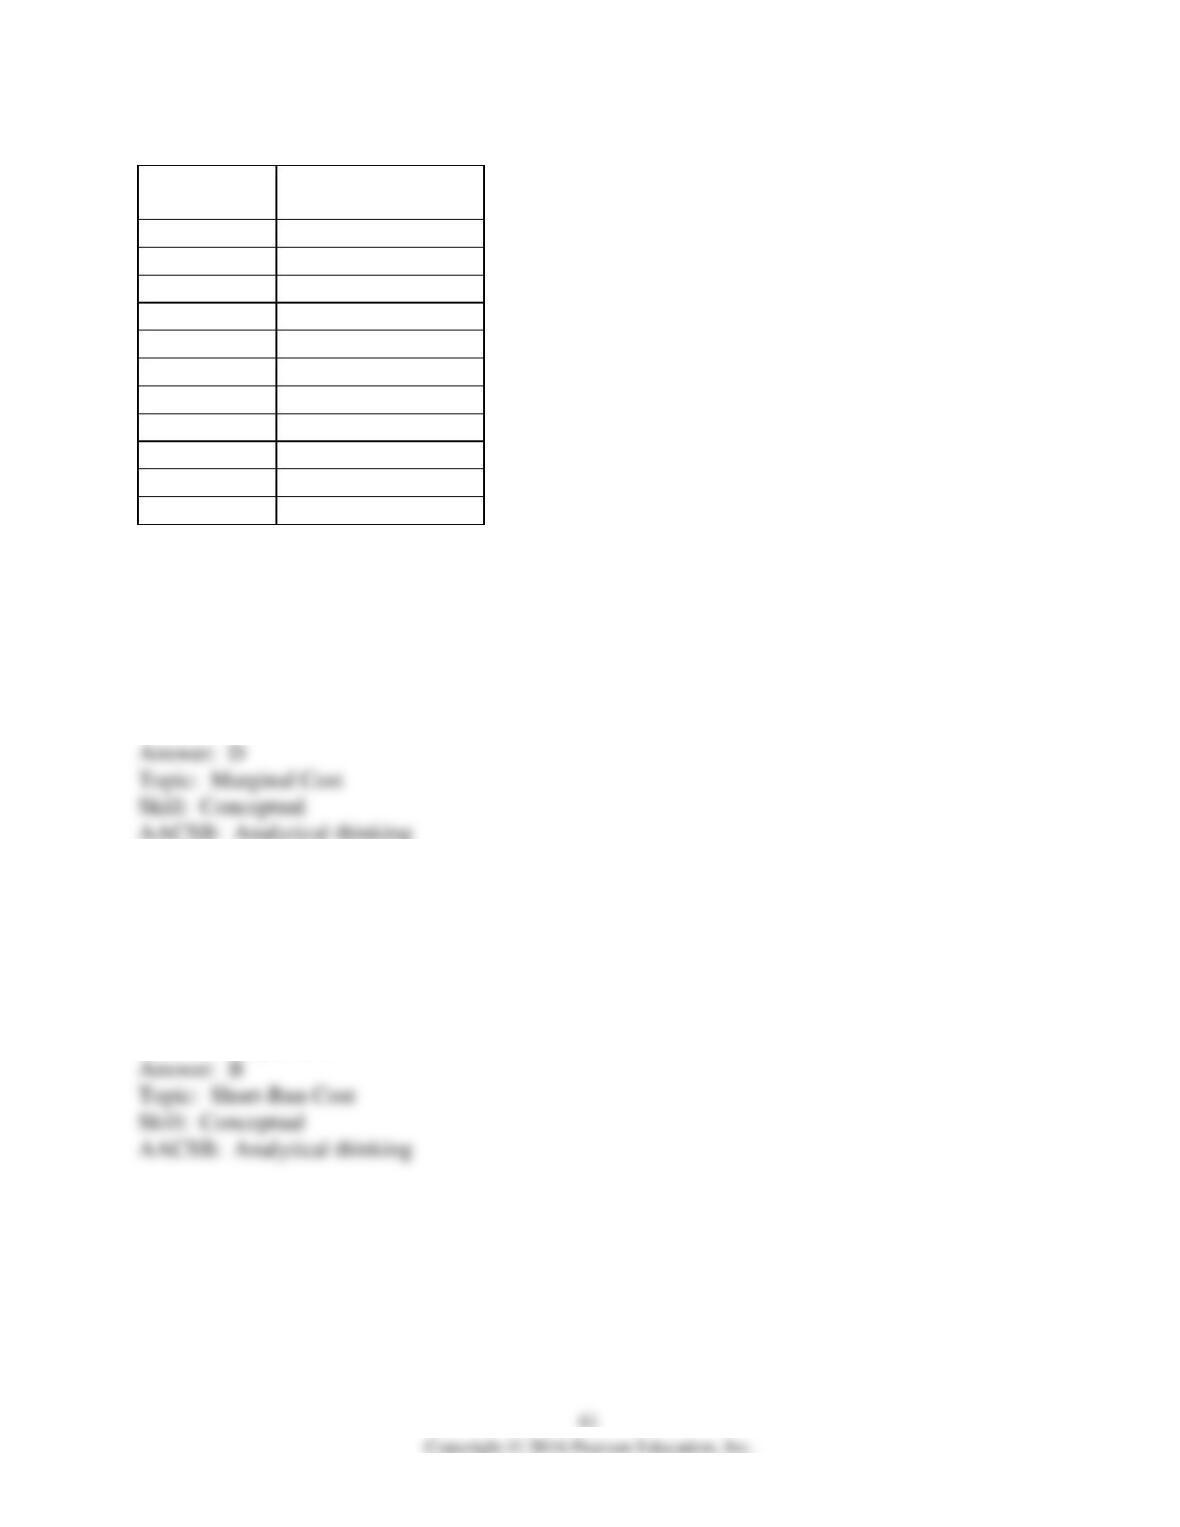
Labor
(workers)
Total product
(books sold per hour)
0
0
1
10
2
24
3
40
4
58
5
73
6
83
7
87
8
89
9
90
10
90
66) The above table shows the total product schedule for the campus book store. If employees
are paid $6 per hour and there are no other variable costs, then what is the marginal cost (MC)
per book of increasing book sales from 83 to 87 books per hour?
A) $6.00
B) $4.00
C) $2.07
D) $1.50
67) The above table shows the total product schedule for the campus book store. If each
employee is paid $6 per hour and there are no other variable costs, then at what level of books
sold per hour does the marginal cost begin to increase?
A) 41 books per hour
B) 59 books per hour
C) 73 books per hour
D) 90 books per hour
68) The above table shows the total product schedule for the campus book store. If each
employee is paid $6 per hour, what is the average variable cost of selling 83 books per hour
(assuming labor costs are the only variable costs of production)?
A) $0.43 per book
B) $0.07 per book
C) $2.30 per book
D) $6.00 per book
69) The above table shows the total product schedule for the campus book store. If employees
are paid $6 per hour, assuming there are no other variable costs, then the average variable cost of
selling books will reach its minimum at
A) 58 books sold per hour.
B) 59 books sold per hour.
C) 73 books sold per hour.
D) 83 books sold per hour.
70) The above table shows the total product schedule for the campus book store. When the book
store is selling 60 books per hour it is certain that
A) marginal costs are increasing, but average variable costs are still decreasing.
B) both marginal and average costs are decreasing.
C) both marginal and average costs are increasing.
D) hiring one more employee per hour will lead to fewer books being sold.
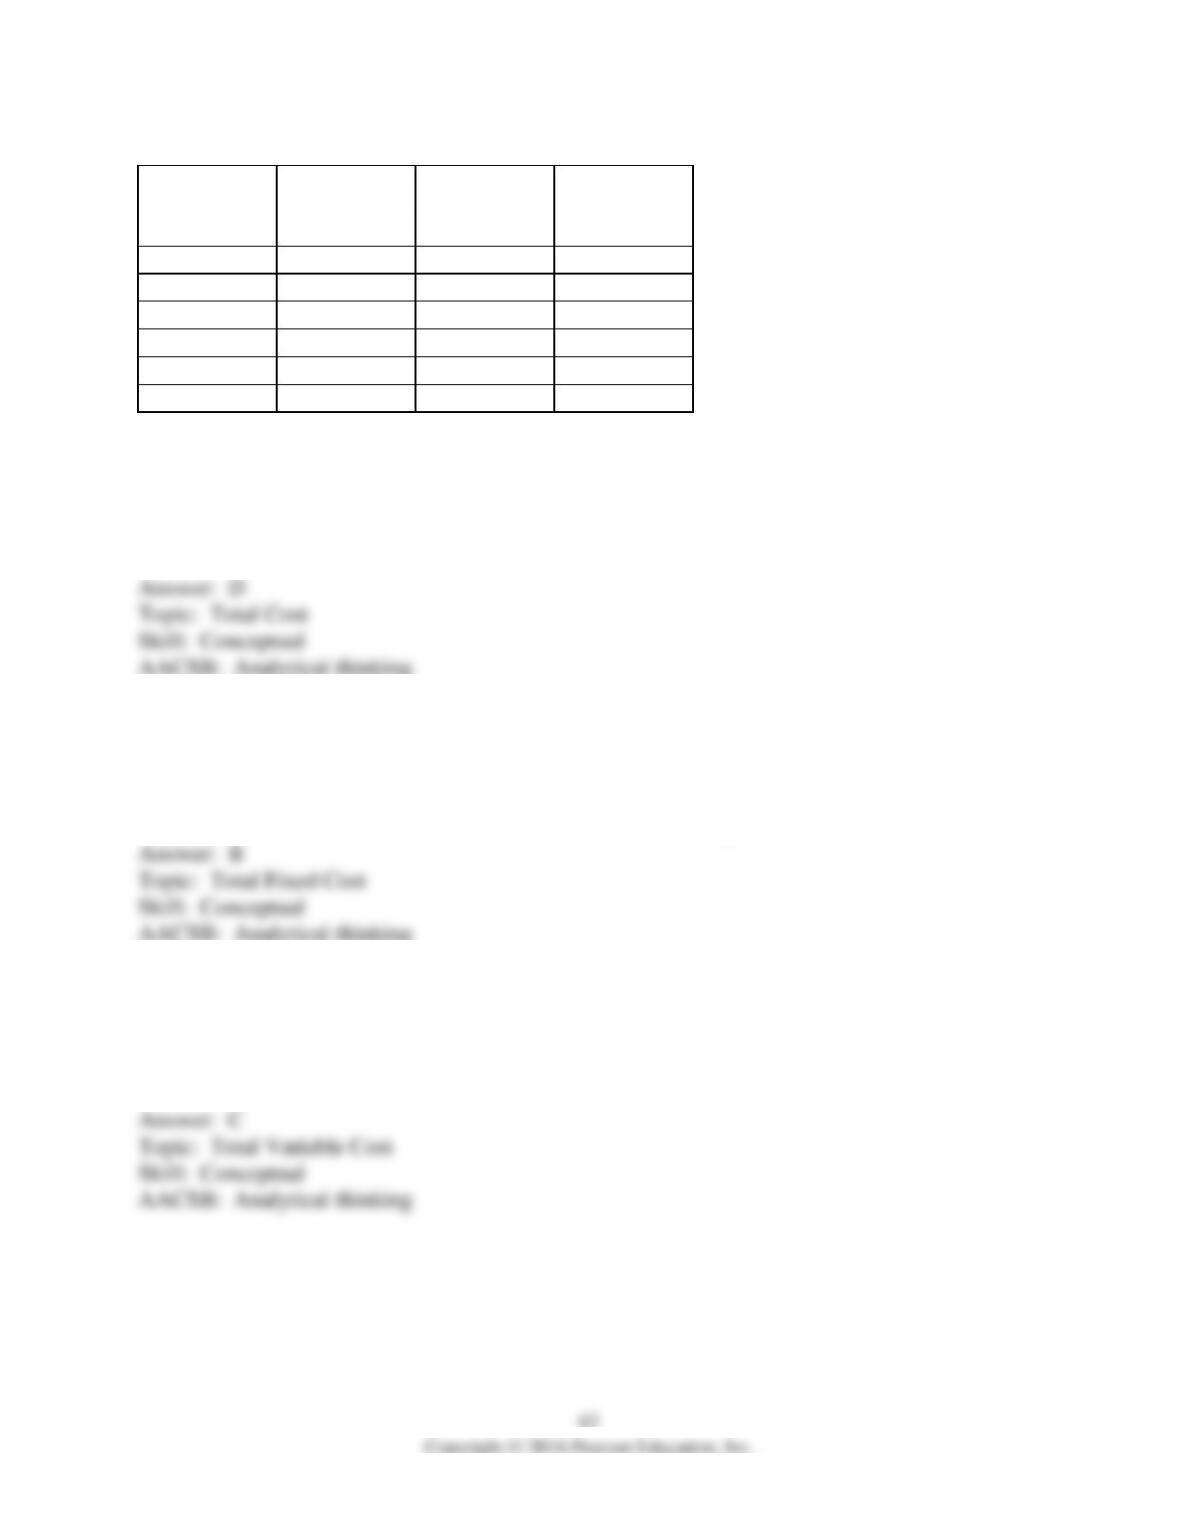
Cost schedule
Labor
(workers)
Output
(units per day)
Total fixed
cost (dollars)
Total variable
cost
(dollars)
0
0
20
0
1
4
20
25
2
9
20
50
3
13
20
75
4
16
20
100
5
18
20
125
71) In the above table, the total cost of producing 9 units of output is
A) $20.
B) $30.
C) $50.
D) $70.
72) The above table shows a firm’s
A) long-run costs.
B) short-run costs.
C) short-run and long-run costs.
D) More information is needed to determine if the costs are long-run costs or short-run costs.
73) In the above table, the total variable cost of producing 16 units of output is
A) $20.
B) $60.
C) $100.
D) $120.
74) Using the data in the above table, when output increases from 4 to 9 units, the marginal cost
of one of those 5 units is
A) $4.00.
B) $4.25.
C) $5.00.
D) $6.25.
75) Using the data in the above table, the average fixed cost of producing 9 units per day is
A) $2.22.
B) $5.00.
C) $5.55.
D) $20.00.
76) Using the data in the above table, the average total cost of producing 16 units per day is
A) $1.25.
B) $6.25.
C) $7.00
D) $7.50.
Output
(pies)
Total variable
cost
(dollars)
Total cost
(dollars)
0
0
300
100
400
200
1,000
300
1,800
400
2,800
77) The above table gives some of the costs of the Delicious Pie Company. What is the total
fixed cost of producing 100 pies?
A) $300
B) $400
C) $700
D) More information is needed to calculate the total fixed cost.
78) The above table gives some of the costs of the Delicious Pie Company. The marginal cost of
increasing pie output from 200 to 300 pies equals ________ per pie.
A) $1.800
B) $1,000
C) $8
D) $6
79) The above table gives some of the costs of the Delicious Pie Company. What is the average
variable cost of producing 300 pies?
A) $1,800
B) $6
C) $5
D) More information is needed to calculate the average variable cost.
80) The above table gives some of the costs of the Delicious Pie Company. What is the average
total cost of producing 200 pies?
A) $5.00
B) $650
C) $6.50
D) More information is needed to calculate the average total cost.
Labor (workers
per hour)
Total product
(baseball hats per
hour)
0
0
1
4
2
10
3
18
4
25
5
30
81) The table above gives production information for Bob’s Baseball Cap Company. Bob’s total
cost when zero caps are produced is $200 and workers cost $10 per hour. The total fixed cost of
producing 10 baseball hats per hour is
A) $400.
B) $200.
C) $22.
D) More information is needed to answer the question.
82) The table above gives production information for Bob’s Baseball Cap Company. Bob’s total
cost when zero caps are produced is $200 and workers cost $10 per hour. The total variable cost
of producing 18 baseball hats per hour is
A) $200.00.
B) $30.00.
C) $1.67.
D) More information is needed to answer the question.
83) The table above gives production information for Bob’s Baseball Cap Company. Bob’s total
cost when zero caps are produced is $200 and workers cost $10 per hour. The total cost of
producing 30 baseball hats per hour is
A) $50.
B) $200.
C) $250.
D) More information is needed to answer the question.
84) The table above gives production information for Bob’s Baseball Cap Company. Bob’s total
cost when zero caps are produced is $200 and workers cost $10 per hour. The average fixed cost
of producing 25 baseball hats per hour is
A) $1.60
B) $8.00.
C) $9.60.
D) More information is needed to answer the question.
85) The table above gives production information for Bob’s Baseball Cap Company. Bob’s total
cost when zero caps are produced is $200 and workers cost $10 per hour. The average variable
cost of producing 10 baseball hats per hour is
A) $1.
B) $2.
C) $20.
D) More information is needed to answer the question.
86) The table above gives production information for Bob’s Baseball Cap Company. Bob’s total
cost when zero caps are produced is $200 and workers cost $10 per hour. The average total cost
of producing 4 baseball hats per hour is
A) $1.67.
B) $50.00.
C) $52.50.
D) More information is needed to answer the question.
87) The table above gives production information for Bob’s Baseball Cap Company. Bob’s total
cost when zero caps are produced is $200 and workers cost $10 per hour. The marginal cost per
hat of producing 30 hats per hour (instead of 25) is
A) $240.00 per hat.
B) $250.00 per hat.
C) $8.33 per hat.
D) $2.00 per hat.
Output
(units)
Total cost
(dollars)
Average
variable cost
(dollars)
Marginal cost
(dollars)
0
10
3
80
9
20
14
290
17
380
88) The above (incomplete) table provides information about the relationships between output
and various cost measures. The total fixed cost (TFC) for the firm is
A) zero.
B) $45.
C) $10.
D) None of the above answers is correct.
89) The above (incomplete) table provides information about the relationships between output
and various cost measures. The total cost (TC) of producing 9 units of output is
A) $180.
B) $190.
C) $20.
D) None of the above answers is correct.
90) The above (incomplete) table provides information about the relationships between output
and various cost measures. The marginal cost per unit when increasing output from 14 to 17
units is
A) $20.
B) $30.
C) $380.
D) None of the above answers is correct.
Answer: B
Topic: Marginal Cost
Skill: Conceptual
AACSB: Analytical thinking
Output
(tents)
Total
fixed cost
(dollars)
Total
variable cost
(dollars)
Total cost
(dollars)
0
50
0
50
1
50
25
75
2
50
45
95
3
50
70
120
4
50
115
165
91) The above table shows some cost data for Tracey’s Tents. What is the marginal cost of the
3rd tent?
A) $25
B) $20
C) $70
D) $120
92) The above table shows some cost data for Tracey’s Tents. What is the average total cost
when output is 3?
A) $120
B) $30
C) $40
D) $50
93) The above table shows some cost data for Tracey’s Tents. What is the average fixed cost
when 4 tents are produced?
A) $50.00
B) $12.50
C) $25.00
D) $37.50
Quantity
(barrels of
pickles)
Total variable
cost
(dollars)
0
0
1
20
2
35
3
50
4
75
5
110
6
160
94) The above table gives some cost data for Peter’s Pickles. Peter’s fixed cost is $20. His total
cost of producing 6 barrels of pickles is
A) $160.
B) $180.
C) $450.
D) There is not enough information to answer the question.
95) The above table gives some cost data for Peter’s Pickles. Peter’s fixed cost is $20. The
marginal cost of increasing output from 3 to 4 barrels of pickles is
A) $25.
B) $75.
C) $20.
D) $50.
96) The above table gives some cost data for Peter’s Pickles. Peter’s fixed cost is $20. The
average total cost (ATC) when 5 barrels of pickles are produced is
A) $22.
B) $26.
C) $35.
D) There is not enough information to answer the question.
97) The above table gives some cost data for Peter’s Pickles. Peter’s fixed cost is $20. Average
variable cost (AVC) is lowest when output is equal to
A) 1 barrel of pickles.
B) 2 barrels of pickles.
C) 3 barrels of pickles.
D) 4 barrels of pickles.
Output
(T shirts per hour)
Total cost
(dollars)
Total variable cost
(dollars)
4
42
22
5
50
30
6
60
40
98) The table above gives the cost of producing T-shirts. The total fixed cost is ________ and the
marginal cost of increasing production from 5 to 6 T shirts is ________.
A) $20; $6
B) $20; $10
C) $10.40; $8
D) unable to be determined; $8
99) The table above gives the cost of producing T-shirts. When 5 T-shirts are produced, the
average fixed cost is ________ and the average variable cost is ________.
A) $4; $10
B) $10; $6
C) $5; $3
D) $4; $6
Cost schedule
Labor
(workers)
Output
(units per day)
Total variable
cost
(dollars)
Total cost
(dollars)
0
0
0
30
1
3
20
50
2
8
40
70
3
12
60
90
4
14
80
110
5
15
100
130
100) In the above table, the total fixed cost is
A) $0.
B) $20.
C) $30.
D) $50.
101) In the above table, when output increases from 8 to 12 units, the marginal cost of one of
those 4 units is
A) $1.20.
B) $2.00.
C) $5.00.
D) $15.00.
102) In the above table, the average fixed cost of producing 15 units of output is
A) $0.50.
B) $2.00.
C) $6.66.
D) $8.66.
103) In the above table, the average variable cost of producing 14 units of output is
A) $0.175.
B) $5.71.
C) $7.86.
D) $10.00.
104) In the above table, the average total cost of producing 14 units of output is
A) $5.71.
B) $6.75.
C) $7.00.
D) $7.86.
105) A firm’s average total cost is $100, its average variable cost is $90, and its total fixed cost is
$1,000. Its output is
A) less than 70 units.
B) between 70 and 120 units.
C) between 120 and 170 units.
D) more than 170 units.
106) A firm’s average total cost is $80, its average variable cost is $75, and its output is 50 units.
Its total fixed cost is
A) less than $100.
B) between $100 and $200.
C) between $200 and $300.
D) more than $300.
107) A firm’s average variable cost is $60, its total fixed cost is $3,000, and its output is 600
units. Its average total cost is
A) less than $58.
B) between $58 and $62.
C) between $62 and $64.
D) more than $64.
108) A firm’s average variable cost is $90, its total fixed cost is $10,000, and its output is 1,000
units. Its total cost is
A) less than $85,000.
B) between $85,000 and $95,000.
C) between $95,000 and $105,000.
D) more than $105,000.
109) A firm’s average total cost is $80, its fixed cost is $1000, and its output is 100 units. Its
average variable cost
A) is less than $40.
B) is between $40 and $60.
C) is more than $60.
D) cannot be determined without more information.
110) A firm’s marginal cost is $30, its average total cost is $50, and its output is 800 units. Its
total cost of producing 801 units is
A) less than $40,000.
B) between $40,000 and $40,050.
C) between $40,050 and $40,080.
D) greater than $40,080.
111) A firm’s marginal cost is $82, its average total cost is $50, and its output is 800 units. Its
total cost of producing 801 units is
A) less than $40,000.
B) between $40,000 and $40,050.
C) between $40,050 and $40,080.
D) greater than $40,080.
112) The vertical distance between a firm’s total cost (TC) and its total variable cost (TVC)
curves
A) decreases as output decreases.
B) is equal to the average variable cost, AVC.
C) is equal to the total fixed cost, TFC.
D) is equal to the marginal cost, MC.
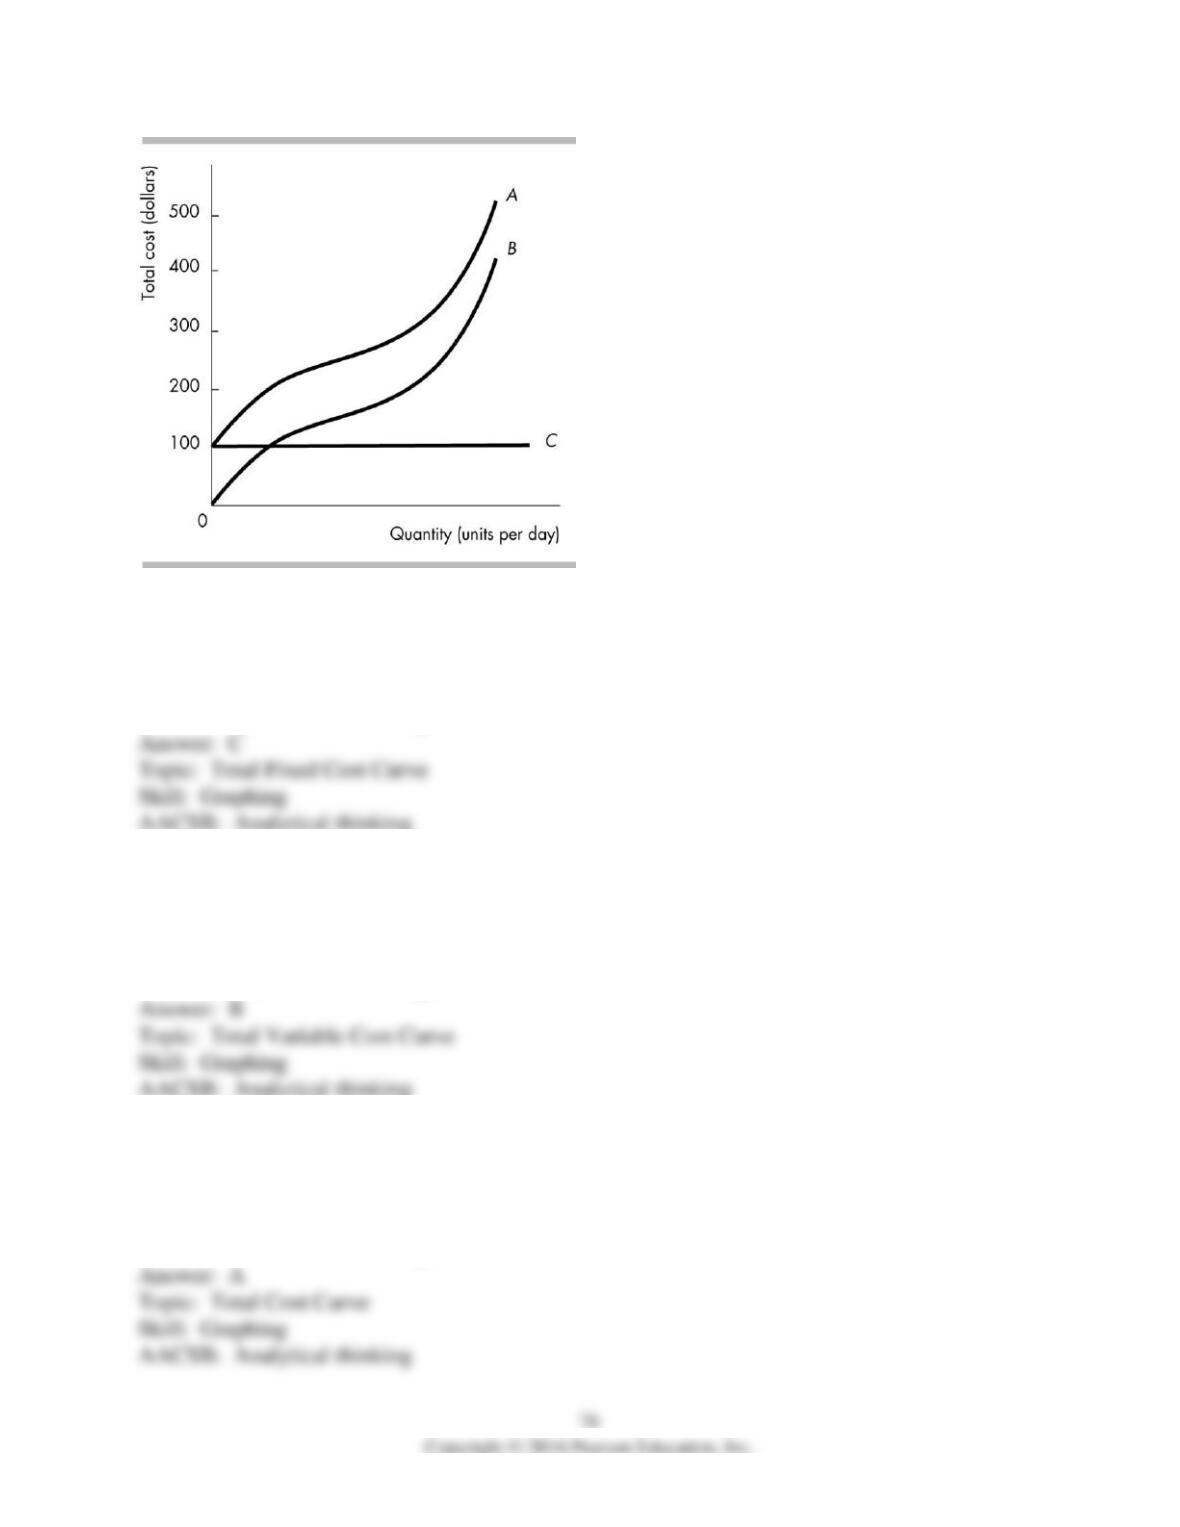
113) In the above figure, the total fixed cost curve is curve
A) A.
B) B.
C) C.
D) none of the curves in the figure.
114) In the above figure, the total variable cost curve is curve
A) A.
B) B.
C) C.
D) none of the curves in the figure.
115) In the above figure, the total cost curve is curve
A) A.
B) B.
C) C.
D) none of the curves in the figure.
116) In the above figure, the relationship between costs indicates that the distance between
curves
A) A and B is equal to the fixed cost.
B) A and B is equal to the variable cost.
C) B and C is equal to the fixed cost.
D) B and C is equal to the average total cost.
117) Fernando charges the restaurant Flaming Fernando’s $1,000 annually for use of his name. If
Fernando increases the fee for use of his name
A) the restaurant’s average fixed cost, average variable cost, average total cost, and marginal cost
curves all shift upward.
B) the restaurant’s average fixed cost, average total cost, and marginal cost curves shift upward.
C) the restaurant’s average variable cost, average total cost, and marginal cost curves shift
upward.
D) the restaurant’s average fixed cost and average total cost curves shift upward.
118) As output increases, the slope of the curve showing the firm’s average fixed cost is
A) first negative, then positive.
B) first positive, then negative.
C) always negative.
D) always positive.
119) The vertical distance between a firm’s average total cost curve, ATC, and its average
variable cost curve, AVC
A) decreases as output increases.
B) is equal to its marginal cost, MC.
C) is equal to its total fixed cost, TFC.
D) is equal to its average product.
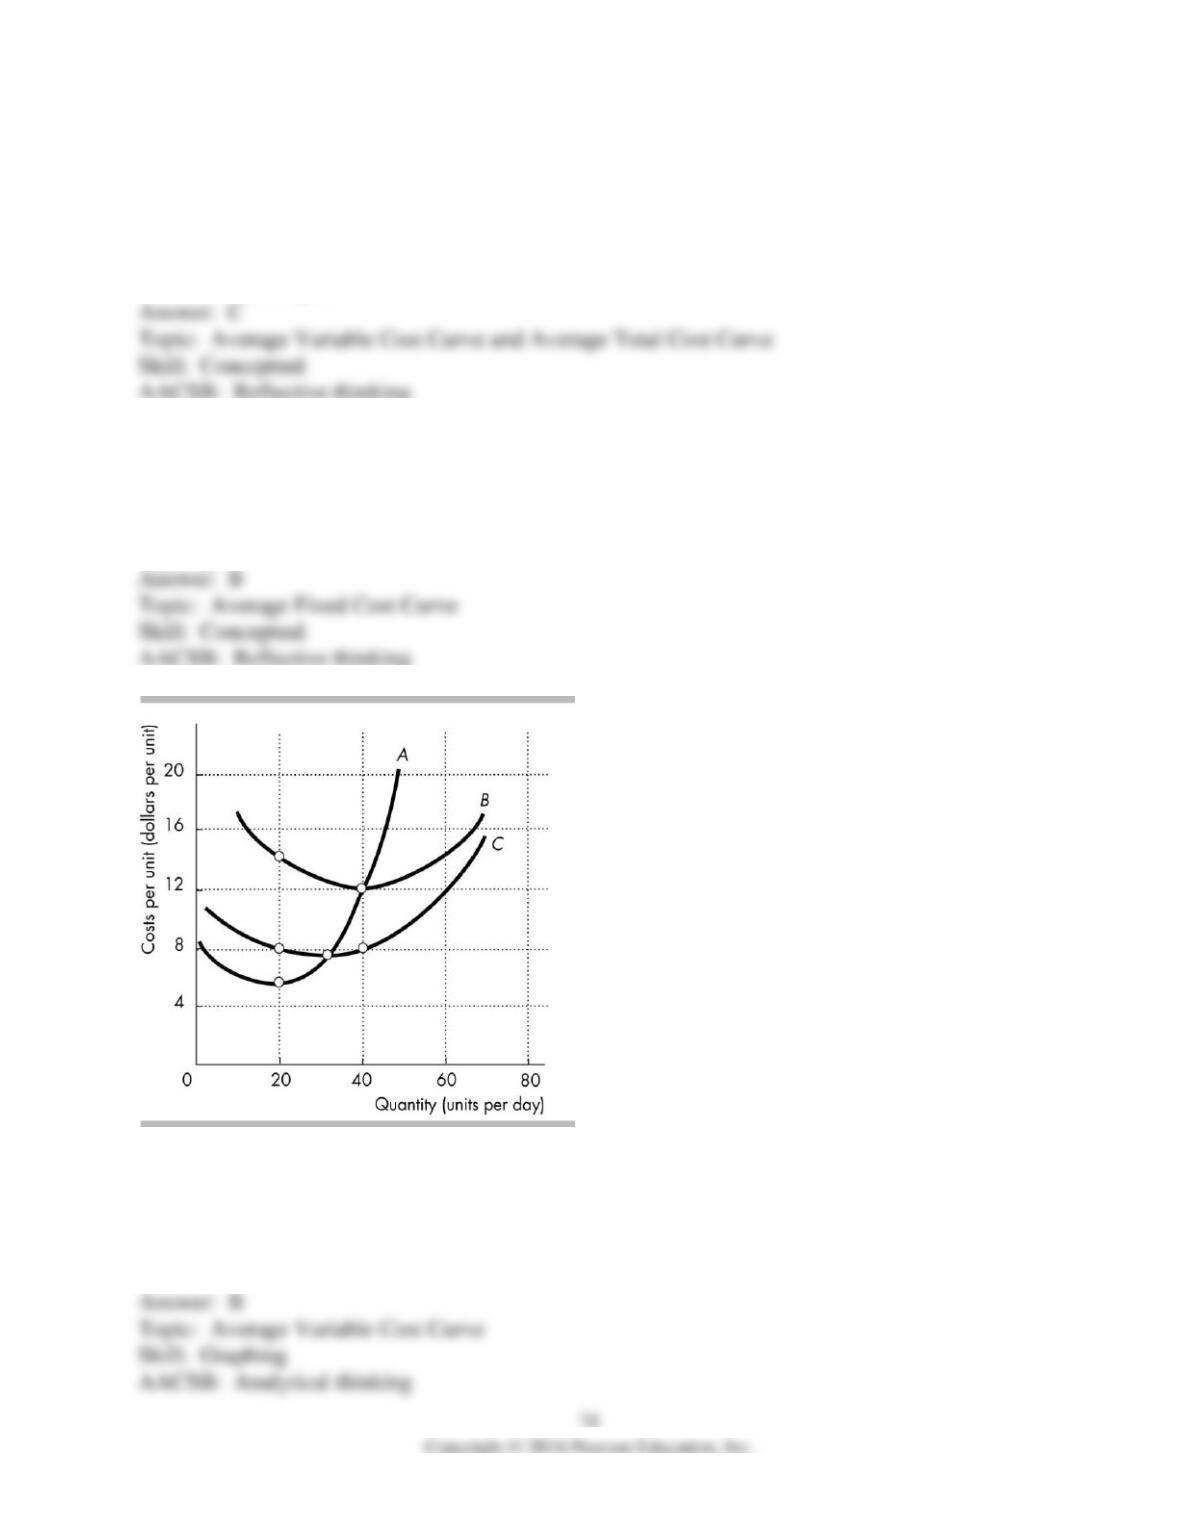
120) The output at which average variable cost is a minimum is ________ than the output at
which ________ is a minimum.
A) the same as; average total cost
B) the same as; marginal cost
C) less than; average total cost
D) less than; marginal cost
121) Which of the following curves is not U-shaped?
A) average variable cost curve
B) average fixed cost curve
C) average total cost curve
D) marginal cost curve
122) In the figure above, curve C is the ________ curve.
A) average fixed cost
B) average variable cost
C) average total cost
D) marginal cost
123) In the figure above, curve A is the ________ curve.
A) average fixed cost
B) average variable cost
C) average total cost
D) marginal cost
124) In the figure above, curve B is the ________ curve.
A) average fixed cost
B) average variable cost
C) average total cost
D) marginal cost
125) In the figure above, when 20 units are produced the marginal cost is
A) less than $8.
B) $8.
C) more than $8 and less than $16.
D) None of the above answers is correct.
126) In the figure above, when 40 units are produced the average fixed cost is
A) $4.
B) $8.
C) $12.
D) $20.
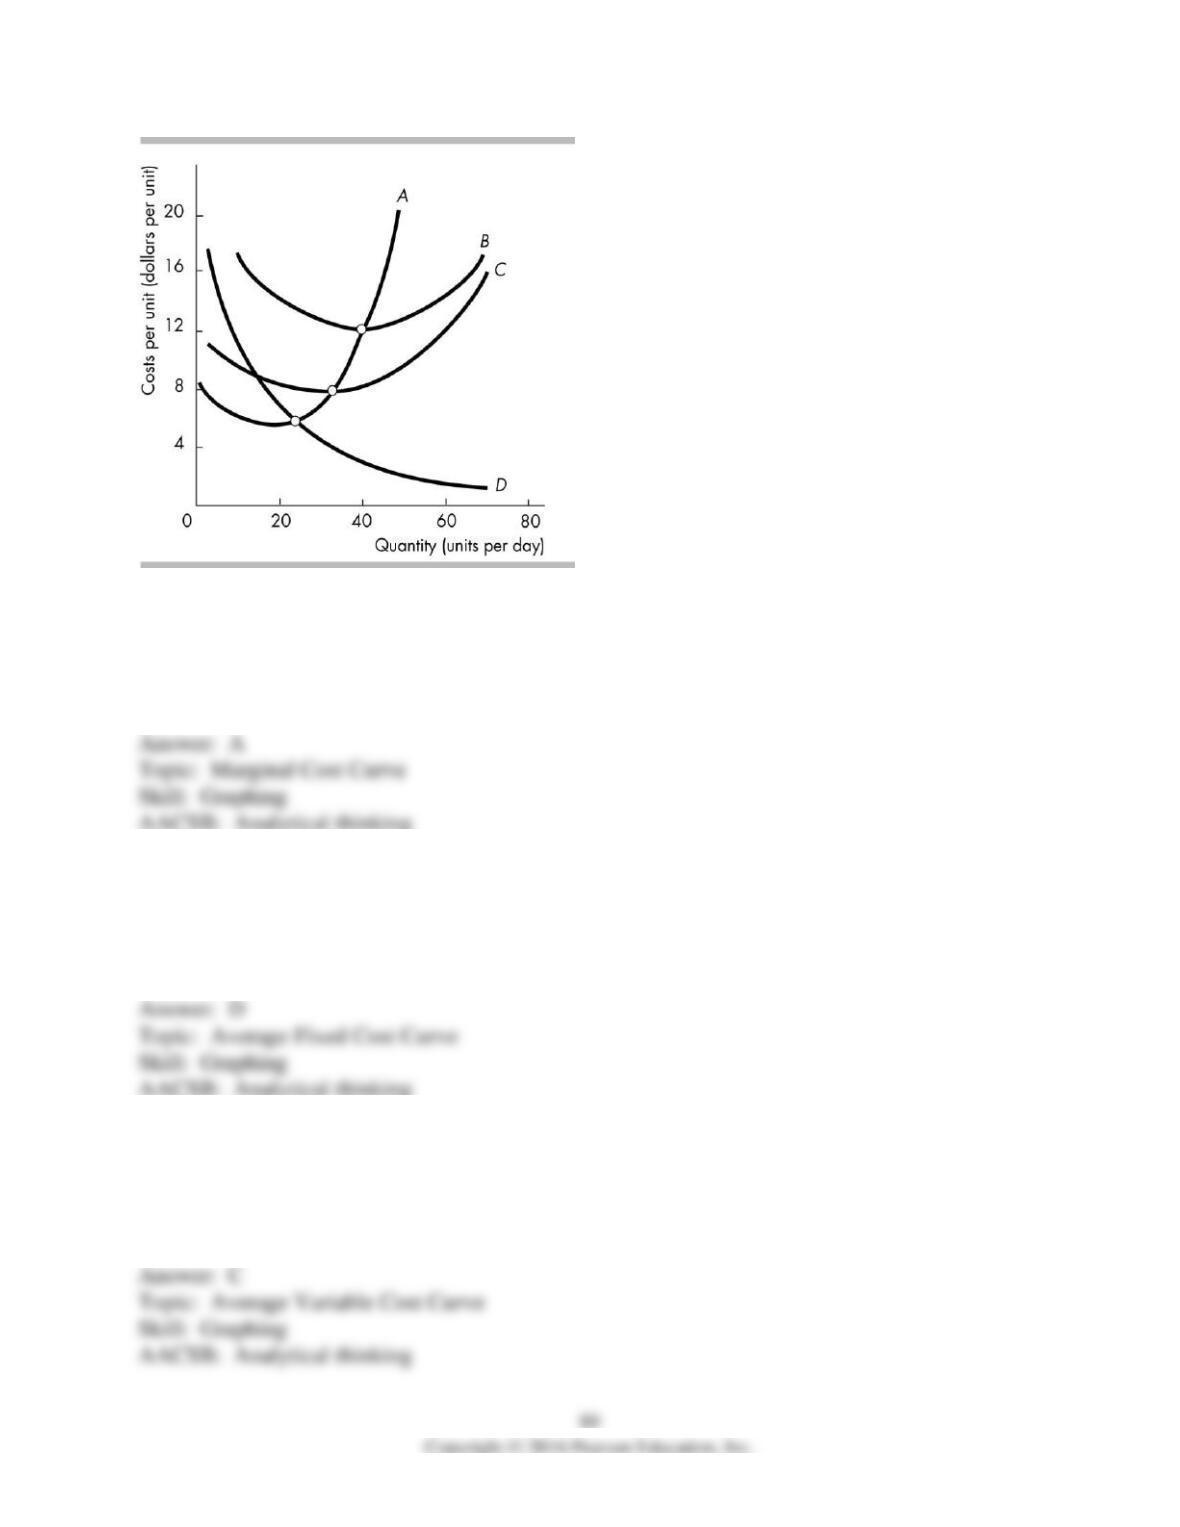
127) In the above figure, the marginal cost curve is curve
A) A.
B) B.
C) C.
D) D.
128) In the above figure, the average fixed cost curve is curve
A) A.
B) B.
C) C.
D) D.
129) In the above figure, the average variable cost curve is curve
A) A.
B) B.
C) C.
D) D.