Chapter 11 – Monopolistic Competition and Oligopoly (+ Appendix)
11-1
CHAPTER 11
Monopolistic Competition and Oligopoly (+ Appendix)
A. Short-Answer, Essays, and Problems
1. What are the major features of monopolistic competition compared to pure competition and pure
monopoly?
2. “Pure competition or pure monopoly industries will tend to be one-price industries. Monopolistic
competition, however, is a multiprice industry.” Explain.
3. How does economic rivalry take place in monopolistic competition? Describe the different aspects of
product differentiation and price competition.
4. What are “four–firm” concentration ratios? How do economists use them to define monopolistically
competitive industries and oligopolistic industries?
5. What are types of firms that exemplify monopolistic competition?
6. What is the Herfindahl index and how is it calculated?
7. How are monopolistically competitive industries identified with concentration ratios?
8. Why is the monopolistic competitor’s demand curve more elastic than a pure monopolist’s, but less elastic
than a pure competitor’s? What factors determine the price elasticity of demand for a monopolistic
competitor?
9. Assume that the short-run cost and demand data given in the table below confront a monopolistic
competitor selling a given product and engaged in a given amount of product promotion. Compute the
marginal cost and marginal revenue of each unit of output and enter these figures in the table.
Output Total cost Marginal cost Quantity demanded
Price Marginal revenue
0 $ 25 0 $60
1 40 $_____ 1 55 $_____
2 45 _____ 2 50 _____
3 55 _____ 3 45 _____
4 70 _____ 4 40 _____
5 90 _____ 5 35 _____
6 115 _____ 6 30 _____
7 145 _____ 7 25 _____
8 180 _____ 8 20 _____
9 220 _____ 9 15 _____
10 265 _____ 10 10 _____
(a) At what output level and at what price will the firm produce in the short run? What will be the total
profit?
(b) What will happen to demand, price, and profit in the long run?
Chapter 11 – Monopolistic Competition and Oligopoly (+ Appendix)
11-2
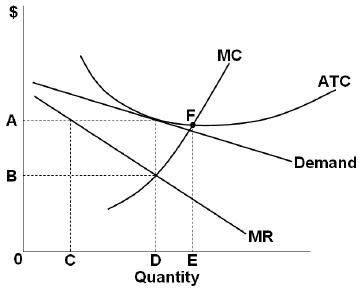
10. Explain why the following graph is likely to represent the long-run equilibrium for a representative firm in
monopolistic competition. What will be the product price, output, and amount of economic profit?
11. In theory, the representative firm in monopolistic competition earns only a normal profit. Why might that
outcome not always occur in the real world of small firms?
12. Assume that the short-run cost and demand data given in the table below confront a monopolistic
competitor selling a given product and engaged in a given amount of product promotion. Compute the
marginal cost and marginal revenue of each unit of output and enter these figures in the table.
Output Total cost Marginal cost Quantity demanded
Price Marginal revenue
0 $ 75 0 $180
1 120 $_____ 1 165 $_____
2 135 _____ 2 150 _____
3 165 _____ 3 135 _____
4 210 _____ 4 120 _____
5 270 _____ 5 105 _____
6 345 _____ 6 90 _____
7 435 _____ 7 75 _____
8 540 _____ 8 60 _____
9 660 _____ 9 45 _____
10 795 _____ 10 30 _____
(a) At what output level and at what price will the firm produce in the short run? What will be the total
profit?
(b) What will happen to demand, price, and profit in the long run?
Chapter 11 – Monopolistic Competition and Oligopoly (+ Appendix)
11-3
13. Assume that the short-run cost and demand data given in the table below confronts a monopolistic
competitor selling a given product and engaged in a given amount of product promotion. Compare the
marginal cost and marginal revenue of each unit of output and enter these figures in the table.
Output Total cost Marginal cost Quantity demanded
Price Marginal revenue
Profit
0 $ 50 0 $60 $_____
1 80 $_____ 1 55 $_____ _____
2 120 _____ 2 50 _____ _____
3 150 _____ 3 45 _____ _____
4 170 _____ 4 40 _____ _____
5 185 _____ 5 35 _____ _____
6 205 _____ 6 30 _____ _____
7 235 _____ 7 25 _____ _____
8 275 _____ 8 20 _____ _____
9 325 _____ 9 15 _____ _____
10 385 _____ 10 10 _____ _____
(a) At what output level and at what price will the firm produce in the short run? What will be the total
profit?
(b) What will happen to demand, price, and profit in the long run? How will the market adjust to achieve
this?
14. In the first graph below, illustrate the cost curves and demand conditions for a monopolistically competitive
firm making short-run profits. In the second graph, illustrate what those conditions are most likely to be in
the long run. Explain the major differences in the two graphs.
15. A monopolistically competitive firm is producing 50 units of output in the short run where marginal cost is
$3.00, average total costs are $5.00, price is $4.50, average variable cost is $4.00, and marginal revenue is
$3.00. How much profit is the firm making? What output recommendation would you make for the firm?
16. In the short run, a monopolistically competitive firm calculates that marginal cost is $6.00, average total
costs are $4.00, and marginal revenue is $3.00. The firm is charging a price of $6.00 and producing 200
units of output. How much profit is the firm making? What output recommendation would you make as
the company economist?
17. If monopolistically competitive firms have some control over their prices, why don’t they set price above
average total cost so they will realize an economic profit in the long run?
18. What are two real-world complications with the long-run conclusion about the representative firm in the
model of monopolistic competition?
19. “In monopolistically competitive markets neither allocative nor productive efficiency is realized.” Explain.
Chapter 11 – Monopolistic Competition and Oligopoly (+ Appendix)
11-4
20. Draw a graph of the cost curves for a monopolistically competitive firm that clearly illustrates the excess
capacity that arises in the long run. Explain why this excess capacity arises.
21. Evaluate this statement: “A monopolistically competitive industry would be more efficient if there were
fewer firms.”
22. Why do monopolistically competitive firms spend funds for product differentiation and advertising when
this practice only adds to the firm’s costs?
23. Explain how monopolistically competitive producers try to improve on the condition of just breaking even
in the long run. Is this improvement a benefit for consumers?
24. Explain why the economic analysis of monopolistic competition is so complex.
25. What are the basic characteristics of oligopoly? How does oligopoly compare with the other market
structures?
26. Evaluate the statement: “A market that produces an identical product cannot be become an oligopoly.”
27. (Consider This) How is strategic behavior illustrated by the competition among three sellers of native arts and
crafts near a national park?
28. What are the shortcomings or limitations of the “four–firm” concentration ratios?
29. The market shares of firms in three different industries are listed in the table below. Use this information to
calculate the Herfindahl index for each industry.
Firms Industry 1 Industry 2 Industry 3
1 65 70 35
2 15 15 35
3 10 10 30
4 5 5 –
5 5 – –
Herfindahl Index _____ _____ _____
(a) Which industry is has the greatest market power? The least?
(b) Based on your findings, is the number of firms in the industry a good predictor of the competitiveness
of an industry? Why or why not?
30. What conclusions can be drawn from the game theory view of oligopoly?
31. Consider the following payoff matrix in which the numbers indicate the profit in millions of dollars for a
duopoly based either on a high-price or a low-price strategy.
Firm A
High-price Low-price
Chapter 11 – Monopolistic Competition and Oligopoly (+ Appendix)
11-5
High-price A = $500
B = $500 A = $650
B = $300
Firm B
Low-price A = $300
B = $650 A = $400
B = $400
(a) What will be the result when each firm chooses a high-price strategy?
(b) What will be the result when Firm A chooses a low-price strategy while Firm B maintains a high-price
strategy?
(c) What will be the result when Firm B chooses a low-price strategy while Firm A maintains a high-price
strategy?
(d) What will be the result when each firm chooses a low-price strategy?
(e) What two conclusions can you draw about collusion?
32. Consider the following payoff matrix in which the numbers indicate the profit in millions of dollars for a
duopoly based either on a high-price or a low-price strategy.
Firm A
High-price Low-price
High-price A = $150
B = $150 A = $200
B = $ 90
Firm B
Low-price A = $ 90
B = $200 A = $100
B = $100
(a) What will be the result when each firm chooses a high-price strategy?
(b) What will be the result when Firm A chooses a low-price strategy while Firm B maintains a high-price
strategy?
(c) What will be the result when Firm B chooses a low-price strategy while Firm A maintains a high-price
strategy?
(d) What will be the result when each firm chooses a low-price strategy?
(e) What two conclusions can you draw about collusion?
33. (Consider This) What is the Prisoner’s Dilemma? How is this dilemma similar to one for two firms
competing for market share as described in the text?
34. Why is the economic analysis of oligopoly so difficult? What two generalizations can be made about the
pricing behavior of oligopolists?
35. Describe the essential features of the kinked-demand model of oligopoly pricing.
Chapter 11 – Monopolistic Competition and Oligopoly (+ Appendix)
11-6
36. The kinked-demand schedule that an oligopolist believes confronts the firm is given in the table below.
Compute the oligopolist’s total revenue at each of the nine prices, and enter these figures in the table. Also
compute marginal revenue for each unit between the nine prices and enter these figures in the table.
Price Quantity demanded Total revenue Marginal revenue per unit
$5.80 50 $_____
5.60 100 _____ $_____
5.40 150 _____ _____
5.20 200 _____ _____
5.00 250 _____ _____
4.80 264 _____ _____
4.60 279 _____ _____
4.40 288 _____ _____
4.20 300 _____ _____
(a) Where is the “kink” in the demand curve? What is the current selling price at that kink and how much
output will be demanded?
(b) What is the range of marginal cost that will keep the price set at the kink?
37. The kinked-demand schedule that an oligopolist believes confronts the firm is given in the table below.
Compute the oligopolist’s total revenue at each of the nine prices, and enter these figures in the table. Also
compute marginal revenue for each unit between the nine prices and enter these figures in the table.
Price Quantity demanded Total revenue Marginal revenue per unit
$17.40 150 $_____
16.80 300 _____ $_____
16.20 450 _____ _____
15.60 600 _____ _____
15.00 750 _____ _____
14.40 792 _____ _____
13.80 837 _____ _____
13.20 864 _____ _____
12.60 900 _____ _____
(a) Where is the “kink” in the demand curve? What is the current selling price at that kink and how much
output will be demanded?
(b) What is the range of marginal cost that will keep the price set at the kink?
38. Explain in nontechnical terms why oligopolistic prices may tend to be inflexible.
39. Explain the collusive pricing model of oligopoly behavior.
Chapter 11 – Monopolistic Competition and Oligopoly (+ Appendix)
11-7
40. An oligopoly producing a homogeneous product is composed of three firms that act like a cartel. Assume
that these three firms have identical cost schedules. Assume also that if any one of these firms sets a price
for the product, the other two firms charge the same price. As long as they all charge the same price they
will share the market equally; and the quantity demanded of each will be the same.
Below are the total-cost schedule of one of these firms and the demand schedule that confronts it when the
other firms charge the same price as this firm. Complete the marginal-cost and marginal-revenue schedules
facing the firm.
Output Total cost Marginal cost
Price Quantity demanded Marginal revenue
0 $ 0
1 60 $_____ $260 1 $_____
2 100 _____ 240 2 _____
3 160 _____ 220 3 _____
4 240 _____ 200 4 _____
5 340 _____ 180 5 _____
6 460 _____ 160 6 _____
7 600 _____ 140 7 _____
8 760 _____ 120 8 _____
(a) What price would be charged, what output would be produced, and what profit would be made by this
firm?
(b) If the firms collude to maximize joint profits, what would be the industry price, output, and profit?
41. An oligopoly producing a homogeneous product is comprised of three firms that act like a cartel. Assume
that these three firms have identical cost schedules. Assume also that if any one of these firms sets a price
for the product, the other two firms charge the same price. As long as they all charge the same price they
will share the market equally; and the quantity demanded of each will be the same.
Below are the total-cost schedule of one of these firms and the demand schedule that confronts it when the
other firms charge the same price as this firm. Complete the marginal-cost and marginal-revenue schedules
facing the firm.
Output Total cost Marginal cost
Price Quantity demanded Marginal revenue
0 $ 0
1 180 $_____ $780 1 $_____
2 300 _____ 720 2 _____
3 180 _____ 660 3 _____
4 720 _____ 600 4 _____
5 1020 _____ 540 5 _____
6 1380 _____ 480 6 _____
7 1800 _____ 420 7 _____
8 2280 _____ 360 8 _____
(a) What price would be charged, what output would be produced, and what profit would be made by this
firm?
(b) If the firms collude to maximize joint profits, what would be the industry price, output, and profit?
42. What obstacles might a group of oligopolists encounter in forming a cartel or an informal understanding?
43. Explain why there is an incentive to cheat in collusive oligopoly. How does such behavior threaten
collusive oligopoly over time?
44. What is the price leadership model of oligopoly pricing and what are its tactics?
45. Why is there emphasis on nonprice competition in oligopoly?
46. Describe the positive and negative views of the economics of advertising.

Chapter 11 – Monopolistic Competition and Oligopoly (+ Appendix)
47. “Purely competitive firms sell their product at the same price. This is also true in some oligopolistic
markets with standardized products. Therefore, these oligopolies are actually highly competitive.”
Evaluate critically.
48. What are three qualifications to the view that allocative and productive efficiency are not realized in
oligopoly?
49. Compare pure competition, pure monopoly, monopolistic competition, and oligopoly on each of the
following points:
(a) Ability to manipulate price.
(b) Flexibility of prices.
(c) Expenditures on advertising and sales promotion.
(d) Efficiency in allocation of resources.
50. (Last Word) Describe the major demand and supply factors that have turned the beer industry into an
oligopoly over the years.
Chapter 11 – Monopolistic Competition and Oligopoly (+ Appendix)
B. Answers to Short-Answer, Essays, and Problems
1. What are the major features of monopolistic competition compared to pure competition and pure
monopoly?
2. “Pure competition or pure monopoly industries will tend to be one-price industries. Monopolistic
competition, however, is a multiprice industry.” Explain.
3. How does economic rivalry take place in monopolistic competition? Describe the different aspects of
product differentiation and price competition.
4. What are “four–firm” concentration ratios? How do economists use them to define monopolistically
competitive industries and oligopolistic industries?
5. What are types of firms that exemplify monopolistic competition?
Chapter 11 – Monopolistic Competition and Oligopoly (+ Appendix)
11–10
6. What is the Herfindahl index and how is it calculated?
7. How are monopolistically competitive industries identified with concentration ratios?
8. Why is the monopolistic competitor’s demand curve more elastic than a pure monopolist’s, but less elastic
than a pure competitor’s? What factors determine the price elasticity of demand for a monopolistic
competitor?
9. Assume that the short-run cost and demand data given in the table below confront a monopolistic
competitor selling a given product and engaged in a given amount of product promotion. Compute the
marginal cost and marginal revenue of each unit of output and enter these figures in the table.
Output Total cost Marginal cost Quantity demanded
Price Marginal revenue
0 $ 25 0 $60
1 40 $_____ 1 55 $_____
2 45 _____ 2 50 _____
3 55 _____ 3 45 _____
4 70 _____ 4 40 _____
5 90 _____ 5 35 _____
6 115 _____ 6 30 _____
7 145 _____ 7 25 _____
8 180 _____ 8 20 _____
9 220 _____ 9 15 _____
10 265 _____ 10 10 _____
(a) At what output level and at what price will the firm produce in the short run? What will be the total
profit?
(b) What will happen to demand, price, and profit in the long run?
Chapter 11 – Monopolistic Competition and Oligopoly (+ Appendix)
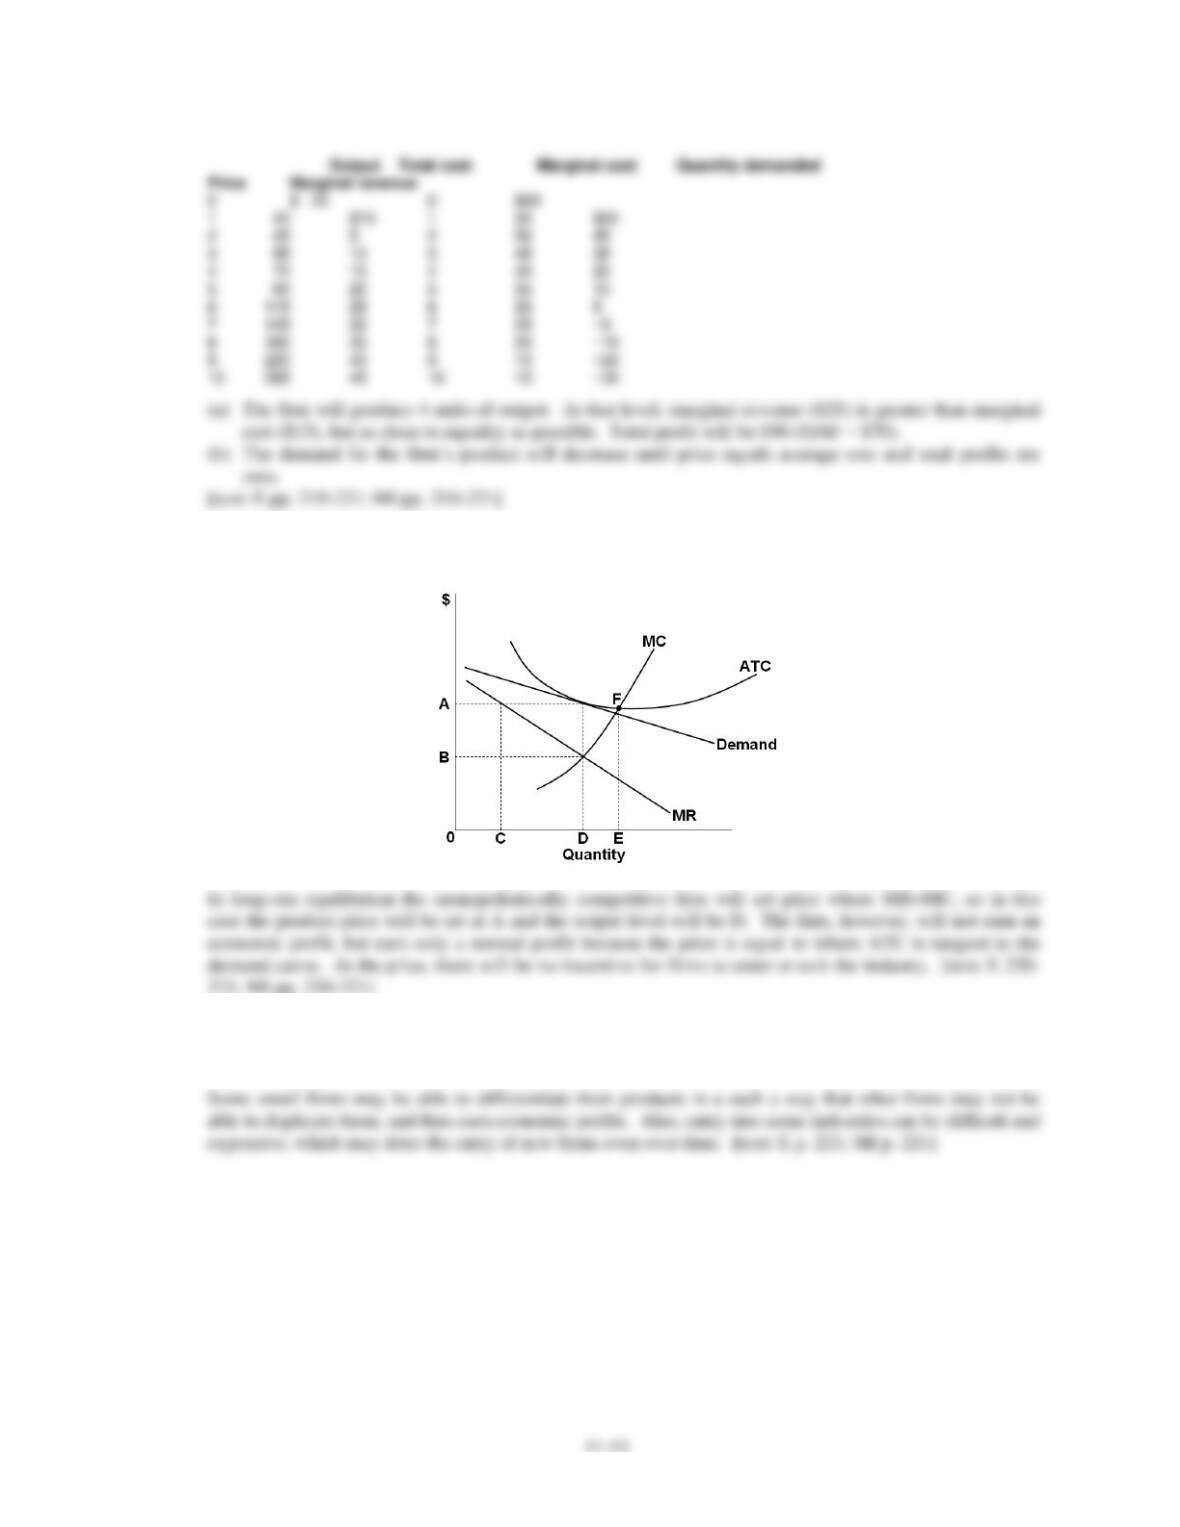
10. Explain why the following graph is likely to represent the long-run equilibrium for a representative firm in
monopolistic competition. What will be the product price, output, and amount of economic profit?
11. In theory, the representative firm in monopolistic competition earns only a normal profit. Why might that
outcome not always occur in the real world of small firms?
Chapter 11 – Monopolistic Competition and Oligopoly (+ Appendix)
11–12
12. Assume that the short-run cost and demand data given in the table below confront a monopolistic
competitor selling a given product and engaged in a given amount of product promotion. Compute the
marginal cost and marginal revenue of each unit of output and enter these figures in the table.
Output Total cost Marginal cost Quantity demanded
Price Marginal revenue
0 $ 75 0 $180
1 120 $_____ 1 165 $_____
2 135 _____ 2 150 _____
3 165 _____ 3 135 _____
4 210 _____ 4 120 _____
5 270 _____ 5 105 _____
6 345 _____ 6 90 _____
7 435 _____ 7 75 _____
8 540 _____ 8 60 _____
9 660 _____ 9 45 _____
10 795 _____ 10 30 _____
(a) At what output level and at what price will the firm produce in the short run? What will be the total
profit?
(b) What will happen to demand, price, and profit in the long run?
Chapter 11 – Monopolistic Competition and Oligopoly (+ Appendix)
11–13
13. Assume that the short-run cost and demand data given in the table below confronts a monopolistic
competitor selling a given product and engaged in a given amount of product promotion. Compare the
marginal cost and marginal revenue of each unit of output and enter these figures in the table.
Output Total cost Marginal cost Quantity demanded
Price Marginal revenue
Profit
0 $ 50 0 $60 $_____
1 80 $_____ 1 55 $_____ _____
2 120 _____ 2 50 _____ _____
3 150 _____ 3 45 _____ _____
4 170 _____ 4 40 _____ _____
5 185 _____ 5 35 _____ _____
6 205 _____ 6 30 _____ _____
7 235 _____ 7 25 _____ _____
8 275 _____ 8 20 _____ _____
9 325 _____ 9 15 _____ _____
10 385 _____ 10 10 _____ _____
(a) At what output level and at what price will the firm produce in the short run? What will be the total
profit?
(b) What will happen to demand, price, and profit in the long run? How will the market adjust to achieve
this?
14. In the first graph below, illustrate the cost curves and demand conditions for a monopolistically competitive
firm making short-run profits. In the second graph, illustrate what those conditions are most likely to be in
the long run. Explain the major differences in the two graphs.
Chapter 11 – Monopolistic Competition and Oligopoly (+ Appendix)
15. A monopolistically competitive firm is producing 50 units of output in the short run where marginal cost is
$3.00, average total costs are $5.00, price is $4.50, average variable cost is $4.00, and marginal revenue is
$3.00. How much profit is the firm making? What output recommendation would you make for the firm?
16. In the short run, a monopolistically competitive firm calculates that marginal cost is $6.00, average total
costs are $4.00, and marginal revenue is $3.00. The firm is charging a price of $6.00 and producing 200
units of output. How much profit is the firm making? What output recommendation would you make as
the company economist?
17. If monopolistically competitive firms have some control over their prices, why don’t they set price above
average total cost so they will realize an economic profit in the long run?
18. What are two real-world complications with the long-run conclusion about the representative firm in the
model of monopolistic competition?
19. “In monopolistically competitive markets neither allocative nor productive efficiency is realized.” Explain.
Price will exceed marginal cost because each firm does not face a perfectly elastic demand curve. This
indicates that society values additional units of these goods more than alternative products, so allocative
efficiency is not realized.