a.
reduce pollution by requiring factories to reduce their pollution by a certain number of tons per year.
b.
reduce pollution by levying a tax on factories of a certain number of dollars for every ton of pollution that the
factory emits.
c.
encourage business firms to subsidize continuing education for their employees.
d.
promote technology-enhancing industries.
121. One drawback to industrial policy is that
a.
technology spillovers are too expensive to control.
b.
measuring the size of spillovers from different markets is difficult.
c.
spillovers often occur in industries that produce undesirable products for society.
d.
positive side effects are often outweighed by negative side effects.
122. The goal of industrial policy should be that
a.
industries yielding the largest positive externalities should receive the biggest subsidies.
b.
any industry that produces negative externalities should be heavily taxed.
c.
any production process that produces negative externalities should be shut down.
d.
all industries that produce positive externalities should be equally subsidized.
123. Which of the following is the most effective way to internalize a technology spillover?
a.
taxes
b.
patents
c.
government regulations
d.
free markets
124. A patent is used to
a.
disseminate information.
b.
offset the negative effects of taxes.
c.
protect inventors for as long as they live.
d.
assign property rights.
125. Patents do not
a.
provide firms an incentive to research.
b.
assign property rights to inventors.
c.
protect the rights of inventors for their lifetimes.
d.
internalize externalities.
Figure 10-9
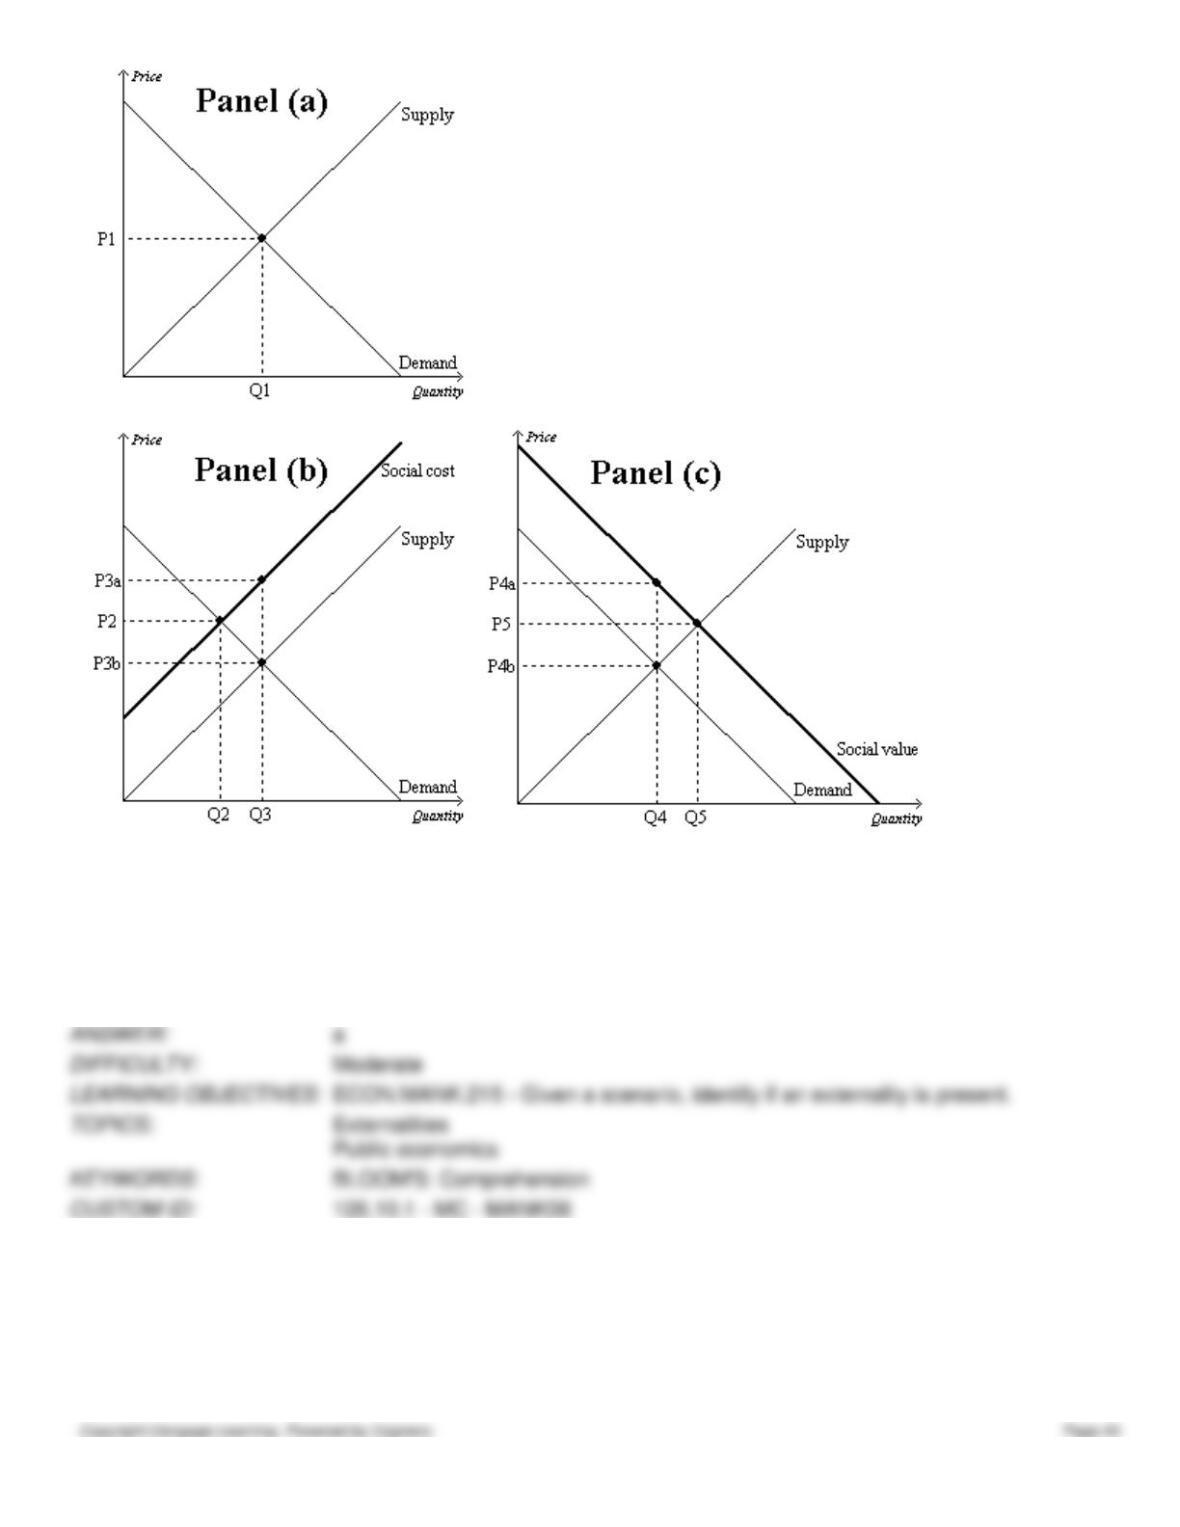
126. Refer to Figure 10–9. Which graph represents a market with no externality?
a.
Panel (a)
b.
Panel (b)
c.
Panel (c)
d.
None of the above is correct.
127. Refer to Figure 10–9. Which graph represents a market with a positive externality?
a.
Panel (a)
b.
Panel (b)
c.
Panel (c)
d.
Both (b) and (c) are correct.
128. Refer to Figure 10–9. Which graph represents a market with a negative externality?
a.
Panel (a)
b.
Panel (b)
c.
Panel (c)
d.
Both (b) and (c) are correct.
129. Refer to Figure 10–9, Panel (b). The market equilibrium quantity is
a.
Q2, which is the socially optimal quantity.
b.
Q3, which is the socially optimal quantity.
c.
Q2, and the socially optimal quantity is Q3.
d.
Q3, and the socially optimal quantity is Q2.
130. Refer to Figure 10–9, Panel (b). The market equilibrium price is
a.
P2.
b.
P3a.
c.
P3b.
d.
P3a – P3b.

131. Refer to Figure 10–9, Panel (c). The market equilibrium quantity is
a.
Q4, which is the socially optimal quantity.
b.
Q5, which is the socially optimal quantity.
c.
Q4, and the socially optimal quantity is Q5.
d.
Q5, and the socially optimal quantity is Q4.
132. Refer to Figure 10–9, Panel (c). The market equilibrium price is
a.
P4a.
b.
P4b.
c.
P5.
d.
P4a – P4b.
133. Refer to Figure 10–9. The overuse of antibiotics leads to the development of antibiotic-resistant diseases. Therefore,
the market for antibiotics is shown in
a.
Panel (a).
b.
Panel (b).
c.
Panel (c).
d.
Both (b) and (c) are correct.
134. Refer to Figure 10–9, Panel (b) and Panel (c). The overuse of antibiotics leads to the development of antibiotic–
resistant diseases. Therefore, the socially optimal quantity of antibiotics is represented by point
a.
Q2.
b.
Q3.
c.
Q4.
d.
Q5.
135. Refer to Figure 10–9, Panel (b) and Panel (c). The overuse of antibiotics leads to the development of antibiotic–
resistant diseases. Therefore, the external cost of antibiotic overuse is represented by
a.
Q3 – Q2.
b.
Q5 – Q4.
c.
P3a – P3b.
d.
P4a – P4b.
136. Refer to Figure 10–9, Panel (b) and Panel (c). The overuse of antibiotics leads to the development of antibiotic–
resistant diseases. Therefore, a government policy that internalized the externality would move the quantity of antibiotics
used from point
a.
Q2 to point Q3.
b.
Q3 to point Q2.
c.
Q4 to point Q5.
d.
Q5 to point Q4.
137. Refer to Figure 10–9. The installation of a scrubber in a smokestack reduces the emission of harmful chemicals from
the smokestack. Therefore, the market for smokestack scrubbers is shown in
a.
Panel (a).
b.
Panel (b).
c.
Panel (c).
d.
Both (b) and (c) are correct.
138. Refer to Figure 10–9, Panel (b) and Panel (c). The installation of a scrubber in a smokestack reduces the emission
of harmful chemicals from the smokestack. Therefore, the socially optimal quantity of smokestack scrubbers is
represented by point
a.
Q2.
b.
Q3.
c.
Q4.
d.
Q5.
139. Refer to Figure 10–9, Panel (b) and Panel (c). The installation of a scrubber in a smokestack reduces the emission
of harmful chemicals from the smokestack. Therefore, the external benefit of smokestack scrubber installation is
represented by
a.
Q3 – Q2.
b.
Q5 – Q4.
c.
P3a – P3b.
d.
P4a – P4b.
140. Refer to Figure 10–9, Panel (b) and Panel (c). The installation of a scrubber in a smokestack reduces the emission
of harmful chemicals from the smokestack. Therefore, a government policy that internalized the externality would move
the quantity of smokestack scrubbers installed from point
a.
Q2 to point Q3.
b.
Q3 to point Q2.
c.
Q4 to point Q5.
d.
Q5 to point Q4.
141. Refer to Figure 10–9, Panel (b) and Panel (c). Which of the following is correct?
a.
A tax would move the market in Panel (b) and the market in Panel (c) closer to the socially optimal outcome.
b.
A subsidy would move the market in Panel (b) and the market in Panel (c) closer to the socially optimal
outcome.
c.
A tax would move the market in Panel (b) closer to the socially optimal outcome, but a subsidy would move
the market in Panel (c) closer to the socially optimal outcome.
d.
A subsidy would move the market in Panel (b) closer to the socially optimal outcome, but a tax would move
the market in Panel (c) closer to the socially optimal outcome.
Figure 10–10
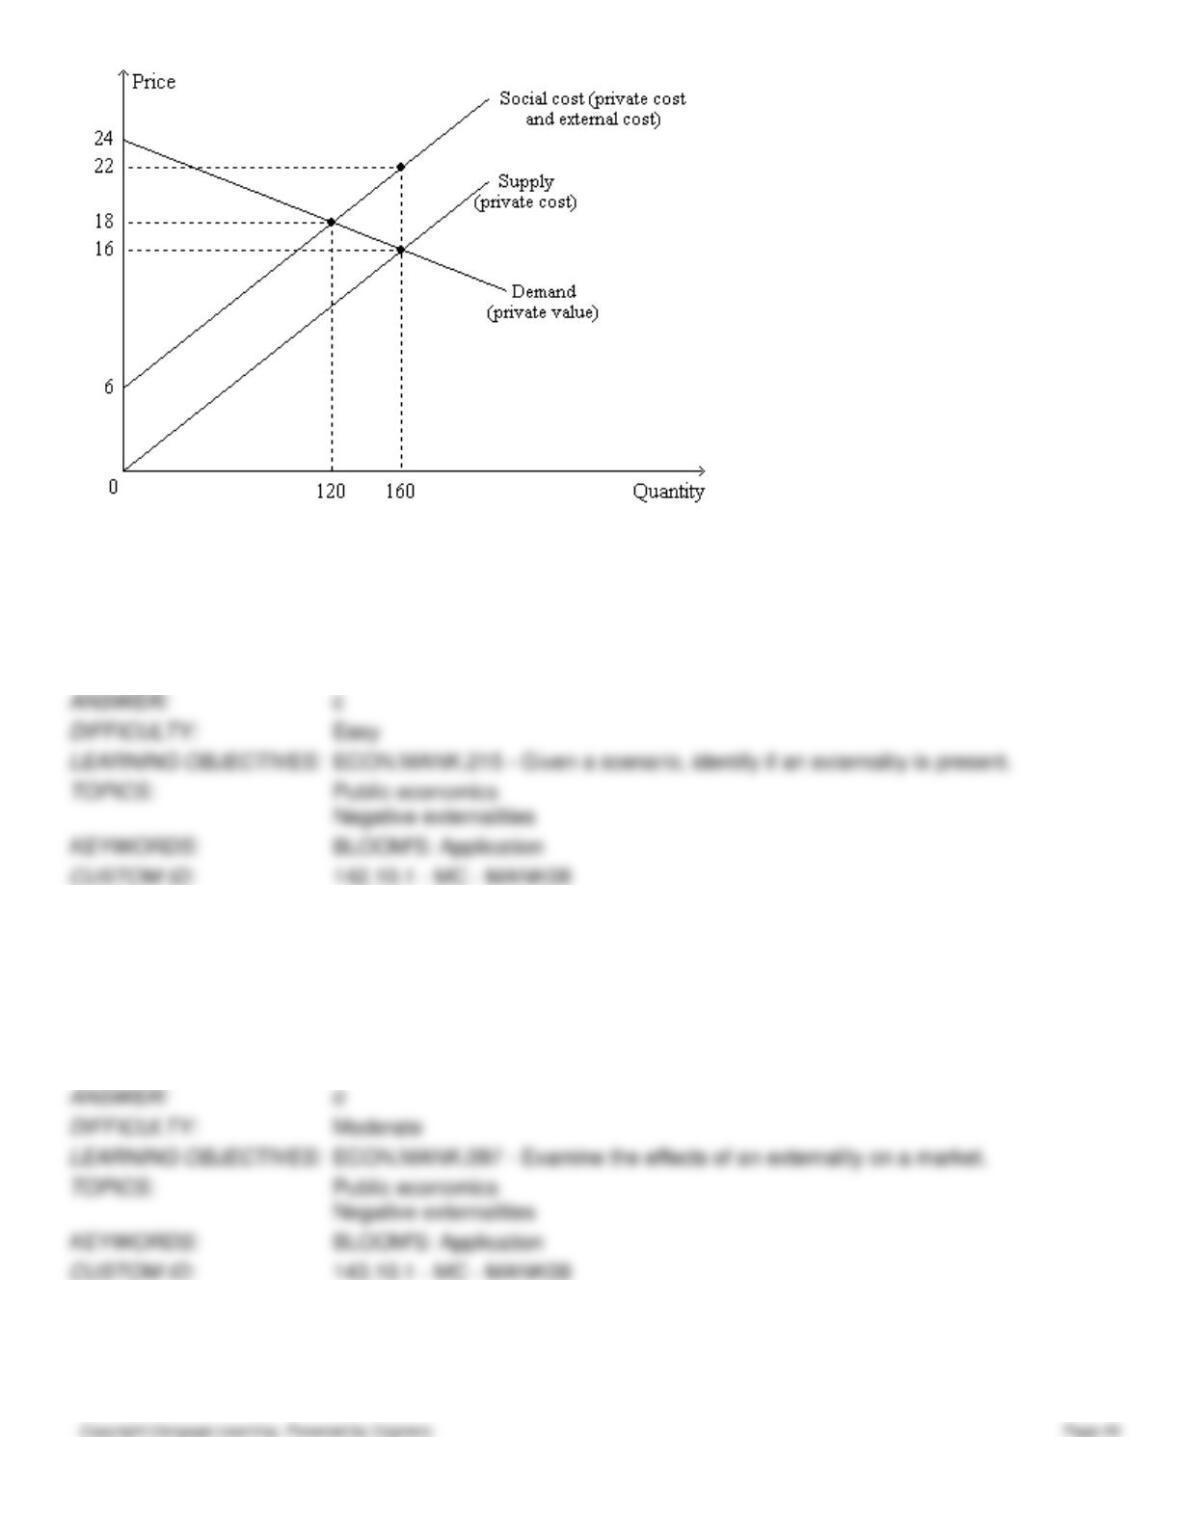
142. Refer to Figure 10-10. The graph represents a market in which
a.
there is no externality.
b.
there is a positive externality.
c.
there is a negative externality.
d.
The answer cannot be determined from inspection of the graph.
143. Refer to Figure 10-10. Which of the following statements is correct?
a.
The private cost of producing the 160th unit of output is $16.
b.
The social cost of producing the 160th unit of output is $22.
c.
The external cost of producing the 160th unit of output is $6.
d.
All of the above are correct.
144. Refer to Figure 10-10. Which of the following statements is correct?
a.
The private cost of producing the 120th unit of output is $12.
b.
The social cost of producing the 120th unit of output is $22.
c.
The external cost of producing the 120th unit of output is $2.
d.
All of the above are correct.
145. Refer to Figure 10-10. The socially optimal quantity of output is
a.
120 units, since the value to the buyer of the 120th unit is equal to the cost incurred by the seller of the 120th
unit.
b.
120 units, since the value to the buyer of the 120th unit is equal to the cost incurred by society of the 120th
unit.
c.
160 units, since the value to the buyer of the 160th unit is equal to the cost incurred by the seller of the 160th
unit.
d.
160 units, since the value to the buyer of the 160th unit is equal to the cost incurred by society of the 160th
unit.
146. Refer to Figure 10-10. A decrease in output from 160 units to 120 units would
a.
move the market from a socially efficient outcome to a socially inefficient outcome.
b.
reduce the external cost per unit of output.
c.
increase total economic well-being.
d.
not be an action of which a benevolent social planner would approve.
147. Refer to Figure 10-10. An increase in output from 120 units to 160 units would
a.
move the market from a socially efficient outcome to a socially inefficient outcome.
b.
increase the external cost per unit of output.
c.
increase total economic well-being.
d.
be an action of which a benevolent social planner would approve.
148. Refer to Figure 10-10. “The social cost of the last unit produced exceeds the value to buyers of the last unit
produced by $3.” This statement is correct at which quantity of output?
a.
120 units
b.
140 units
c.
160 units
d.
The statement is true at all quantities of output.
149. Refer to Figure 10-10. Taking into account private and external costs, the maximum total surplus that can be
achieved in this market is
a.
$760.
b.
$1,080.
c.
$1,440.
d.
$1,920.
Table 10-3
Quantity
Private Value
Private Cost
External Benefit
1
$22
$11
$10
2
$20
$14
$10
3
$18
$17
$10
4
$16
$20
$10
5
$14
$23
$10
6
$12
$26
$10
150. Refer to Table 10–3. The table represents a market in which
a.
there is no externality.
b.
there is a positive externality.
c.
there is a negative externality.
d.
The answer cannot be determined from inspection of the table.
151. Refer to Table 10–3. The social value of the 4th unit of output that is produced is
a.
$10.
b.
$16.
c.
$26.
d.
$30.
152. Refer to Table 10–3. The market equilibrium quantity of output is
a.
3 units.
b.
4 units.
c.
5 units.
d.
6 units.
153. Refer to Table 10–3. The socially optimal quantity of output is
a.
3 units.
b.
4 units.
c.
5 units.
d.
6 units.

154. Refer to Table 10–3. What amount of subsidy per unit of output would move the market from the equilibrium level
of output to the socially optimal level of output?
a.
$2
b.
$3
c.
$5
d.
$10
155. Refer to Table 10–3. Taking into account private and external costs, the maximum total surplus that can be achieved
in this market is
a.
$18.
b.
$38.
c.
$46.
d.
$55.
Figure 10–11
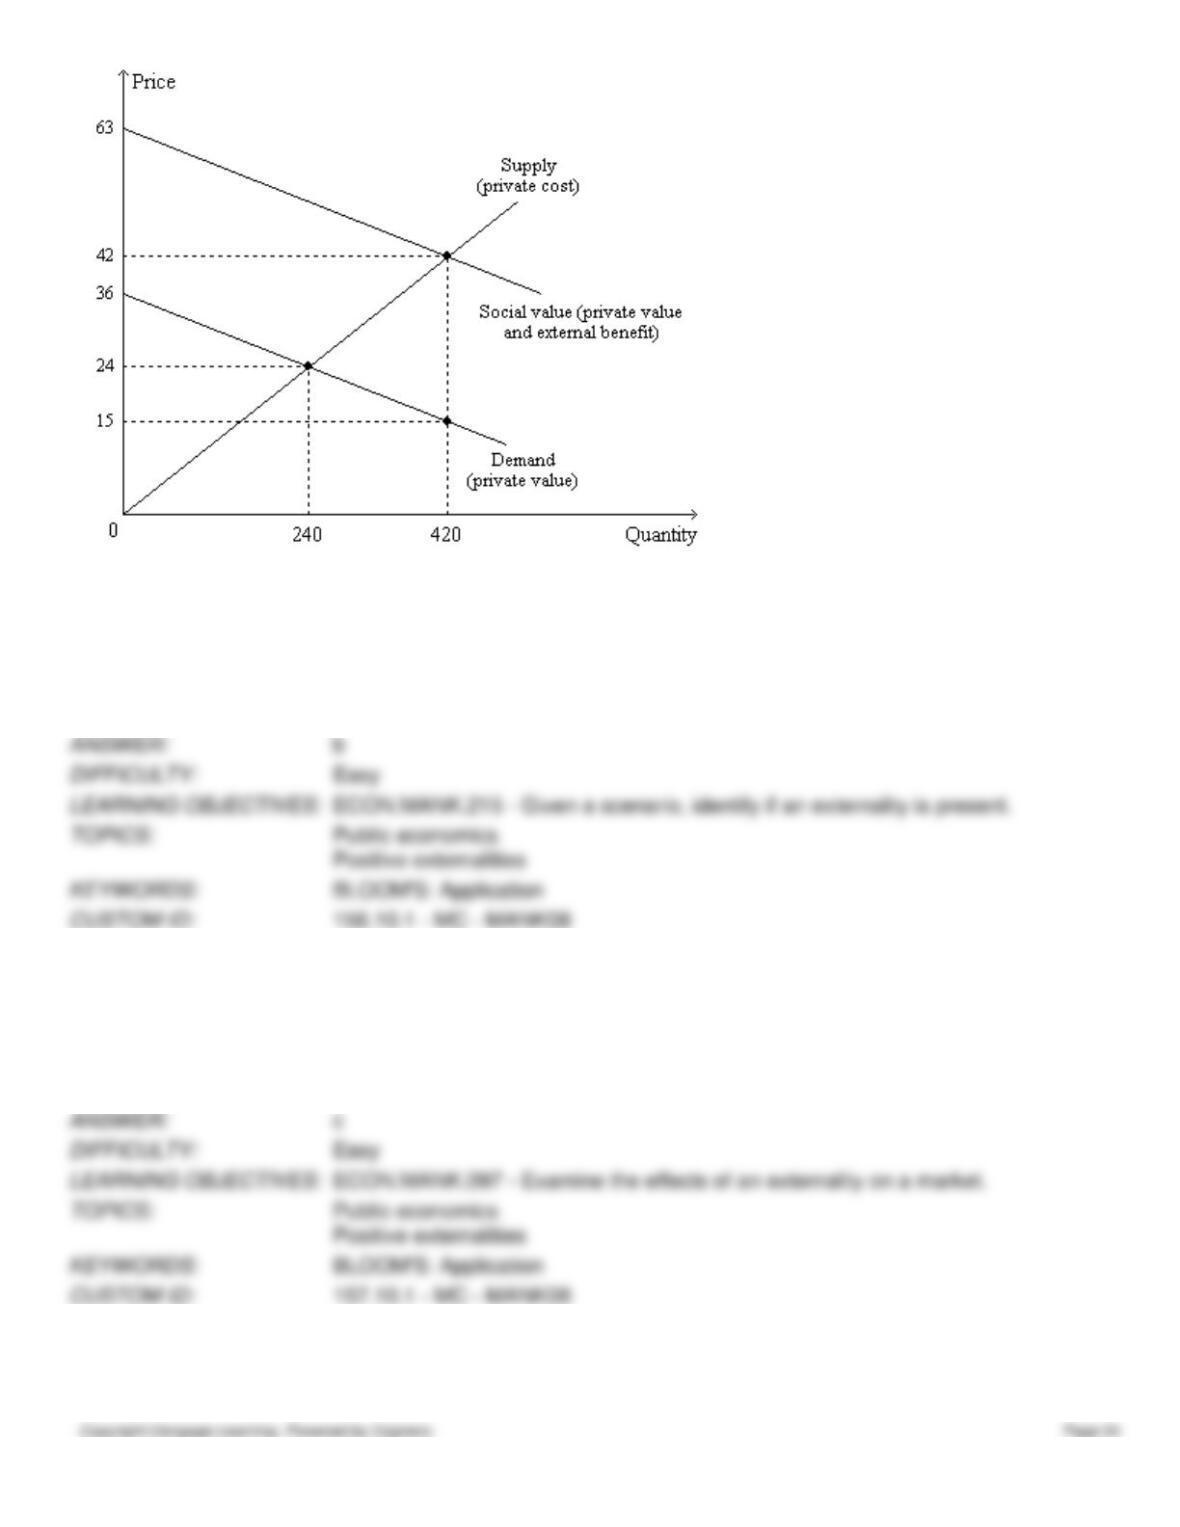
156. Refer to Figure 10-11. The graph represents a market in which
a.
there is no externality.
b.
there is a positive externality.
c.
there is a negative externality.
d.
The answer cannot be determined from inspection of the graph.
157. Refer to Figure 10-11. Which of the following magnitudes is constant over all units of output?
a.
the private value of the last unit of output that was produced and sold
b.
the social value of the last unit of output that was produced and sold
c.
the external benefit of the last unit of output that was produced and sold
d.
the private cost of the last unit of output that was produced and sold
158. Refer to Figure 10-11. Which of the following statements is correct?
a.
The private value of the 420th unit of output is $15.
b.
The social value of the 420th unit of output is $42.
c.
The external benefit of the 420th unit of output is $27.
d.
All of the above are correct.
159. Refer to Figure 10-11. Which of the following statements is correct?
a.
The private value of the 240th unit of output is $24.
b.
The social value of the 240th unit of output is $42.
c.
The external benefit of the 240th unit of output is $18.
d.
All of the above are correct.
160. Refer to Figure 10-11. The socially optimal quantity of output is
a.
240 units, since the value to the buyer of the 240th unit is equal to the cost incurred by the seller of the 240th
unit.
b.
240 units, since the value to society of the 240th unit is equal to the cost incurred by the seller of the 240th unit.
c.
420 units, since the value to the buyer of the 420th unit is equal to the cost incurred by the seller of the 420th
unit.
d.
420 units, since the value to society of the 420th unit is equal to the cost incurred by the seller of the 420th unit.
161. Refer to Figure 10-11. A benevolent social planner would prefer
a.
a $24 price to any other price.
b.
420 units to any other quantity of output.
c.
a subsidy of $24 per unit to a subsidy of $27 per unit.
d.
All of the above are correct.
162. Refer to Figure 10-11. “The social value of the last unit produced exceeds the private cost of the last unit produced
by $13.50.” This statement is correct at which quantity of output?
a.
210 units
b.
270 units
c.
330 units
d.
390 units
163. Refer to Figure 10-11. On the
a.
390th unit of output, private value exceeds private cost.
b.
390th unit of output, private value exceeds external value.
c.
450th unit of output, private value exceeds social value.
d.
450th unit of output, private cost exceeds social value.
164. Refer to Figure 10-11. Taking into account private value and external benefits, the maximum total surplus that can
be achieved in this market is
a.
$5,880.
b.
$9,480.
c.
$13,230.
d.
$15,360.