3) Give examples of factors that decrease short-run aggregate supply. Which way does the SAS
curve shift?
4) What is the difference between the long-run aggregate supply and the short-run aggregate
supply curves?
5) How do changes in the money wage rate affect the LAS and SAS curves? Explain your answer.
6) What are the factors that can shift the short-run aggregate supply curve but not the long-run
aggregate supply curve? Explain your answer.

7) Explain the reasons why the AD curve slopes downward.
8) What is the effect on the aggregate demand curve from an increase in the price level? In
particular, does the aggregate demand curve shift leftward or rightward?
9) What are the substitution effects that affect aggregate demand?
10) How does the aggregate demand curve reflect an increase in aggregate demand?

11) Give examples of factors that decrease aggregate demand. Which way does the aggregate
demand curve shift?
12) What are fiscal and monetary policies? Do they have an immediate effect on the AD curve or
the SAS curve?
13) What are the components of fiscal policy? Explain how fiscal policy affects aggregate
demand.
14) What happens to the aggregate demand curve in the United States if the exchange rate
increases so that U.S.-made products become more expensive?
15) What two variables are determined in an aggregate supply-aggregate demand figure? Is the
slope of the short-run aggregate supply curve positive or negative? Is the slope of the aggregate
demand curve positive or negative?
16) Explain the relationship of the long-run aggregate supply curve, the short-run aggregate
supply curve and the aggregate demand curve in determining a long-run and short-run
macroeconomic equilibrium.
17) Assume the equilibrium price level is 140 and the equilibrium real GDP is $15 trillion. What
happens if the current price level equals 125?
18) Suppose that during 2009, the actual real GDP of Chile was 3.5 billion pesos at the same
time the potential GDP was 3.4 billion pesos. What sort of equilibrium existed in Chile?
19) What is the difference between a recessionary gap and an inflationary gap?
20) What happens if the economy is at its long-run equilibrium and aggregate demand increases?
21) If the world economy expands so that foreign demand for U.S.-made goods increases, in the
short run what will happen to aggregate demand, the price level, and real GDP in the U.S.?
22) Compare the policy prescriptions of Keynesian, Classical, and Monetarist economists.
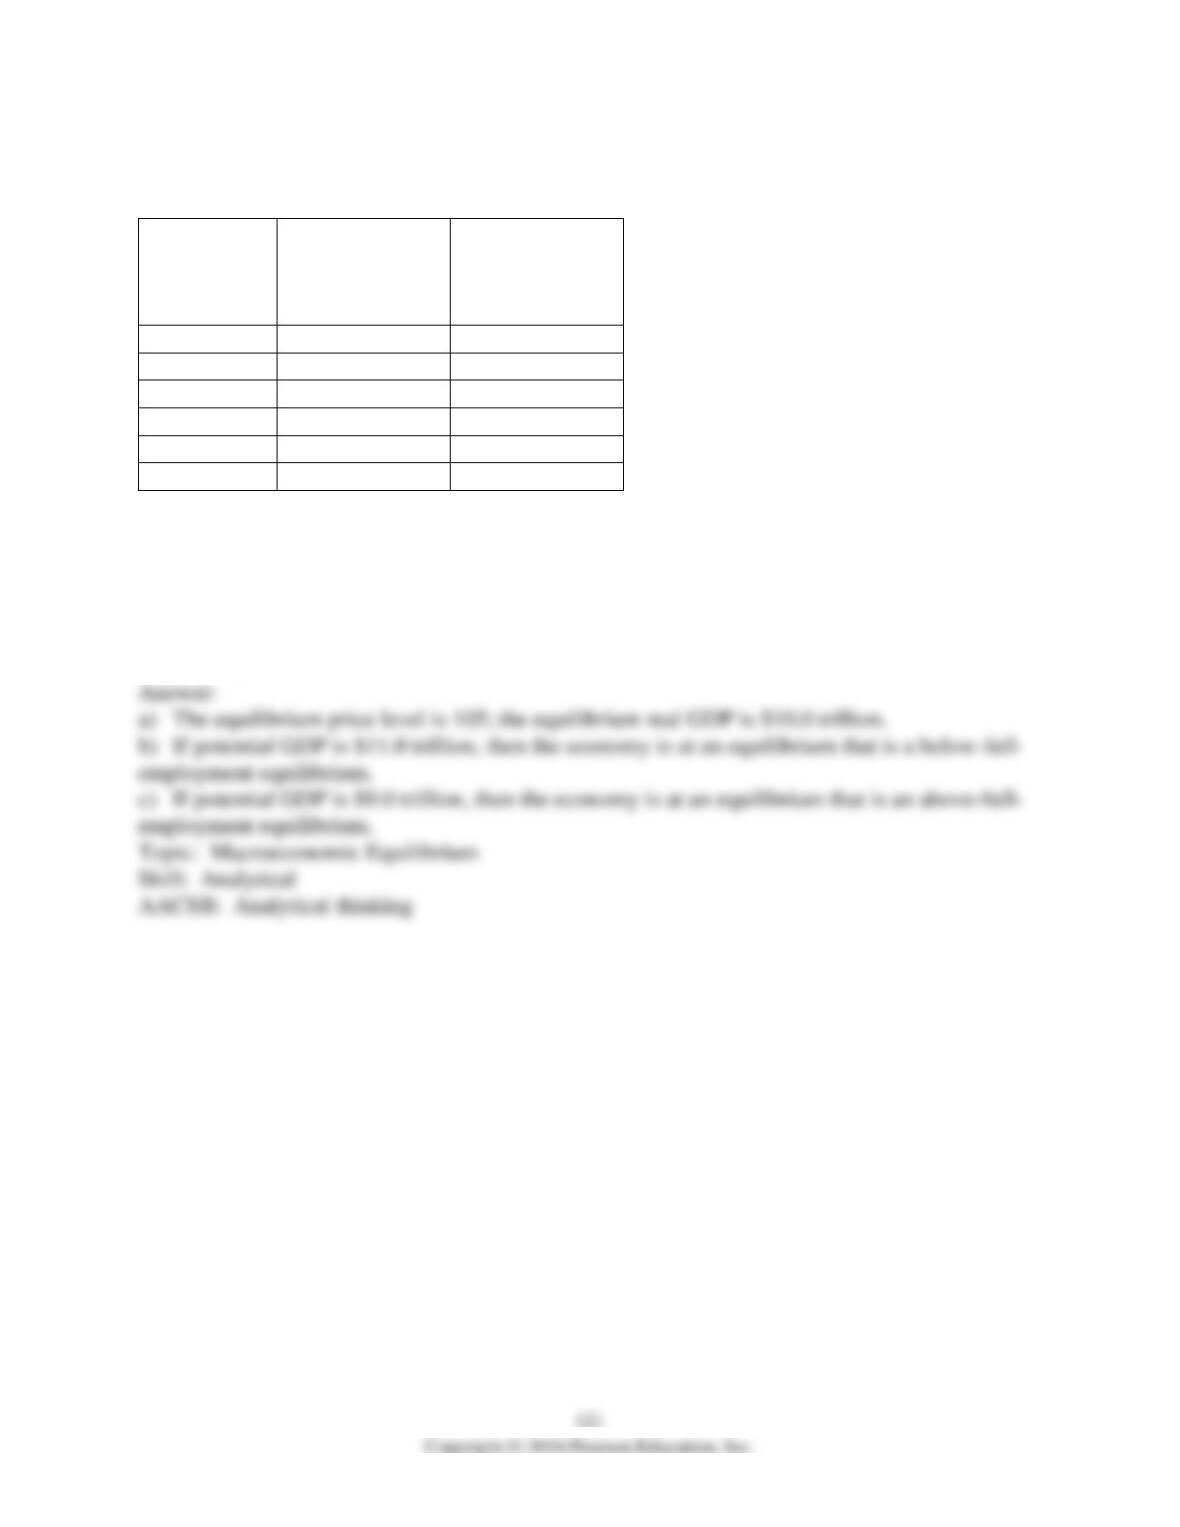
7 Numeric and Graphing Questions
Price level
(GDP deflator,
2009 = 100)
Quantity of real
GDP demanded
(trillions of 2009
dollars)
Quantity of real
GDP supplied
(trillions of 2009
dollars)
115
8.8
12.0
110
9.4
11.0
105
10.0
10.0
100
10.6
9.0
95
11.2
8.0
90
11.8
7.0
1) Based on the table above,
a) What is the equilibrium price level and real GDP?
b) If potential GDP is $11.0 trillion, what does that imply about the economy’s level of
employment?
c) If potential GDP is $9.0 trillion, what does that imply about the economy’s level of
employment?
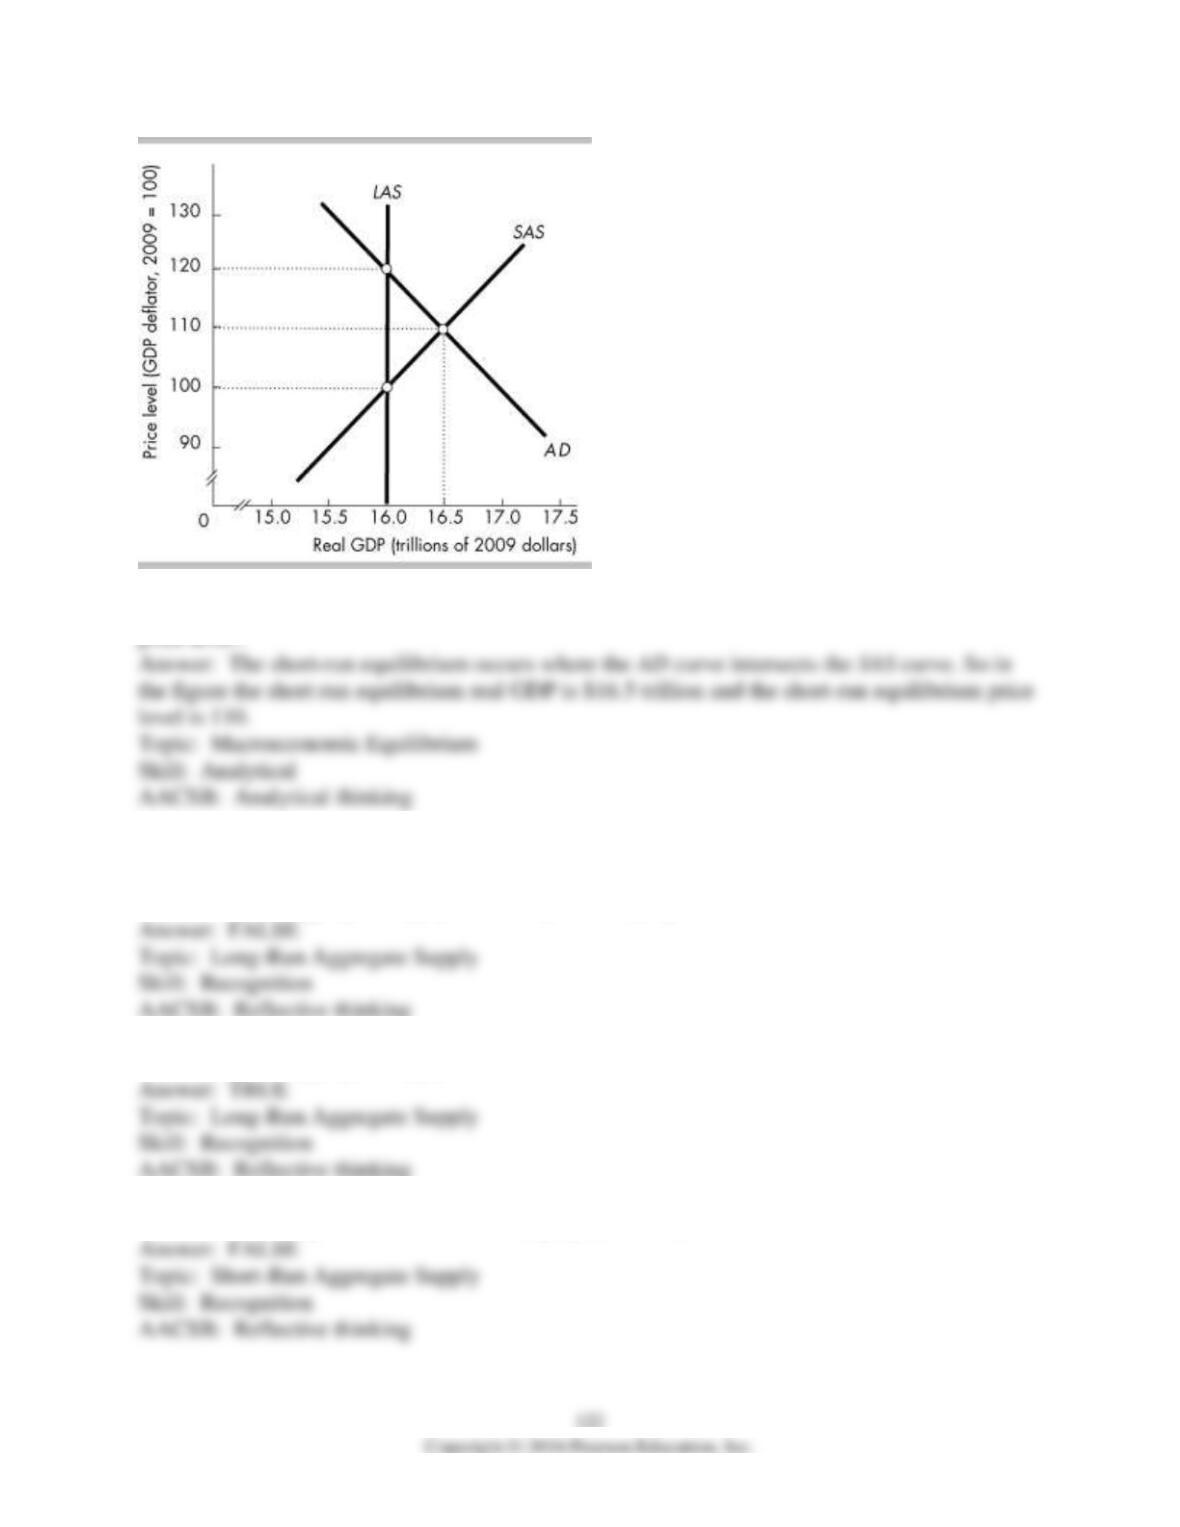
2) In the above figure, what is the short-run equilibrium real GDP and the short-run equilibrium
8 True or False
1) The long-run aggregate supply curve is upward sloping.
2) The long-run aggregate supply curve is vertical.
3) The level of output when there is full employment is called actual GDP.

4) In the long-run, the quantity of real GDP supplied increases when the price level increases.
5) The short-run aggregate supply curve shows a positive relationship between the price level
and real GDP.
6) The SAS curve shifts if there is a change in the price level.
7) If there is an increase in technology, the long-run aggregate supply curve shifts rightward, but
the short-run aggregate supply curve does not shift.
8) If the money prices of resources changes, the LAS curve shifts.
9) If the money prices of resources changes, the SAS curve shifts.
10) An increase in the quantity of capital shifts both the long-run and short-run aggregate supply
curves.

11) If the money wage rate increases, the short-run aggregate supply curve shifts rightward.
12) The aggregate demand curve shows total expenditures at different levels of national income.
13) A change in the price level does not shift the aggregate demand curve.
14) The wealth effect points out that consumption decreases when people’s real wealth decreases.
15) Wealth and substitution effects explain why the aggregate demand curve has a positive slope.
16) An increase in the quantity of money shifts the aggregate demand curve rightward.
17) In the short-run, real GDP can be greater than or less than potential GDP because in the short
run the money wage rate is fixed.

18) The level of output at which the short-run aggregate supply curve and the aggregate demand
curve intersect is the full-employment level of GDP.
19) In the short run, a supply shock that shifts the short-run aggregate supply curve leftward
raises the price level and increases real GDP.
20) In the short run, a supply shock that shifts the short-run aggregate supply curve leftward
raises the price level and decreases real GDP.
21) Long-run macroeconomic equilibrium is achieved when the money wage rate has adjusted so
that employment is such that real GDP equals potential GDP.
22) During an above-full-employment equilibrium, actual GDP is greater than potential GDP.
23) Fluctuations in aggregate demand and aggregate supply explain why real GDP fluctuates.
24) The business cycle occurs because aggregate demand and aggregate supply change at uneven
rates.

126
25) The Keynesian theory of business cycle views volatile expectations of future sales and
profits as the main source of economic fluctuations.
26) A monetarist economist believes that if the economy was left alone, it would rarely operate
at full employment.
9 Extended Problems
Price level
Real GDP
demanded
(billions of 2009
dollars)
Real GDP
supplied (billions
of 2009 dollars)
70
825
375
80
750
450
90
675
525
100
600
600
110
525
675
120
450
750
130
375
825
140
300
900
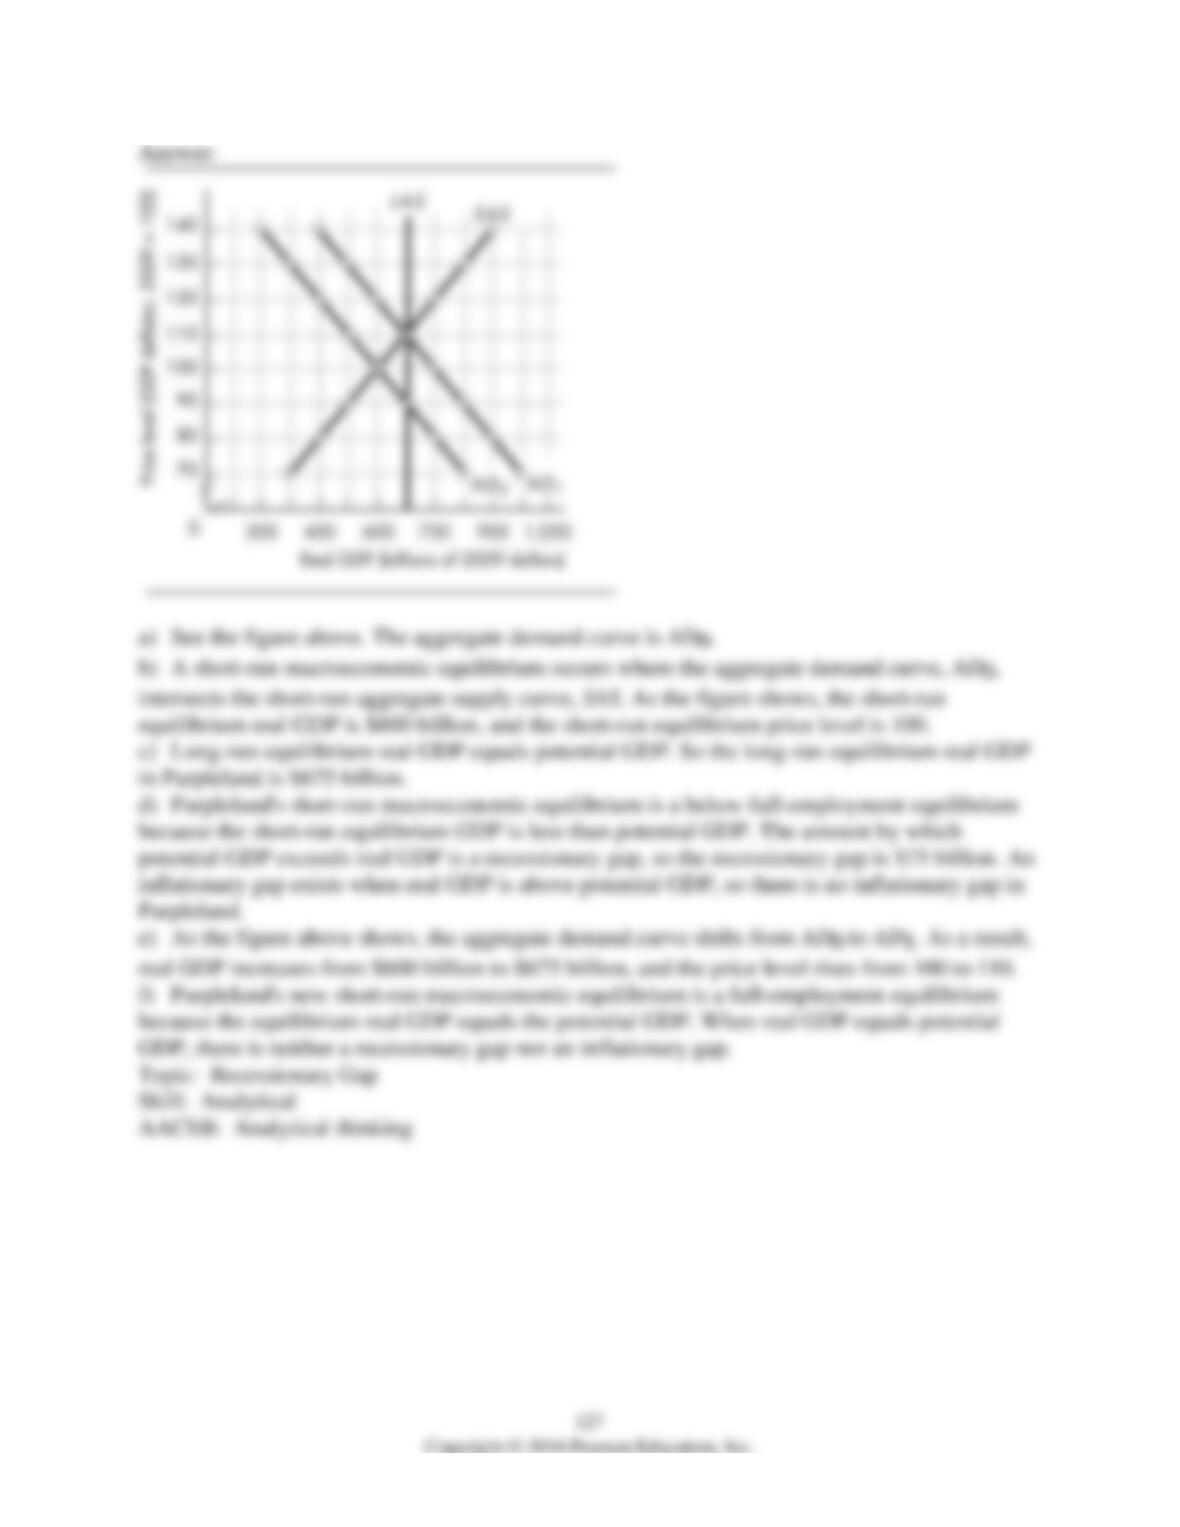
1) The table above shows Purpleland’s economy aggregate demand and supply schedules.
Purpleland’s potential GDP is $675 billion.
a) Plot the aggregate demand curve, the short-run aggregate supply curve, and the long-run
aggregate supply curve.
b) What are the short-run equilibrium real GDP and price level in Purpleland?
c) What is the long-run equilibrium real GDP?
d) Is Purpleland’s short-run macroeconomic equilibrium a full-employment equilibrium, below
full-employment equilibrium, or above full-employment equilibrium? What is the recessionary
gap (if any)? What is the inflationary gap (if any)?
e) Suppose aggregate demand increases by $150 billion. Plot the new aggregate demand curve.
How do real GDP and the price level change in the short run?
f) Is Purpleland’s new short-run macroeconomic equilibrium a full-employment equilibrium,
below full-employment equilibrium, or above full-employment equilibrium? What is the
recessionary gap (if any)? What is the inflationary gap (if any)?
Price level
Real GDP demanded
(billions of 2009
dollars)
Real GDP supplied
(billions of 2009
dollars)
90
450
150
100
400
250
110
350
350
120
300
450
130
250
550
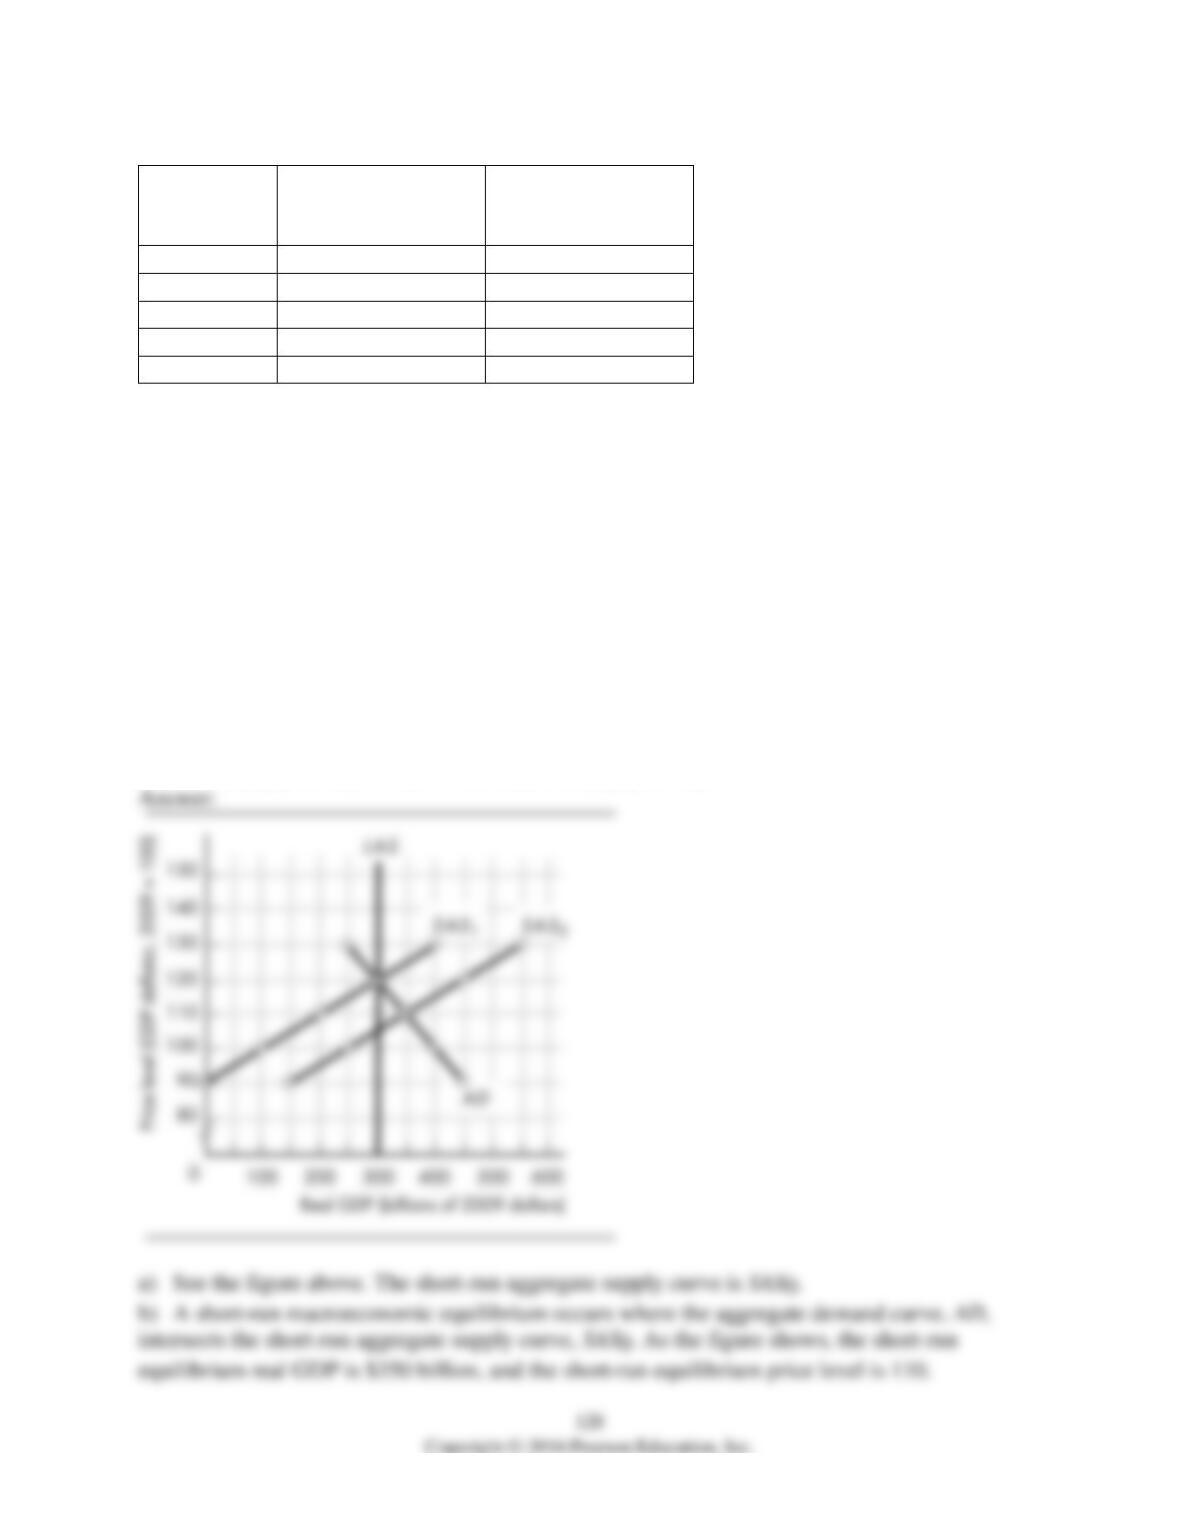
2) The table above shows Yellowland’s economy aggregate demand and supply schedules.
Yellowland’s potential GDP is $300 billion.
a) Plot the aggregate demand curve, the short-run aggregate supply curve, and the long-run
aggregate supply curve.
b) What are the short-run equilibrium real GDP and price level in Yellowland?
c) What is the long-run equilibrium real GDP?
d) Is Yellowland’s short-run macroeconomic equilibrium a full-employment equilibrium, below
full-employment equilibrium, or above full-employment equilibrium? What is the recessionary
gap (if any)? What is the inflationary gap (if any)?
e) Suppose aggregate supply decreases by $150 billion. Plot the new aggregate supply curve.
How do real GDP and the price level change in the short run?
f) Is Yellowland’s new short-run macroeconomic equilibrium a full-employment equilibrium,
below full-employment equilibrium, or above full-employment equilibrium? What is the
recessionary gap (if any)? What is the inflationary gap (if any)?