Chapter 10/Externalities ❖ 21
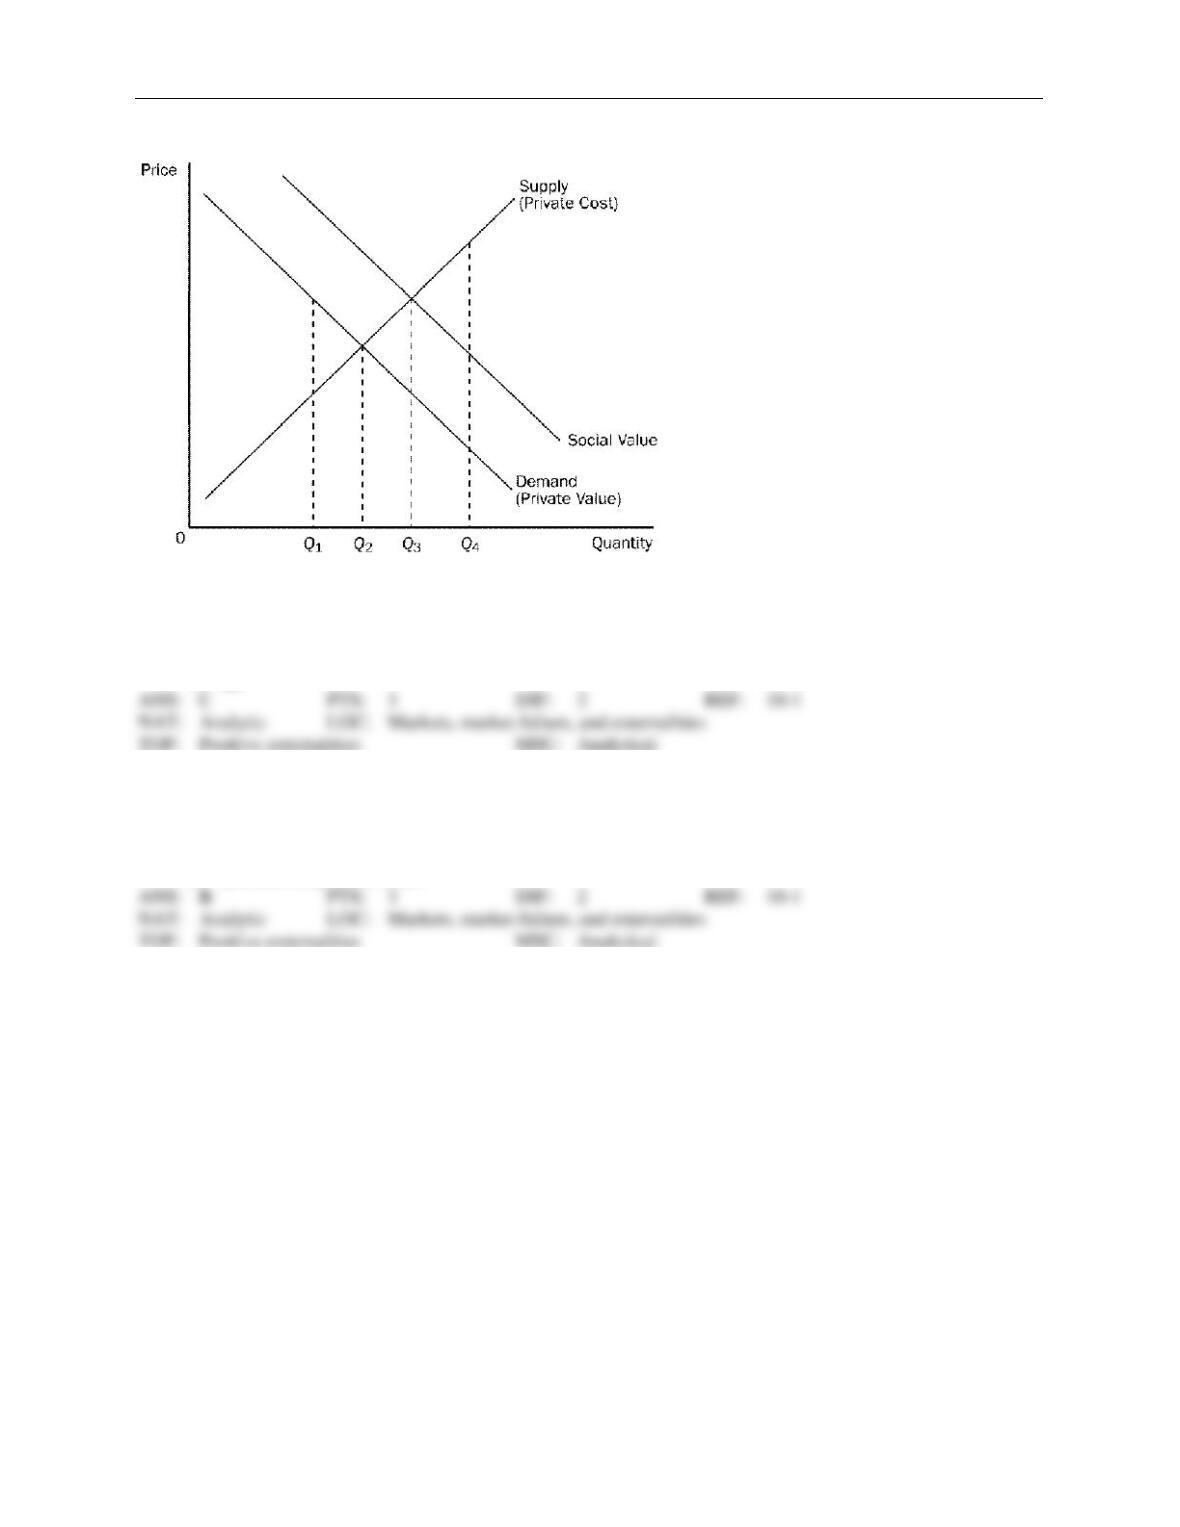
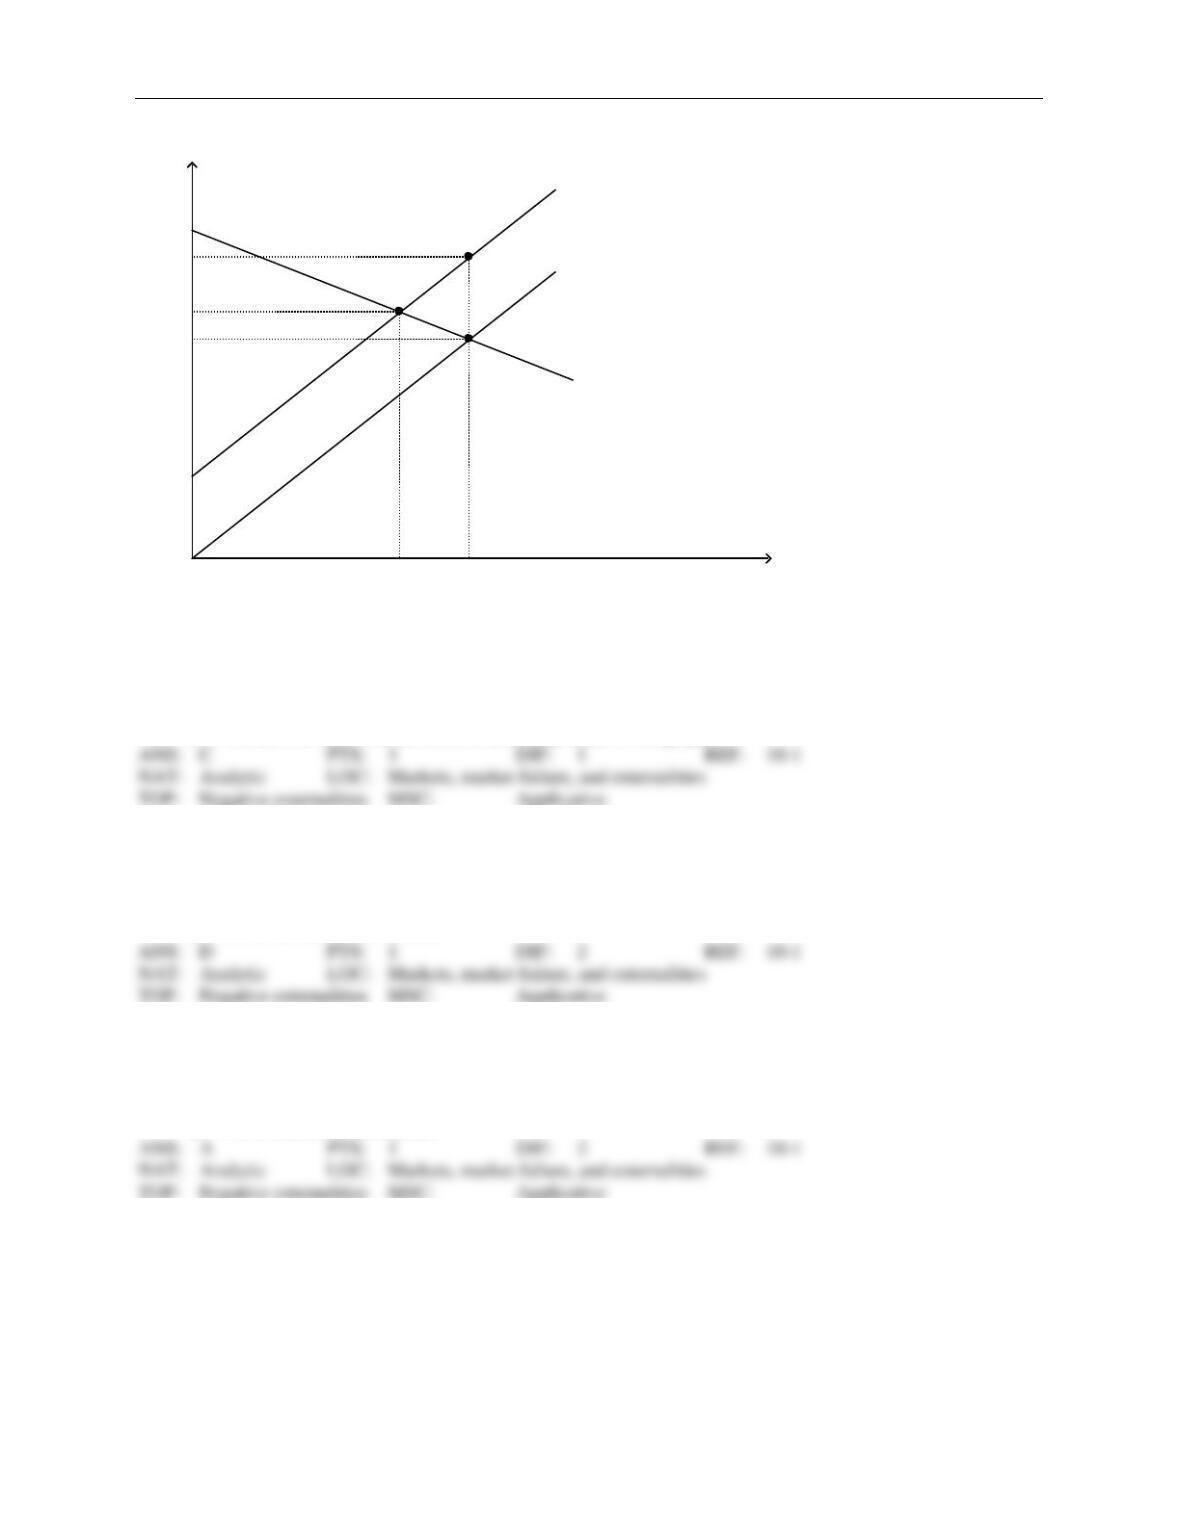
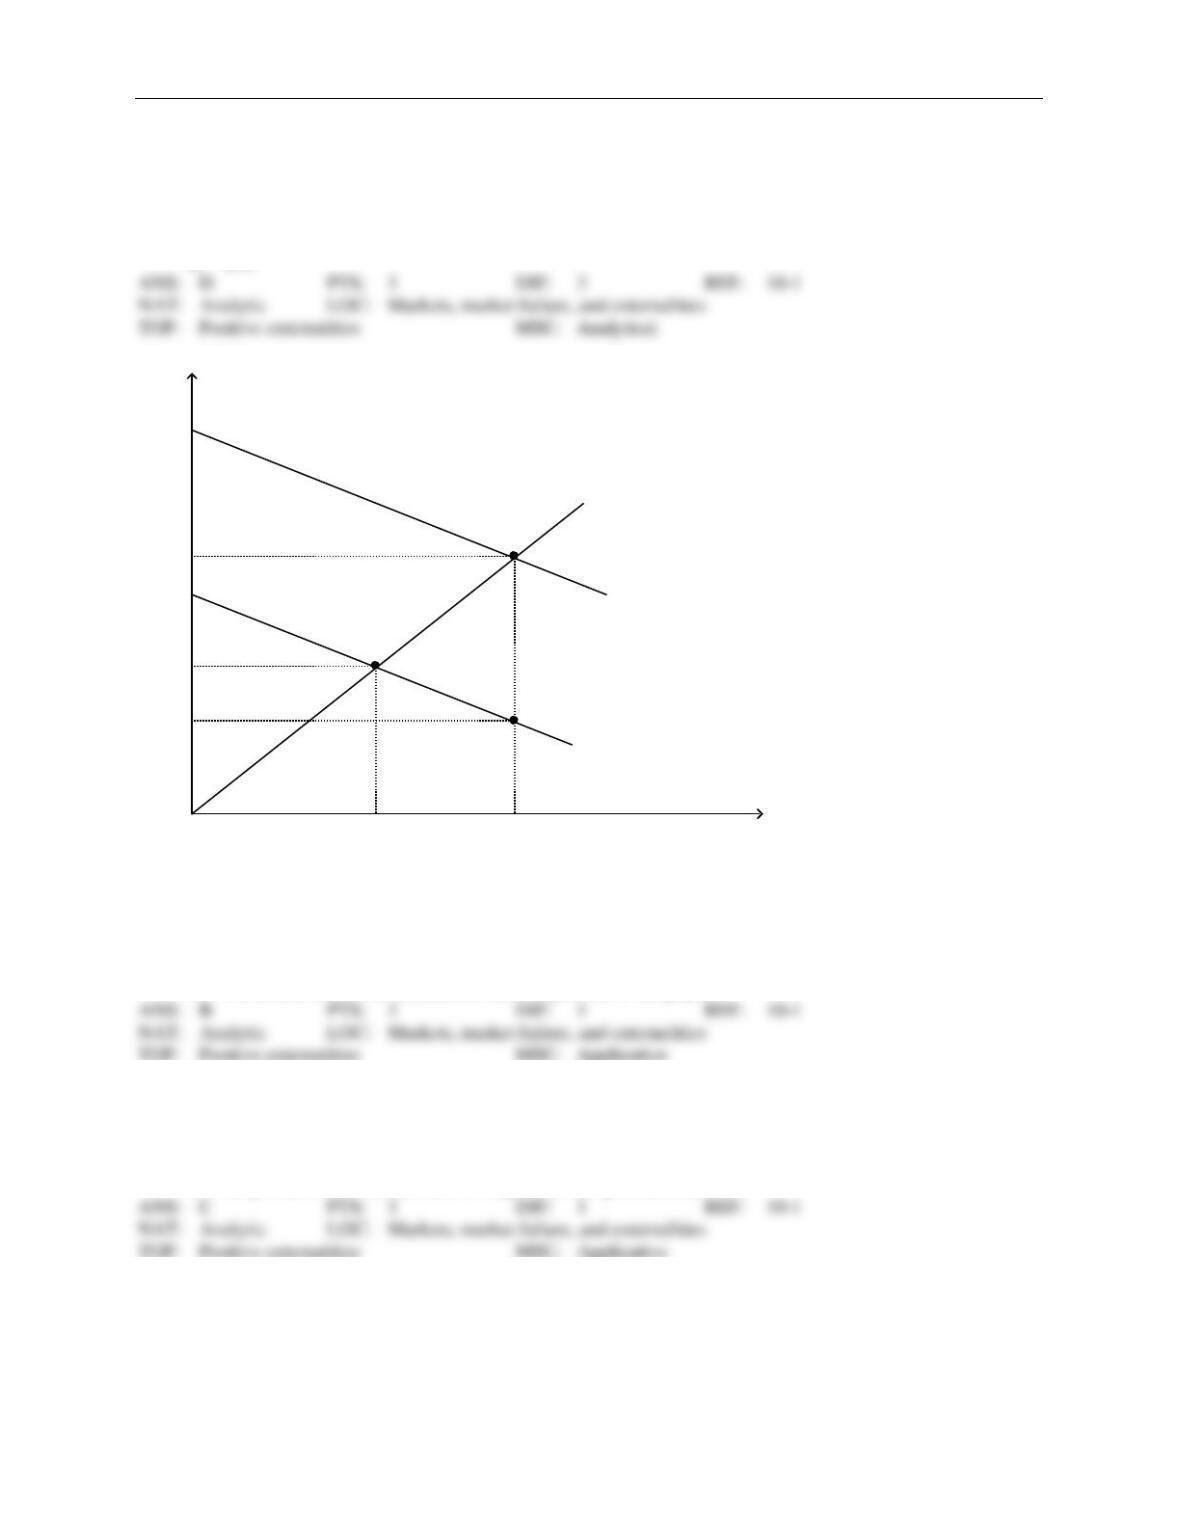
Figure 10-7
67. Refer to Figure 10-7. Which quantity represents the social optimum for this market?
a.
Q1.
b.
Q2.
c.
Q3.
d.
Q4.
68. Refer to Figure 10-7. To internalize the externality in this market, the government should
a.
impose a tax on this product.
b.
provide a subsidy for this product.
c.
forbid production.
d.
produce the product itself.
22 ❖ Chapter 10/Externalities
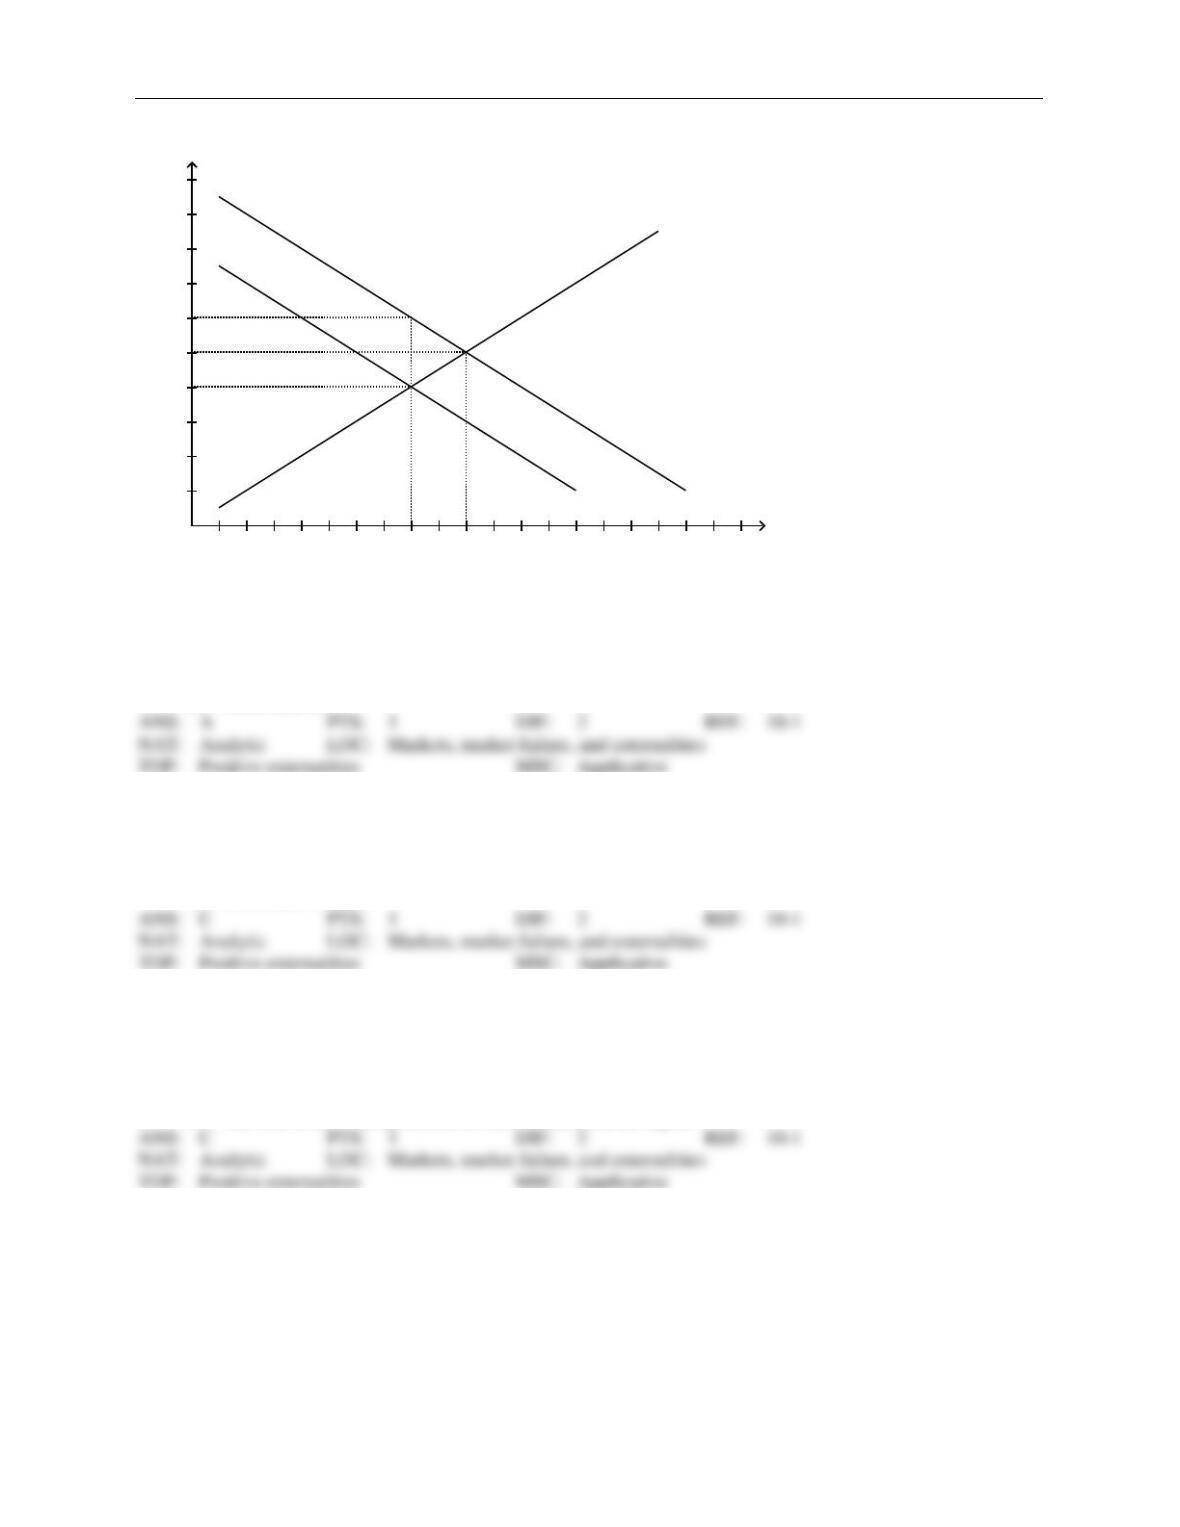
Figure 10-8
69. Refer to Figure 10-8. What is the equilibrium price in this market?
a.
$8
b.
Between $8 and $10
c.
$10
d.
More than $10
70. Refer to Figure 10-8. What is the socially-optimal quantity of output in this market?
a.
8 units
b.
Between 8 and 10 units
c.
10 units
d.
More than 10 units
71. Refer to Figure 10-8. If the government wanted to subsidize this market to achieve the socially-optimal level
of output, how large would the subsidy need to be?
a.
less than $2
b.
$2
c.
more than $2
d.
The size of the subsidy cannot be determined from the figure.
Demand Social Value
Supply
1 2 3 4 5 6 7 8 9 10 11 12 13 14 15 16 17 Quantity
2
4
6
8
10
12
14
16
18
20 Price
Chapter 10/Externalities ❖ 23
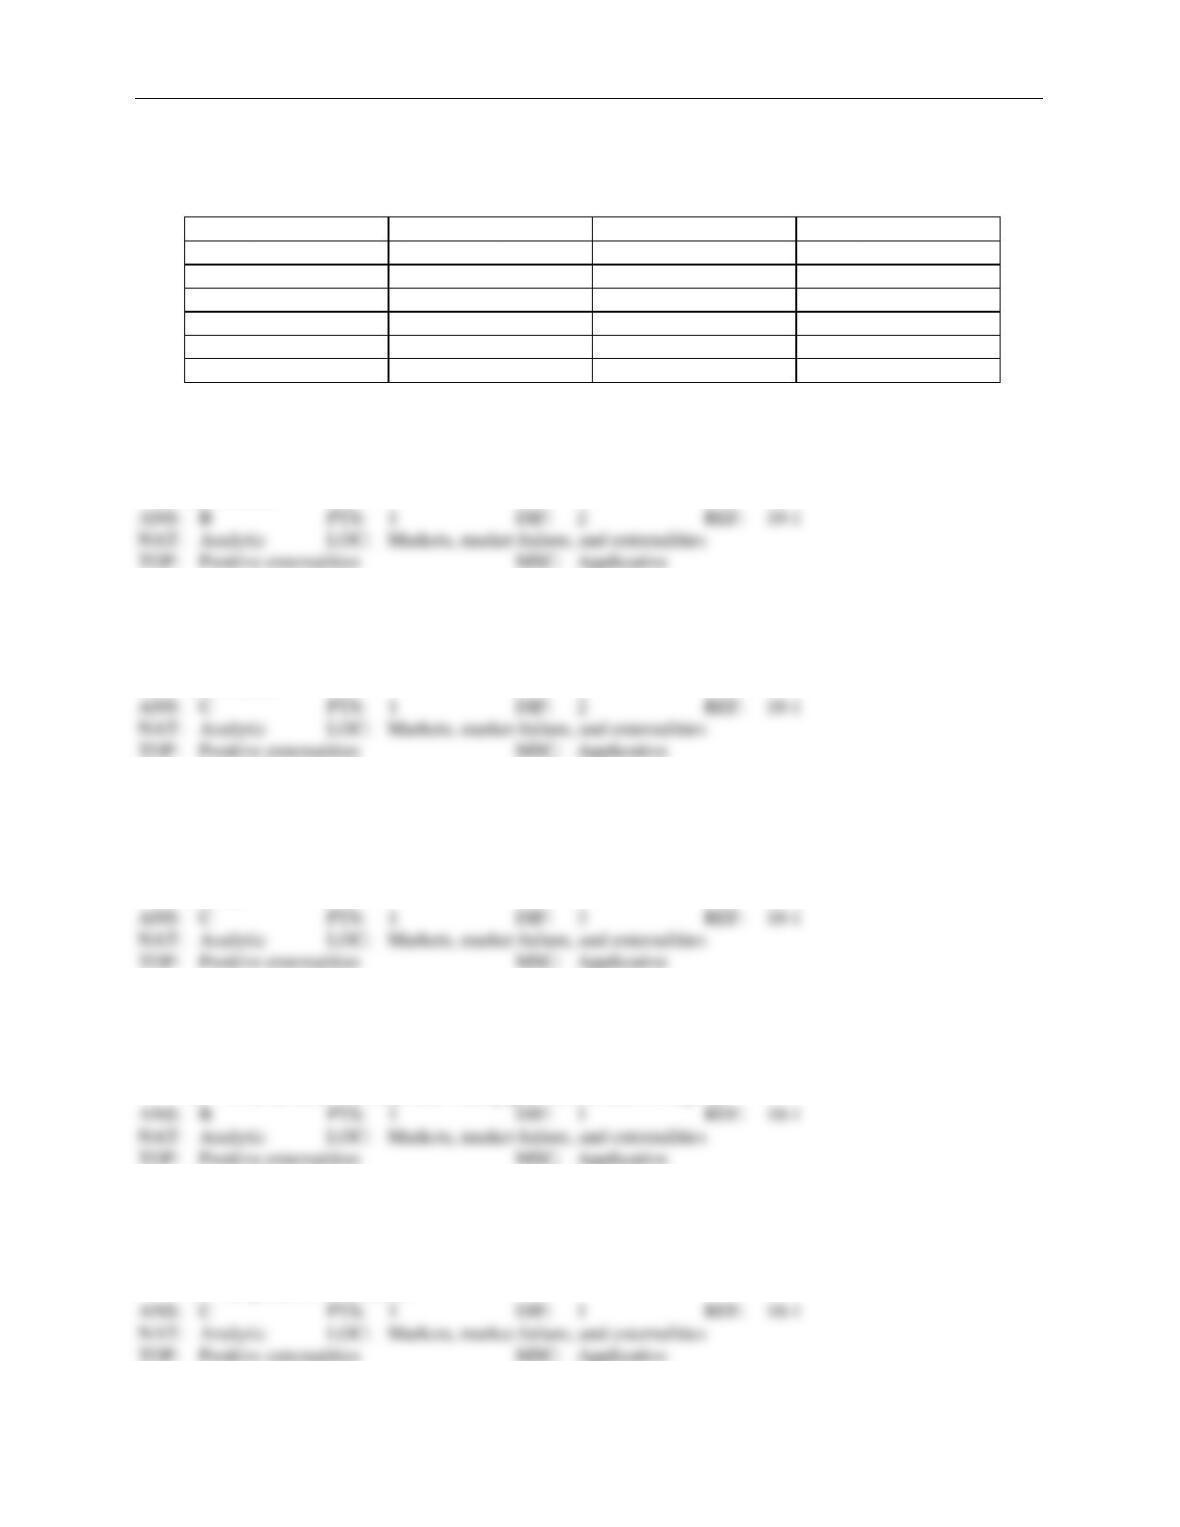
Table 10-2
The following table shows the private value, private cost, and social value for a market with a positive
externality.
Quantity
Private Value
Private Cost
Social Value
1
27
6
34
2
24
10
31
3
21
14
28
4
18
18
25
5
15
22
22
6
12
26
19
72. Refer to Table 10–2. What is the equilibrium quantity of output in this market?
a.
3 units
b.
4 units
c.
5 units
d.
6 units
73. Refer to Table 10–2. What is the socially-optimal level of output in this market?
a.
3 units
b.
4 units
c.
5 units
d.
6 units
74. Refer to Table 10–2. How large would a subsidy need to be in this market to move the market from the equi-
librium level of output to the socially-optimal level of output?
a.
$3
b.
$5
c.
$7
d.
$9
75. Which of the following is an example of a positive externality?
a.
A college student buys a new car when she graduates.
b.
The mayor of a small town plants flowers in the city park.
c.
Local high school teachers have pizza delivered every Friday for lunch.
d.
An avid fisherman buys new fishing gear for his next fishing trip.
76. Which of the following is an example of a positive externality?
a.
air pollution
b.
a person littering in a public park
c.
a nice garden in front of your neighbor’s house
d.
the pollution of a stream
24 ❖ Chapter 10/Externalities
77. Internalizing a positive externality will cause the demand curve to
a.
shift to the right.
b.
shift to the left.
c.
become more elastic.
d.
remain unchanged.
78. Positive externalities
a.
result in a larger than efficient equilibrium quantity.
b.
result in smaller than efficient equilibrium quantity.
c.
result in an efficient equilibrium quantity.
d.
can be internalized with a corrective tax.
79. A positive externality
a.
is a benefit to the producer of the good.
b.
is a benefit to the consumer of the good.
c.
is a benefit to someone other than the producer and consumer of the good.
d.
results in an optimal level of output.
80. If a market is characterized by a positive externality that is not the result of a technology spillover,
a.
the socially optimal level of output is less than the equilibrium level of output, and the optimal price
is greater than the equilibrium price.
b.
the socially optimal level of output is greater than the equilibrium level of output, and the socially
optimal price is less than the equilibrium price.
c.
the socially optimal level of output is greater than the equilibrium level of output, and the socially
optimal price is greater than the equilibrium price.
d.
the socially optimal level of output is less than the equilibrium level of output, and the socially
optimal price is less than the equilibrium price.
81. To enhance the well-being of society, a social planner will encourage firms to increase production when
a.
the firms are producing basic goods.
b.
there is a shortage in the market.
c.
technology spillovers are associated with production.
d.
negative externalities “spill over” into production.
Chapter 10/Externalities ❖ 25
82. When the production of a good results in a positive externality, the social value curve is
a.
below the demand curve, indicating that the total value to society is less than the private benefit.
b.
above the demand curve, indicating that the total value to society is greater than the private benefit.
c.
identical to the demand curve, indicating that the total cost to society is the equal to the private
benefit.
d.
above the supply curve, indicating that the total cost to society exceeds the private cost.
83. A positive externality will cause a market to produce
a.
more than is socially desirable.
b.
less than is socially desirable.
c.
the socially optimal equilibrium amount.
d.
more than the same market would produce in the presence of a negative externality.
84. A positive externality
a.
causes the product to be overproduced.
b.
provides an additional benefit to market participants.
c.
benefits consumers because it results in a lower equilibrium price.
d.
is a benefit to a market bystander.
85. A positive externality occurs when
a.
Jack receives a benefit from John’s consumption of a certain good.
b.
Jack receives personal benefits from his own consumption of a certain good.
c.
Jack’s benefit exceeds John’s benefit when they each consume the same good.
d.
Jack’s receives a loss from John’s consumption of a certain good.
86. When a market experiences a positive externality,
a.
the demand curve does not reflect the value to society of the good.
b.
too much of the good is being produced.
c.
the government can internalize the externality by imposing a tax on the product.
d.
the private value is greater than the social value.
87. Private markets fail to reach a socially optimal equilibrium when positive externalities are present because the
a.
private benefit equals the social benefit at the private market solution.
b.
private cost exceeds the private benefit at the private market solution.
c.
social value exceeds the private value at the private market solution.
d.
private cost exceeds the social benefit at the private market solution.
26 ❖ Chapter 10/Externalities
88. Which of the following policies is the government most inclined to use when faced with a positive externality?
a.
taxation
b.
permits
c.
subsidies
d.
usage fees
89. If education produces positive externalities, we would expect
a.
the government to tax education.
b.
the government to subsidize education.
c.
people to realize the benefits, which would increase the demand for education.
d.
colleges to relax admission requirements.
90. If education produces positive externalities and the government does not intervene in the market, we would
expect
a.
the equilibrium price to be higher than the optimal price.
b.
the equilibrium quantity to be lower than the optimal level.
c.
the equilibrium quantity to be higher than the optimal level.
d.
both a and b are correct
91. Suppose that cookie producers create a positive externality equal to $2 per dozen. What is the relationship be-
tween the equilibrium quantity and the socially optimal quantity of cookies to be produced?
a.
They are equal.
b.
The equilibrium quantity is greater than the socially optimal quantity.
c.
The equilibrium quantity is less than the socially optimal quantity.
d.
There is not enough information to answer the question.
92. Suppose that flower gardens create a positive externality equal to $1 per plant. What is the relationship be-
tween the equilibrium quantity and the socially optimal quantity of plants grown?
a.
They are equal.
b.
The equilibrium quantity is greater than the socially optimal quantity.
c.
The equilibrium quantity is less than the socially optimal quantity.
d.
There is not enough information to answer the question.
93. Suppose that flu shots create a positive externality equal to $12 per shot. What is the relationship between the
equilibrium quantity and the socially optimal quantity of flu shots produced?
a.
They are equal.
b.
The equilibrium quantity is greater than the socially optimal quantity.
c.
The equilibrium quantity is less than the socially optimal quantity.
d.
There is not enough information to answer the question.
Chapter 10/Externalities ❖ 27
94. Suppose that elementary education creates a positive externality. If the government does not subsidize educa-
tion, then
a.
the equilibrium quantity of education will be equal to the socially optimal quantity of education.
b.
the equilibrium quantity of education will be greater than the socially optimal quantity of education.
c.
the equilibrium quantity of education will be less than the socially optimal quantity of education.
d.
There is not enough information to answer the question.
95. Which of the following is an example of a positive externality?
a.
Sue not catching the flu because she got a flu vaccine
b.
Mary not catching the flu from Sue because Sue got a flu vaccine
c.
Sue catching the flu because she did not get a flu vaccine
d.
Mary catching the flu from Sue because Sue did not get a flu vaccine
96. University researchers create a positive externality because what they discover in their research labs can easily
be learned by others who haven’t contributed to the research costs. If there are no subsidies, what is the rela-
tionship between the equilibrium quantity of university research and the optimal quantity of university re-
search produced?
a.
They are equal.
b.
The equilibrium quantity is greater than the socially optimal quantity.
c.
The equilibrium quantity is less than the socially optimal quantity.
d.
There is not enough information to answer the question.
97. Flu shots provide a positive externality. Suppose that the market for vaccinations is perfectly competitive.
Without government intervention in the vaccination market, which of the following statements is correct?
a.
At the current output level, the marginal social benefit exceeds the marginal private benefit.
b.
The current output level is inefficiently low.
c.
A per-shot subsidy could turn an inefficient situation into an efficient one.
d.
All of the above are correct.
98. Because there are positive externalities from higher education,
a.
private markets will under-supply college classes.
b.
private markets will over-supply college classes.
c.
the government should impose a tax on college students.
d.
government intervention cannot improve the market for college classes.
28 ❖ Chapter 10/Externalities
99. Which of the following is true of markets characterized by positive externalities?
a.
Social value exceeds private value, and market quantity exceeds the socially optimal quantity.
b.
Social value is less than private value, and market quantity exceeds the socially optimal quantity.
c.
Social value exceeds private value, and market quantity is less than the socially optimal quantity.
d.
Social value seldom exceeds private value; therefore, social quantity is less than private quantity.
100. In the case of a technology spillover, internalizing a positive externality will cause the supply curve of an in-
dustry to
a.
shift to the right.
b.
shift to the left.
c.
become more elastic.
d.
remain unchanged.
101. Which of the following statements is not correct?
a.
A patent is a way for the government to encourage the production of a good with technology
spillovers.
b.
A tax is a way for the government to reduce the production of a good with a negative externality.
c.
A tax that accurately reflects social costs produces the socially optimal outcome.
d.
Government policies cannot improve upon private market outcomes.
102. Technology spillover is one type of
a.
negative externality.
b.
positive externality.
c.
subsidy.
d.
producer surplus.
103. Which of the following best defines the situation where one firm’s research yields knowledge that is used by
society as a whole?
a.
social cost
b.
opportunity cost of technology
c.
internalization of an externality
d.
technology spillover
104. Government intervention that aims to promote technology-enhancing industries is called
a.
assisted technology.
b.
intervention policy.
c.
industrial technology assistance.
d.
industrial policy.
Chapter 10/Externalities ❖ 29
105. Technology spillover occurs when
a.
a firm passes the high costs of technical research on to society through higher prices.
b.
a firm’s research yields technical knowledge that is used by society as a whole.
c.
the government subsidizes firms engaged in high-tech research.
d.
copyright laws prohibit firms from profiting from the research of others.
106. When technology spillover occurs,
a.
it is the government’s responsibility to own firms that are engaged in high-tech research.
b.
a firm’s research yields technological knowledge that can then be used by society as a whole.
c.
those firms engaged in technology research should be taxed by the government.
d.
firms invest in the latest production technology and the cost of that technology “spills over” to the
prices consumers must pay for the product.
107. Research into new technologies
a.
provides positive externalities because it creates knowledge others can use.
b.
results in negative externalities because government funding for research causes less government
spending in other areas.
c.
is protected by patent laws, which eliminates the need for government intervention.
d.
should only be funded by the corporations that will receive the profits from the research.
108. If the government wanted to ensure that the market reaches the socially optimal equilibrium in the presence of
a technology spillover, it should
a.
impose a corrective tax on any firm producing a technology spillover.
b.
offer tax credits to consumers who are adversely affected by the new technology.
c.
subsidize producers by an amount equal to the value of the technology spillover.
d.
provide research grants to those firms not currently engaging in research to increase competition in
the industry.
109. When an industry is characterized by technology spillover, what should the government do to ensure that the
market equilibrium equals the socially optimal equilibrium?
a.
Impose a tax greater than the value of the technology spillover.
b.
Not allow production of any product that causes a technology spillover.
c.
Provide a subsidy equal to the value of the technology spillover.
d.
Require producers to “clean up” any spillover that results from their production process.
30 ❖ Chapter 10/Externalities
110. In the case of a technology spillover, the government can encourage firms to internalize a positive externality
by
a.
taxing production, which would decrease supply.
b.
taxing production, which would increase supply.
c.
subsidizing production, which would decrease supply.
d.
subsidizing production, which would increase supply.
111. In the case of a technology spillover, internalizing a positive externality through a government subsidy will
cause the industry’s supply curve to
a.
shift up by an amount equal to the subsidy.
b.
shift down by an amount less than the subsidy.
c.
shift down by an amount equal to the subsidy.
d.
shift down by an amount greater than the subsidy.
112. Which of the following is NOT a way of internalizing technology spillovers?
a.
subsidies
b.
patent protection
c.
industrial policy
d.
taxes
113. If the production of computer chips yields greater technology spillovers than the production of potato chips,
the government should
a.
encourage the production of computer chips with subsidies.
b.
discourage the production of potato chips with taxes.
c.
encourage the production of potato chips with subsidies.
d.
discourage the production of computer chips with taxes.
114. One drawback to industrial policy is that
a.
technology spillovers are too expensive to control.
b.
measuring the size of spillovers from different markets is difficult.
c.
spillovers often occur in industries that produce undesirable products for society.
d.
positive side effects are often outweighed by negative side effects.
115. The goal of industrial policy should be that
a.
industries yielding the largest positive externalities should receive the biggest subsidies.
b.
any industry that produces negative externalities should be heavily taxed.
c.
any production process that produces negative externalities should be shut down.
d.
all industries that produce positive externalities should be equally subsidized.
Chapter 10/Externalities ❖ 31
116. Which of the following is the most effective way to internalize a technology spillover?
a.
taxes
b.
patents
c.
government regulations
d.
free markets
117. A patent is used to
a.
disseminate information.
b.
offset the negative effects of taxes.
c.
protect inventors for as long as they live.
d.
assign property rights.
118. Patents do not
a.
provide firms an incentive to research.
b.
assign property rights to inventors.
c.
protect the rights of inventors for their lifetimes.
d.
internalize externalities.
32 ❖ Chapter 10/Externalities
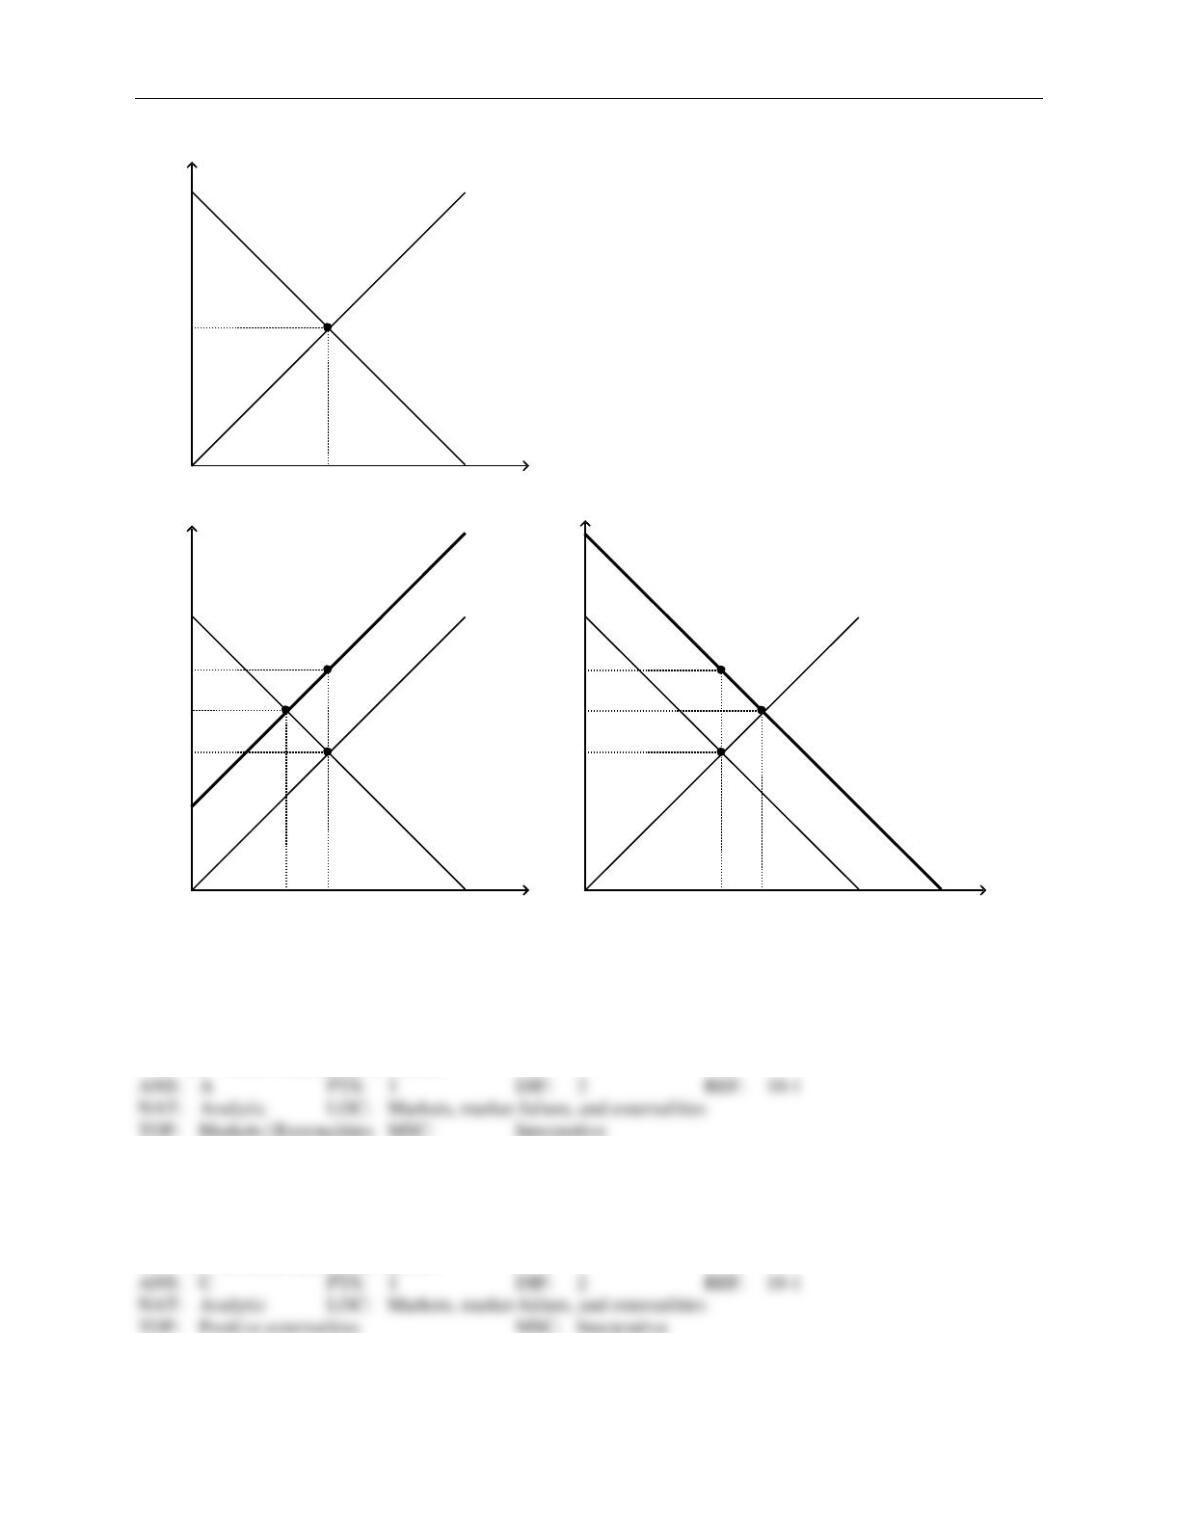
Figure 10-9
119. Refer to Figure 10-9. Which graph represents a market with no externality?
a.
Panel (a)
b.
Panel (b)
c.
Panel (c)
d.
None of the above is correct.
120. Refer to Figure 10-9. Which graph represents a market with a positive externality?
a.
Panel (a)
b.
Panel (b)
c.
Panel (c)
d.
Both (b) and (c) are correct.
Demand
Supply
Q1
Panel (a)
P1
Quantity
Price
Demand
Supply
Social cost
Q3Q2
Panel (b)
P3a
P2
P3b
Quantity
Price
Demand
Supply
Social value
Q4 Q5
Panel (c)
P4a
P5
P4b
Quantity
Price
Chapter 10/Externalities ❖ 33
121. Refer to Figure 10-9. Which graph represents a market with a negative externality?
a.
Panel (a)
b.
Panel (b)
c.
Panel (c)
d.
Both (b) and (c) are correct.
122. Refer to Figure 10-9, Panel (b). The market equilibrium quantity is
a.
Q2, which is the socially optimal quantity.
b.
Q3, which is the socially optimal quantity.
c.
Q2, and the socially optimal quantity is Q3.
d.
Q3, and the socially optimal quantity is Q2.
123. Refer to Figure 10-9, Panel (b). The market equilibrium price is
a.
P2.
b.
P3a.
c.
P3b.
d.
P3a – P3b.
124. Refer to Figure 10-9, Panel (c). The market equilibrium quantity is
a.
Q4, which is the socially optimal quantity.
b.
Q5, which is the socially optimal quantity.
c.
Q4, and the socially optimal quantity is Q5.
d.
Q5, and the socially optimal quantity is Q4.
125. Refer to Figure 10-9, Panel (c). The market equilibrium price is
a.
P4a.
b.
P4b.
c.
P5.
d.
P4a – P4b.
126. Refer to Figure 10-9. The overuse of antibiotics leads to the development of antibiotic-resistant diseases.
Therefore, the market for antibiotics is shown in
a.
Panel (a).
b.
Panel (b).
c.
Panel (c).
d.
Both (b) and (c) are correct.
34 ❖ Chapter 10/Externalities
127. Refer to Figure 10-9, Panel (b) and Panel (c). The overuse of antibiotics leads to the development of antibi-
otic-resistant diseases. Therefore, the socially optimal quantity of antibiotics is represented by point
a.
Q2.
b.
Q3.
c.
Q4.
d.
Q5.
128. Refer to Figure 10-9, Panel (b) and Panel (c). The overuse of antibiotics leads to the development of antibi-
otic-resistant diseases. Therefore, the external cost of antibiotic overuse is represented by
a.
Q3 – Q2.
b.
Q5 – Q4.
c.
P3a – P3b.
d.
P4a – P4b.
129. Refer to Figure 10-9, Panel (b) and Panel (c). The overuse of antibiotics leads to the development of antibi-
otic-resistant diseases. Therefore, a government policy that internalized the externality would move the quan-
tity of antibiotics used from point
a.
Q2 to point Q3.
b.
Q3 to point Q2.
c.
Q4 to point Q5.
d.
Q5 to point Q4.
130. Refer to Figure 10-9. The installation of a scrubber in a smokestack reduces the emission of harmful chemi-
cals from the smokestack. Therefore, the market for smokestack scrubbers is shown in
a.
Panel (a).
b.
Panel (b).
c.
Panel (c).
d.
Both (b) and (c) are correct.
131. Refer to Figure 10-9, Panel (b) and Panel (c). The installation of a scrubber in a smokestack reduces the
emission of harmful chemicals from the smokestack. Therefore, the socially optimal quantity of smokestack
scrubbers is represented by point
a.
Q2.
b.
Q3.
c.
Q4.
d.
Q5.
Chapter 10/Externalities ❖ 35
132. Refer to Figure 10-9, Panel (b) and Panel (c). The installation of a scrubber in a smokestack reduces the
emission of harmful chemicals from the smokestack. Therefore, the external benefit of smokestack scrubber
installation is represented by
a.
Q3 – Q2.
b.
Q5 – Q4.
c.
P3a – P3b.
d.
P4a – P4b.
133. Refer to Figure 10-9, Panel (b) and Panel (c). The installation of a scrubber in a smokestack reduces the
emission of harmful chemicals from the smokestack. Therefore, a government policy that internalized the ex-
ternality would move the quantity of smokestack scrubbers installed from point
a.
Q2 to point Q3.
b.
Q3 to point Q2.
c.
Q4 to point Q5.
d.
Q5 to point Q4.
134. Refer to Figure 10-9, Panel (b) and Panel (c). Which of the following is correct?
a.
A tax would move the market in Panel (b) and the market in Panel (c) closer to the socially optimal
outcome.
b.
A subsidy would move the market in Panel (b) and the market in Panel (c) closer to the socially
optimal outcome.
c.
A tax would move the market in Panel (b) closer to the socially optimal outcome, but a subsidy
would move the market in Panel (c) closer to the socially optimal outcome.
d.
A subsidy would move the market in Panel (b) closer to the socially optimal outcome, but a tax
would move the market in Panel (c) closer to the socially optimal outcome.
36 ❖ Chapter 10/Externalities
Figure 10-10
135. Refer to Figure 10-10. The graph represents a market in which
a.
there is no externality.
b.
there is a positive externality.
c.
there is a negative externality.
d.
The answer cannot be determined from inspection of the graph.
136. Refer to Figure 10-10. Which of the following statements is correct?
a.
The private cost of producing the 160th unit of output is $16.
b.
The social cost of producing the 160th unit of output is $22.
c.
The external cost of producing the 160th unit of output is $6.
d.
All of the above are correct.
137. Refer to Figure 10-10. Which of the following statements is correct?
a.
The private cost of producing the 120th unit of output is $12.
b.
The social cost of producing the 120th unit of output is $22.
c.
The external cost of producing the 120th unit of output is $2.
d.
All of the above are correct.
0
6
24
160120
16
18
Demand
(private value)
Supply
(private cost)
Social cost (private cost
and external cost)
22
Quantity
Price
Chapter 10/Externalities ❖ 37
138. Refer to Figure 10-10. The socially optimal quantity of output is
a.
120 units, since the value to the buyer of the 120th unit is equal to the cost incurred by the seller of
the 120th unit.
b.
120 units, since the value to the buyer of the 120th unit is equal to the cost incurred by society of the
120th unit.
c.
160 units, since the value to the buyer of the 160th unit is equal to the cost incurred by the seller of
the 160th unit.
d.
160 units, since the value to the buyer of the 160th unit is equal to the cost incurred by society of the
160th unit.
139. Refer to Figure 10-10. A decrease in output from 160 units to 120 units would
a.
move the market from a socially efficient outcome to a socially inefficient outcome.
b.
reduce the external cost per unit of output.
c.
increase total economic well-being.
d.
not be an action of which a benevolent social planner would approve.
140. Refer to Figure 10-10. An increase in output from 120 units to 160 units would
a.
move the market from a socially efficient outcome to a socially inefficient outcome.
b.
increase the external cost per unit of output.
c.
increase total economic well-being.
d.
be an action of which a benevolent social planner would approve.
141. Refer to Figure 10-10. “The social cost of the last unit produced exceeds the value to buyers of the last unit
produced by $3.” This statement is correct at which quantity of output?
a.
120 units
b.
140 units
c.
160 units
d.
The statement is true at all quantities of output.
142. Refer to Figure 10-10. Taking into account private and external costs, the maximum total surplus that can be
achieved in this market is
a.
$760.
b.
$1,080.
c.
$1,440.
d.
$1,920.
38 ❖ Chapter 10/Externalities
Table 10-3
Quantity
Private Value
Private Cost
External Benefit
1
$22
$11
$10
2
$20
$14
$10
3
$18
$17
$10
4
$16
$20
$10
5
$14
$23
$10
6
$12
$26
$10
143. Refer to Table 10–3. The table represents a market in which
a.
there is no externality.
b.
there is a positive externality.
c.
there is a negative externality.
d.
The answer cannot be determined from inspection of the table.
144. Refer to Table 10–3. The social value of the 4th unit of output that is produced is
a.
$10.
b.
$16.
c.
$26.
d.
$30.
145. Refer to Table 10–3. The market equilibrium quantity of output is
a.
3 units.
b.
4 units.
c.
5 units.
d.
6 units.
146. Refer to Table 10–3. The socially optimal quantity of output is
a.
3 units.
b.
4 units.
c.
5 units.
d.
6 units.
147. Refer to Table 10–3. What amount of subsidy per unit of output would move the market from the equilibrium
level of output to the socially optimal level of output?
a.
$2
b.
$3
c.
$5
d.
$10
Chapter 10/Externalities ❖ 39
148. Refer to Table 10–3. Taking into account private and external costs, the maximum total surplus that can be
achieved in this market is
a.
$18.
b.
$38.
c.
$46.
d.
$55.
Figure 10-11
149. Refer to Figure 10-11. The graph represents a market in which
a.
there is no externality.
b.
there is a positive externality.
c.
there is a negative externality.
d.
The answer cannot be determined from inspection of the graph.
150. Refer to Figure 10-11. Which of the following magnitudes is constant over all units of output?
a.
the private value of the last unit of output that was produced and sold
b.
the social value of the last unit of output that was produced and sold
c.
the external benefit of the last unit of output that was produced and sold
d.
the private cost of the last unit of output that was produced and sold
0
42
280160
28
Demand
(private value)
Supply
(private cost)
24
16
Social value (private value
and external benefit)
10
Quantity
Price
40 ❖ Chapter 10/Externalities
151. Refer to Figure 10-11. Which of the following statements is correct?
a.
The private value of the 280th unit of output is $10.
b.
The social value of the 280th unit of output is $28.
c.
The external benefit of the 280th unit of output is $18.
d.
All of the above are correct.
152. Refer to Figure 10-11. Which of the following statements is correct?
a.
The private value of the 160th unit of output is $16.
b.
The social value of the 160th unit of output is $28.
c.
The external benefit of the 160th unit of output is $6.
d.
All of the above are correct.
153. Refer to Figure 10-11. The socially optimal quantity of output is
a.
160 units, since the value to the buyer of the 160th unit is equal to the cost incurred by the seller of
the 160th unit.
b.
160 units, since the value to society of the 160th unit is equal to the cost incurred by the seller of the
160th unit.
c.
280 units, since the value to the buyer of the 280th unit is equal to the cost incurred by the seller of
the 280th unit.
d.
280 units, since the value to society of the 280th unit is equal to the cost incurred by the seller of the
280th unit.
154. Refer to Figure 10-11. A benevolent social planner would prefer
a.
a $28 price to any other price.
b.
280 units to any other quantity of output.
c.
a subsidy of $18 per unit to a subsidy of $12 per unit.
d.
All of the above are correct.
155. Refer to Figure 10-11. “The social value of the last unit produced exceeds the private cost of the last unit
produced by $9.” This statement is correct at which quantity of output?
a.
140 units
b.
180 units
c.
220 units
d.
260 units