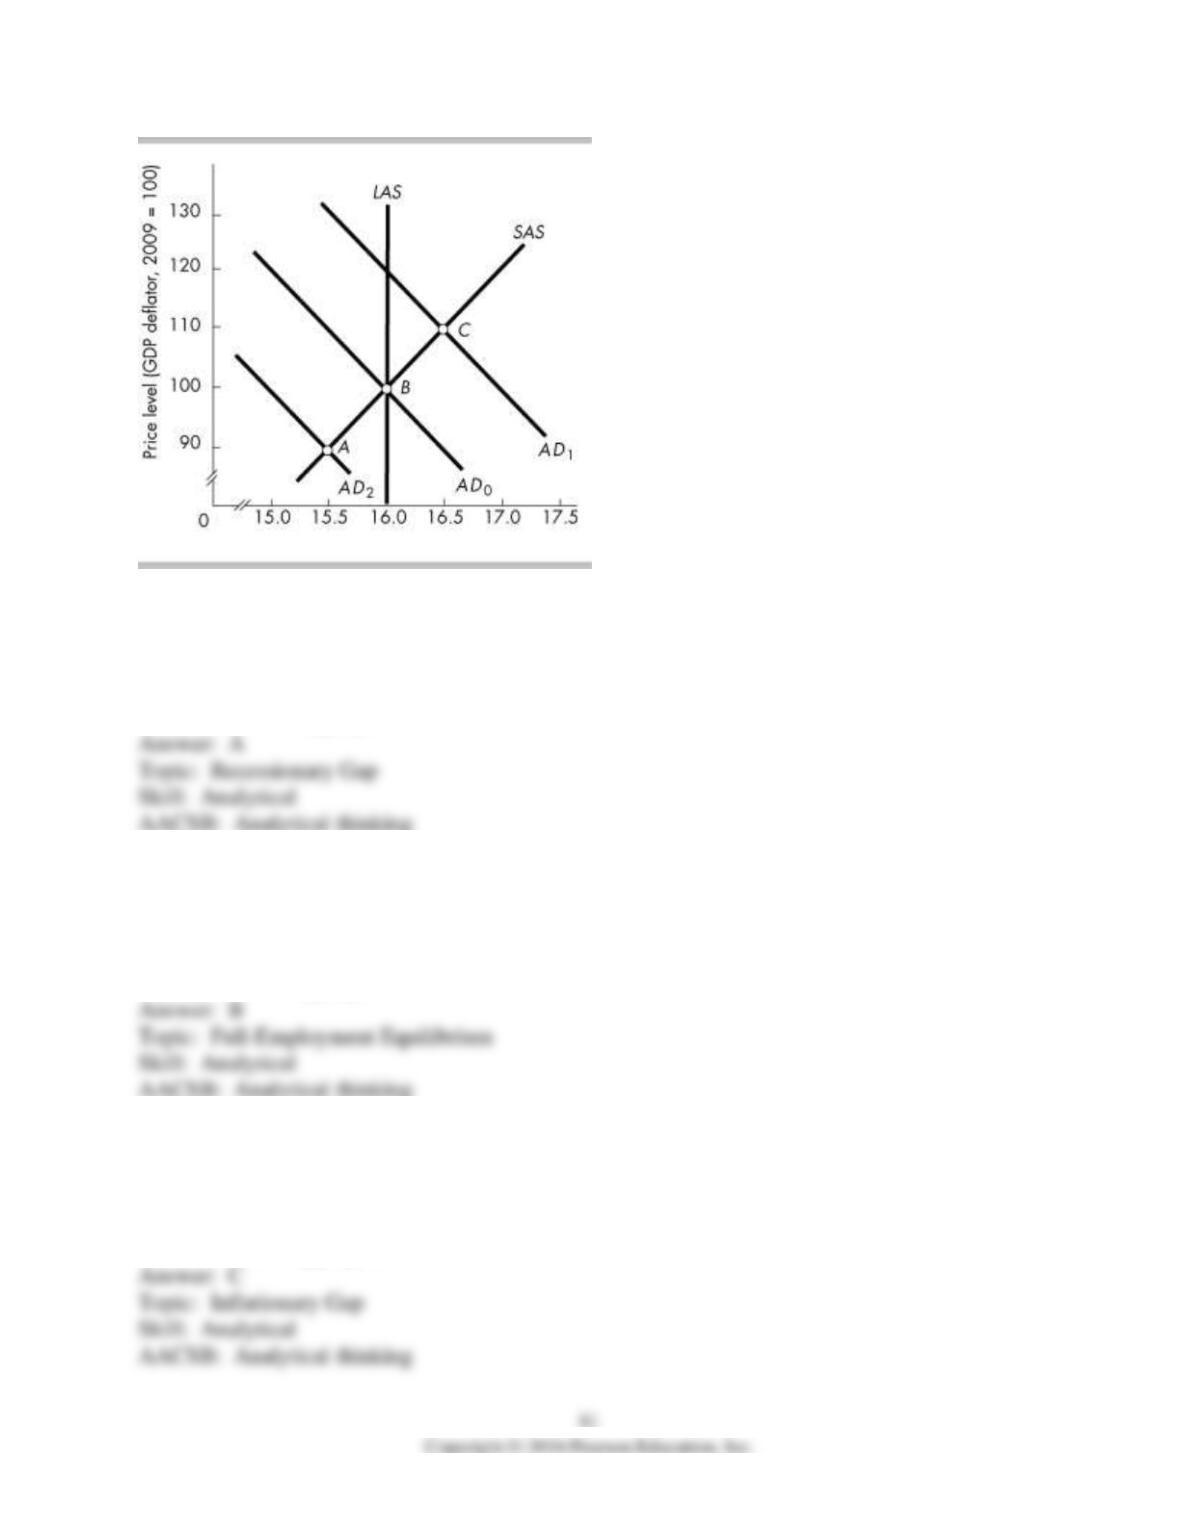
65) In the above figure, point A represents
A) a recessionary gap.
B) a full-employment equilibrium.
C) an inflationary gap.
D) an increase in aggregate demand.
66) In the above figure, point B represents
A) a recessionary gap.
B) a full-employment equilibrium.
C) an inflationary gap.
D) a decrease in aggregate demand.
67) In the above figure, point C represents
A) a recessionary gap.
B) a full-employment equilibrium.
C) an inflationary gap.
D) a decrease in aggregate demand.
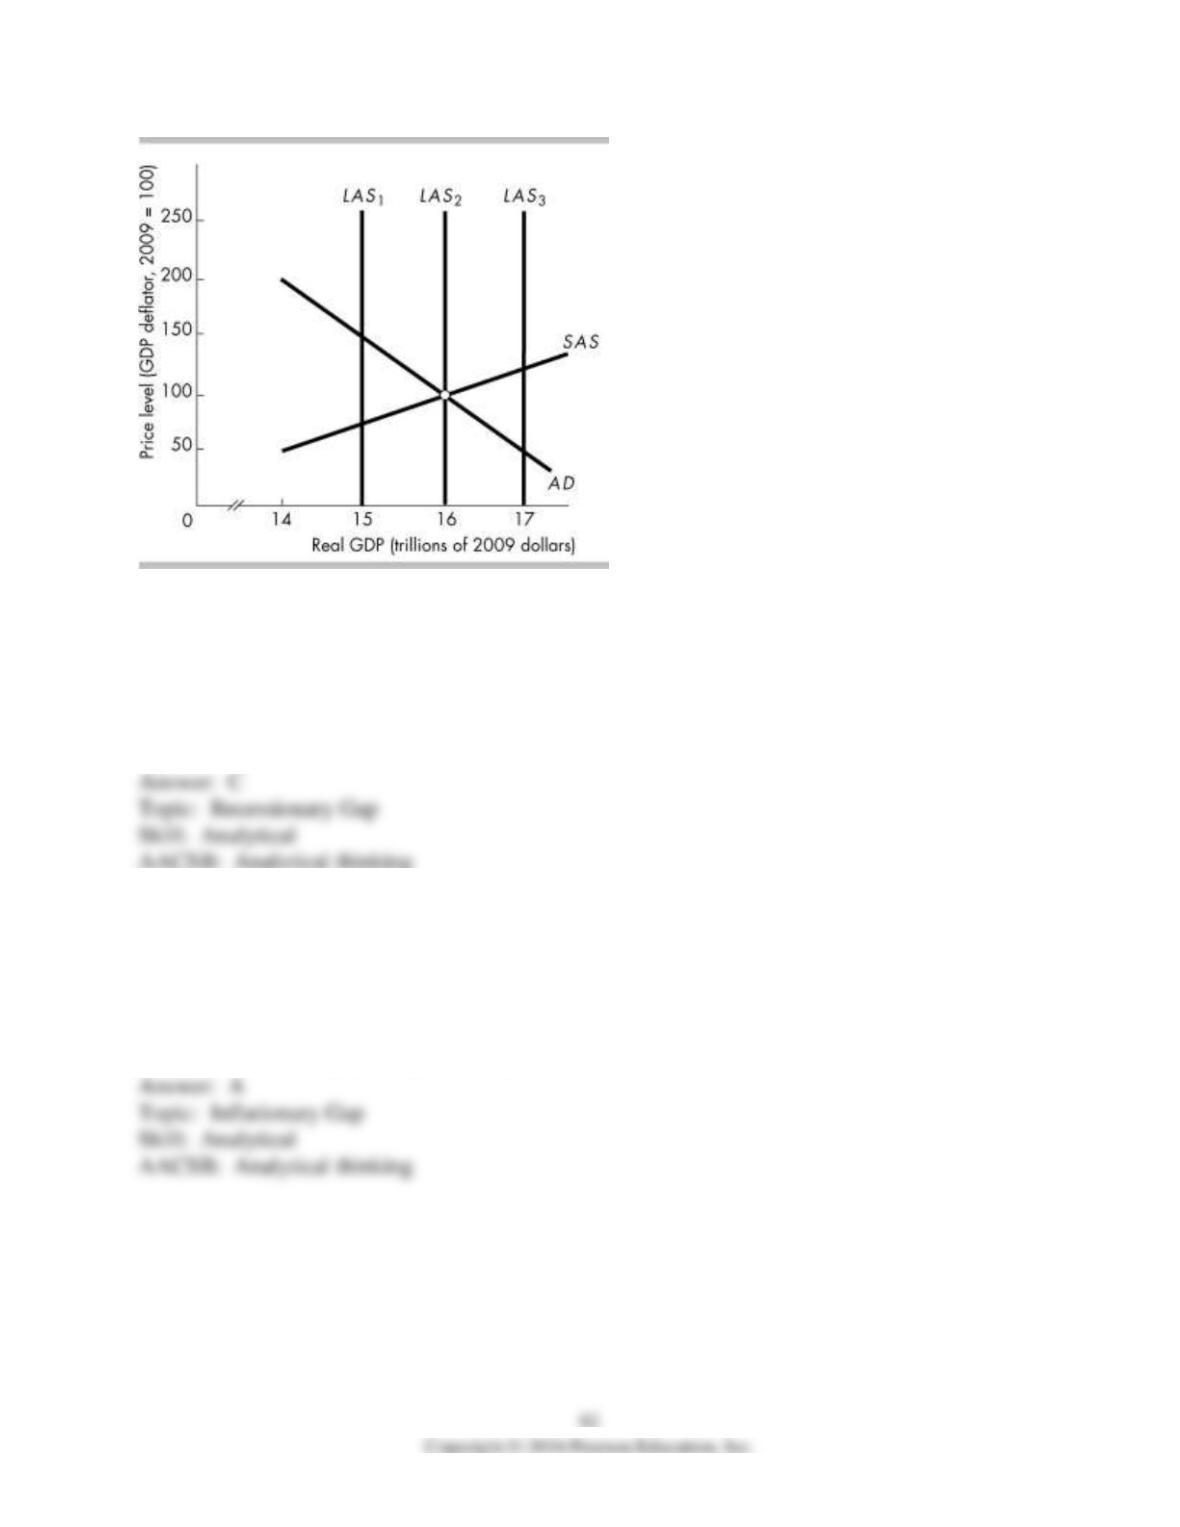
68) In the above figure, the short-run aggregate supply curve is SAS and the aggregate demand
curve is AD. A recessionary gap exists
A) if the long-run aggregate supply curve is LAS1.
B) if the long-run aggregate supply curve is LAS2.
C) if the long-run aggregate supply curve is LAS3.
D) All of the above answers are correct.
69) In the above figure, the short-run aggregate supply curve is SAS and the aggregate demand
curve is AD. An inflationary gap exists
A) if the long-run aggregate supply curve is LAS1.
B) if the long-run aggregate supply curve is LAS2.
C) if the long-run aggregate supply curve is LAS3.
D) All of the above answers are correct.
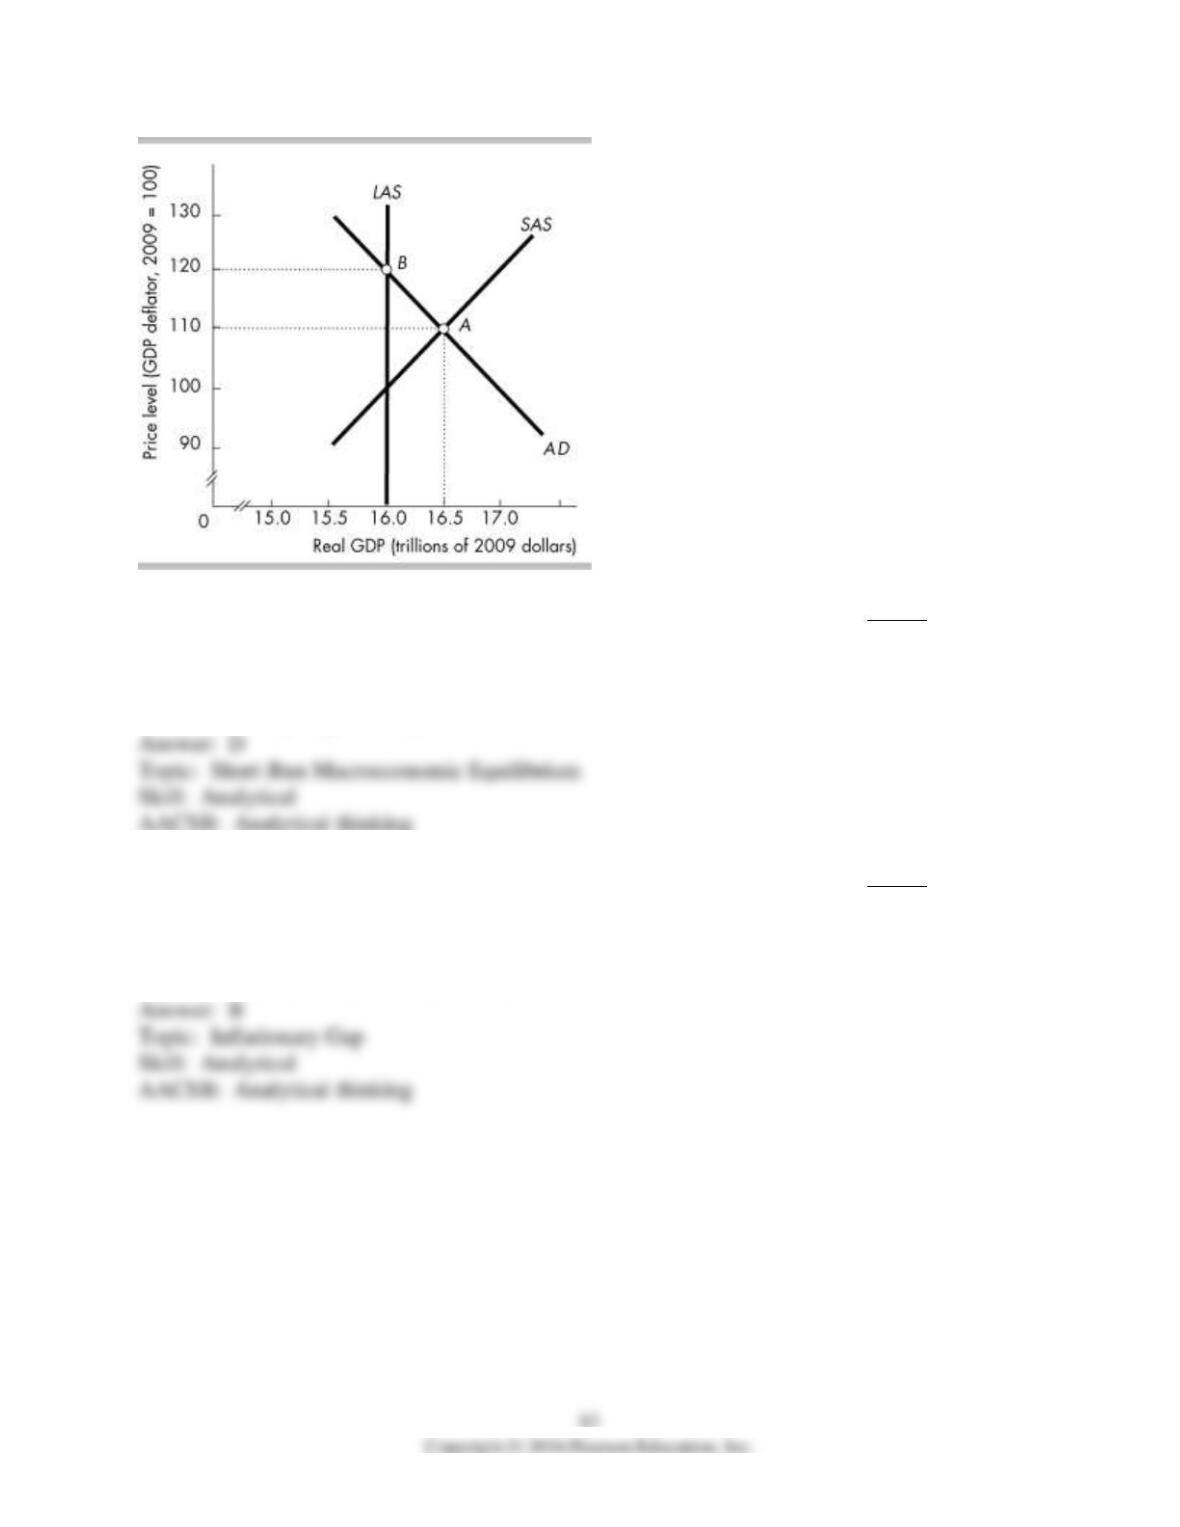
70) In the above figure, if the economy is at point A, which of the following is TRUE?
A) Point A is the long-run equilibrium point.
B) The economy is in a recession.
C) Money wages can be expected to fall.
D) The economy might be at point A as a result of a recent cut in the tax rate.
71) In the above figure, if the economy is at point A, which of the following is TRUE?
A) There is a recessionary gap.
B) There is an inflationary gap.
C) Point A is the long-run equilibrium point.
D) None of the above answers are correct.
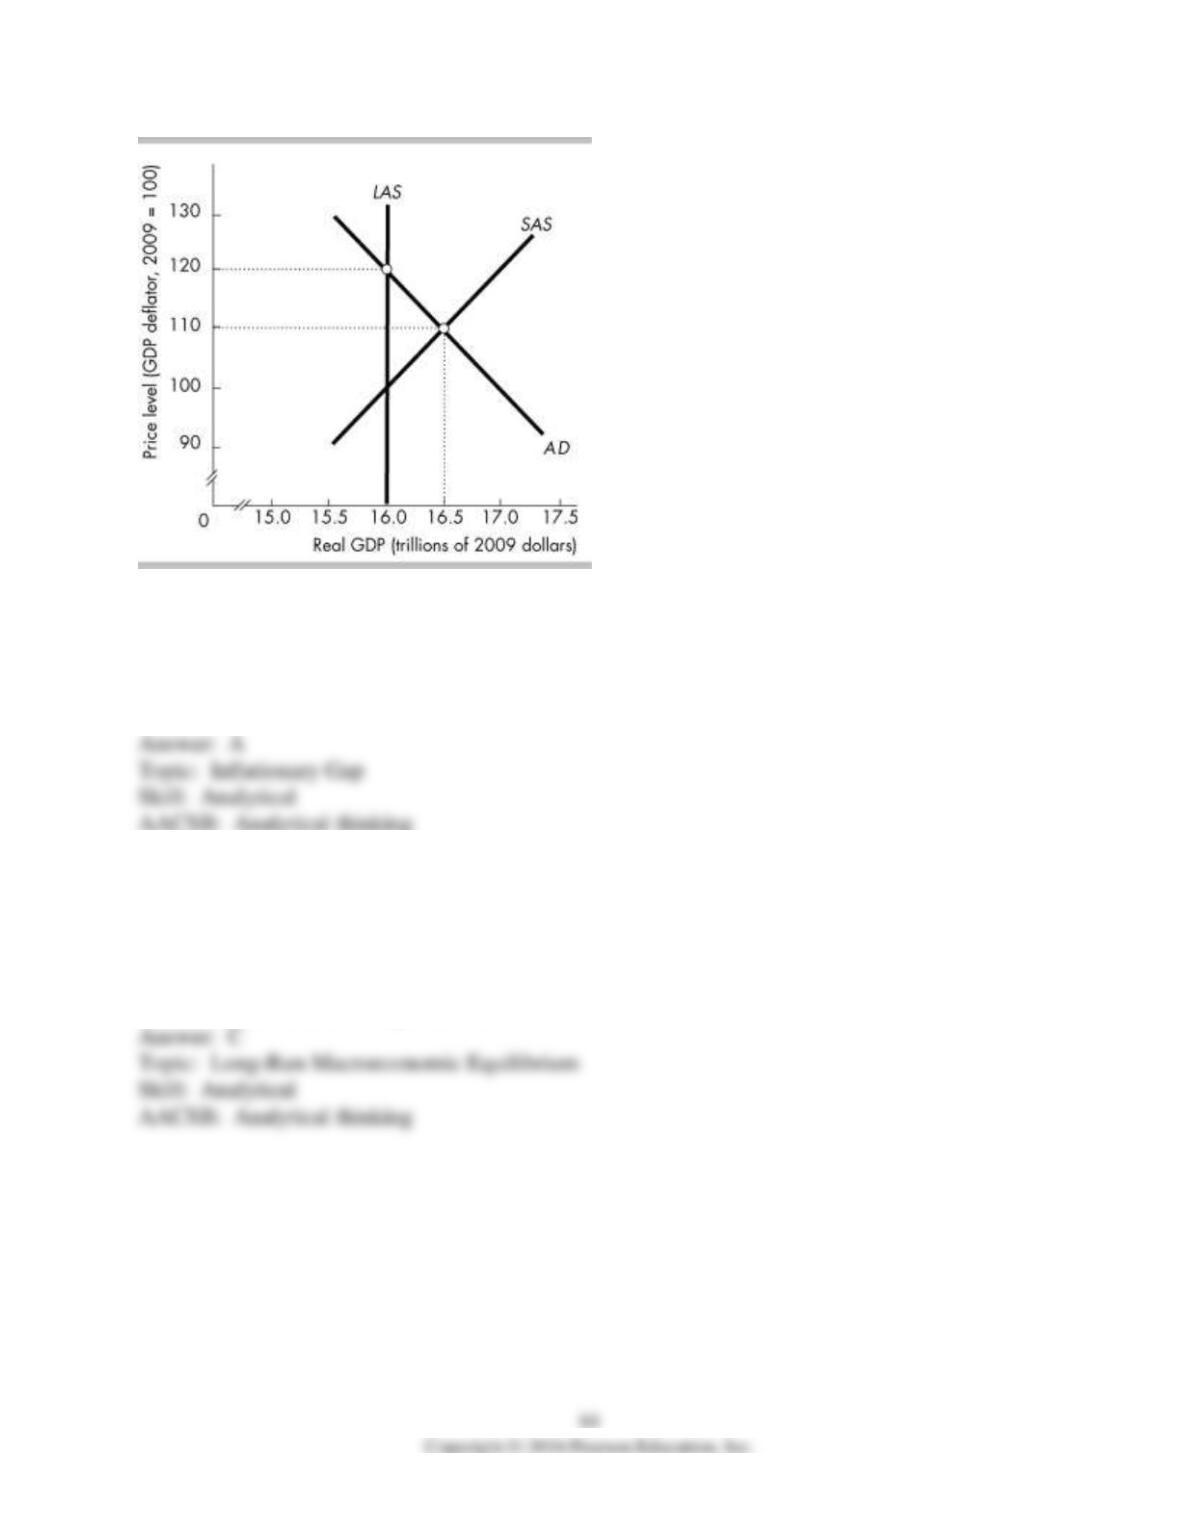
72) The above figure depicts an economy
A) with an inflationary gap.
B) with a recessionary gap.
C) producing at full employment.
D) None of the above answers is correct.
73) In the above figure, the short-run equilibrium will eventually adjust to a long-run equilibrium
with a
A) lower price level and smaller real GDP
B) higher price level and larger real GDP.
C) higher price level and smaller real GDP.
D) lower price level and larger real GDP.
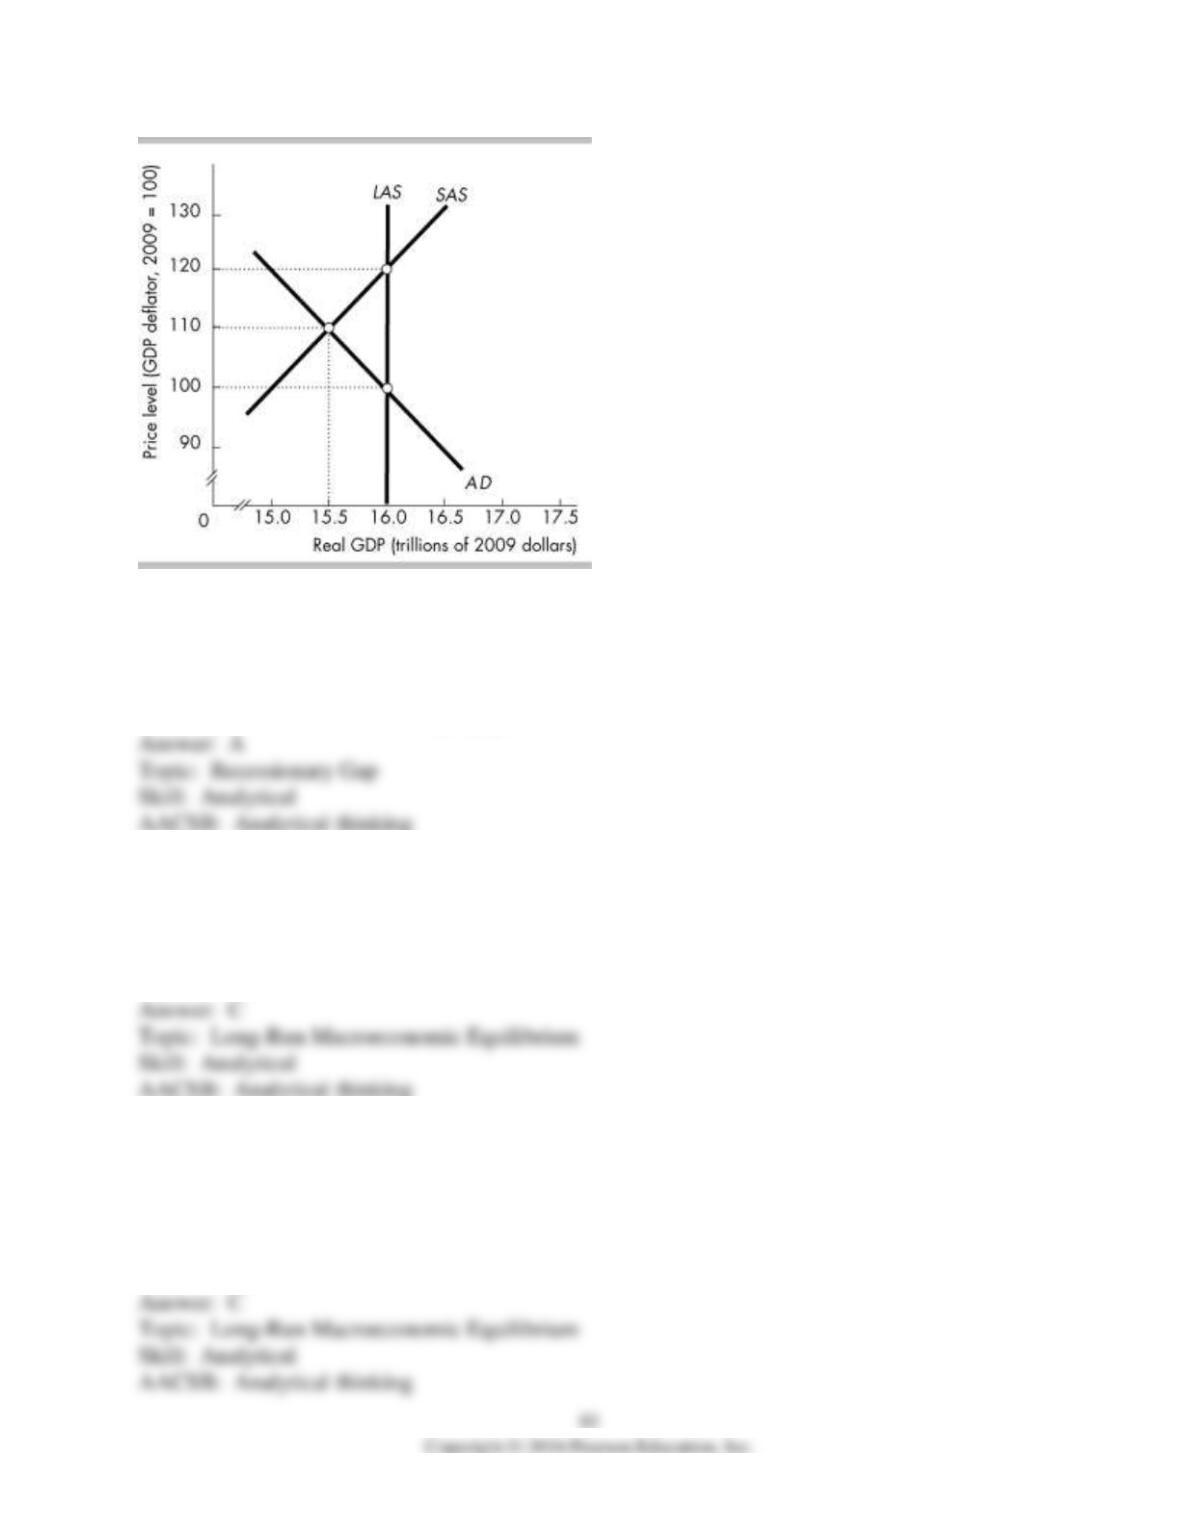
74) The above figure illustrates
A) a recessionary gap.
B) a full-employment equilibrium.
C) an inflationary gap.
D) an equilibrium at the economy’s physical limits.
75) In the above figure, if aggregate demand does not change, the short-run equilibrium will
A) eventually adjust to a long-run equilibrium with a higher price level.
B) not adjust on its own.
C) eventually adjust to a long-run equilibrium with a lower price level.
D) None of the above answers are correct.
76) In the above figure, if aggregate demand does not change, the long-run equilibrium will be at
the price level of ________ and real GDP of ________.
A) 100; $15.5 trillion
B) 120; $16 trillion
C) 100; $16 trillion
D) 110; $15.5 trillion
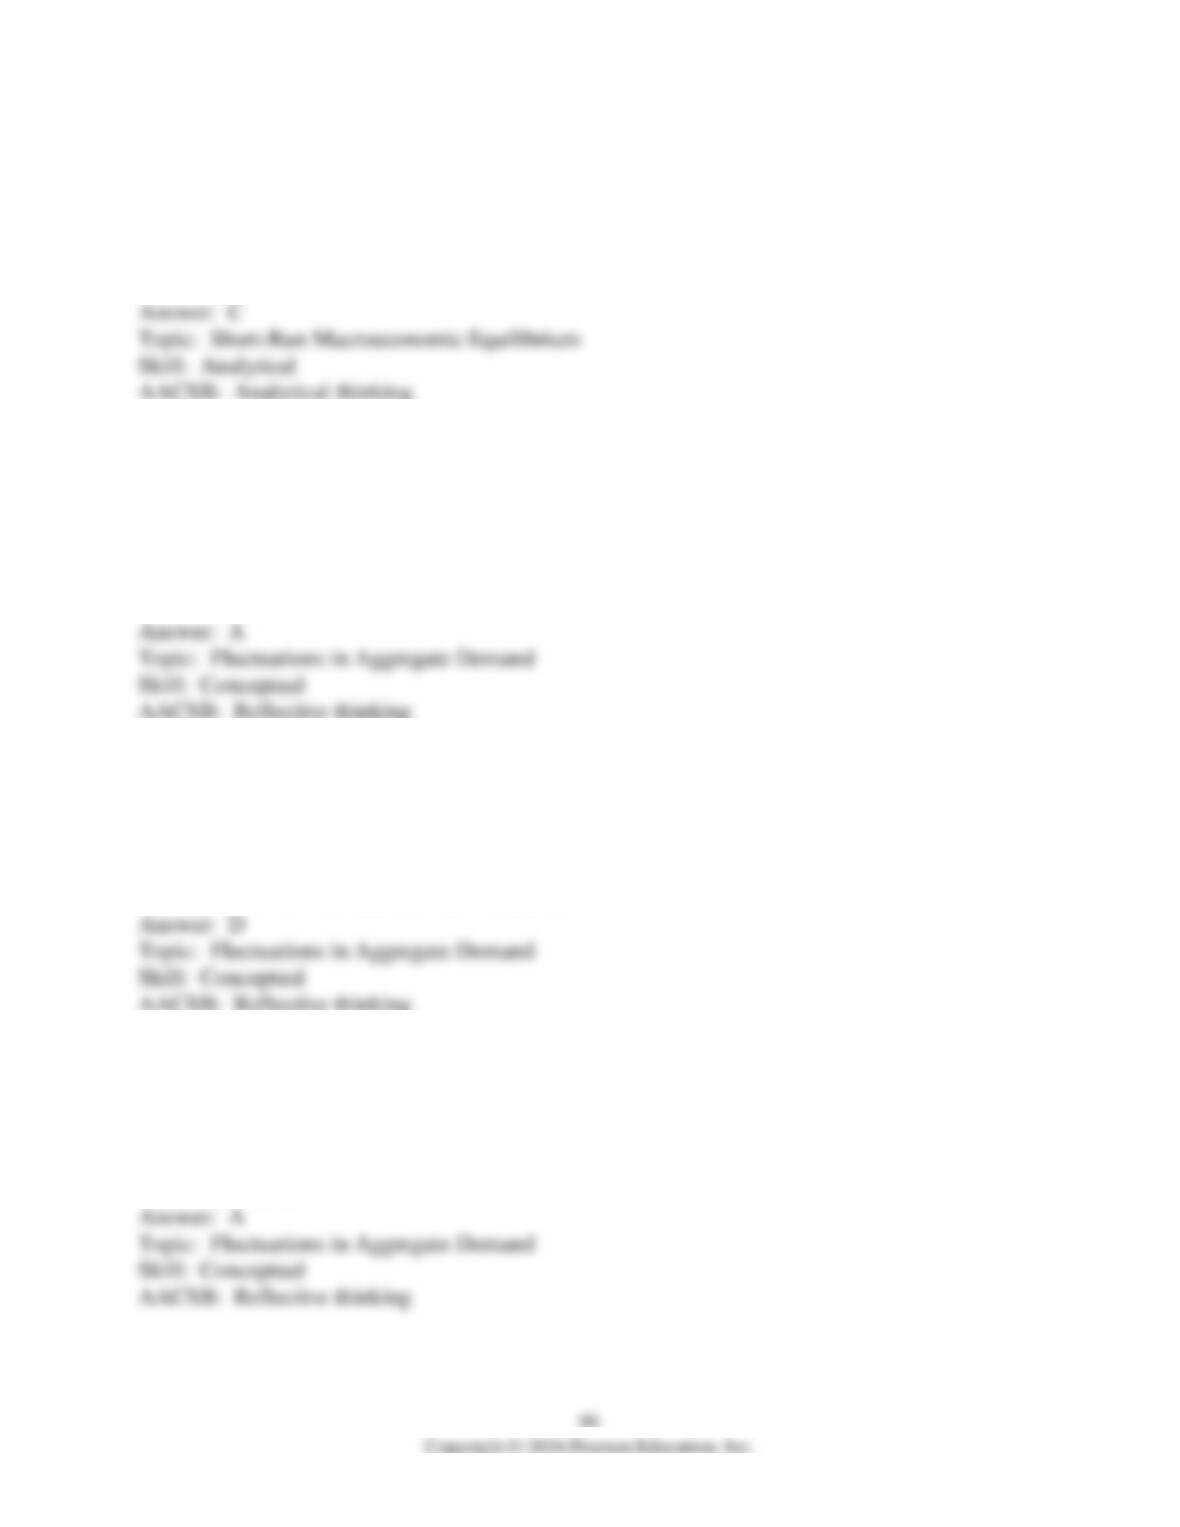
77) In the above figure, the short-run equilibrium is at the price level of ________ and real GDP
of ________.
A) 100; $15.5 trillion
B) 120; $16 trillion
C) 110; $15.5 trillion
D) 100; $16 trillion
78) Suppose the economy was initially in a long-run equilibrium. Then the world economy
expands so that foreign incomes rise. U.S. aggregate demand ________ and eventually the
money wage rate ________.
A) increases; rises
B) increases; falls
C) decreases; rises
D) decreases; falls
79) If the economy is in long run equilibrium and aggregate demand increases, then in the short
run
A) nothing happens because the economy is in long run equilibrium.
B) the price level rises and real GDP does not change.
C) real GDP increases and the price level does not change.
D) the price level rises and real GDP increases.
80) The Federal Reserve lowers interest rates. As a result, in the short run, real GDP ________
and the price level ________.
A) increases; rises
B) increases; falls
C) decreases; rises
D) decreases; falls
81) The government increases taxes. As a result, in the short run, real GDP ________ and the
price level ________.
A) increases; rises
B) decreases; falls
C) decreases; rises
D) increases; falls
82) In the short run, an increase in government expenditure on goods and services ________ real
GDP and ________ the price level.
A) increases; rises
B) increases; falls
C) decreases; rises
D) decreases; falls
83) In the short run, a decrease in government expenditure ________ real GDP and ________
the price level.
A) increases; increases
B) increases; decreases
C) decreases; increases
D) decreases; decreases
84) In the short run, an increase in aggregate demand
A) lowers the price level and decreases real GDP.
B) lowers the price level and increases real GDP.
C) raises the price level and increases real GDP.
D) raises the price level and decreases real GDP.
85) A lower price level combined with a decrease in real GDP occurs when the
A) short-run aggregate supply curve shifts rightward.
B) short-run aggregate supply curve shifts leftward.
C) aggregate demand curve shifts rightward.
D) aggregate demand curve shifts leftward.
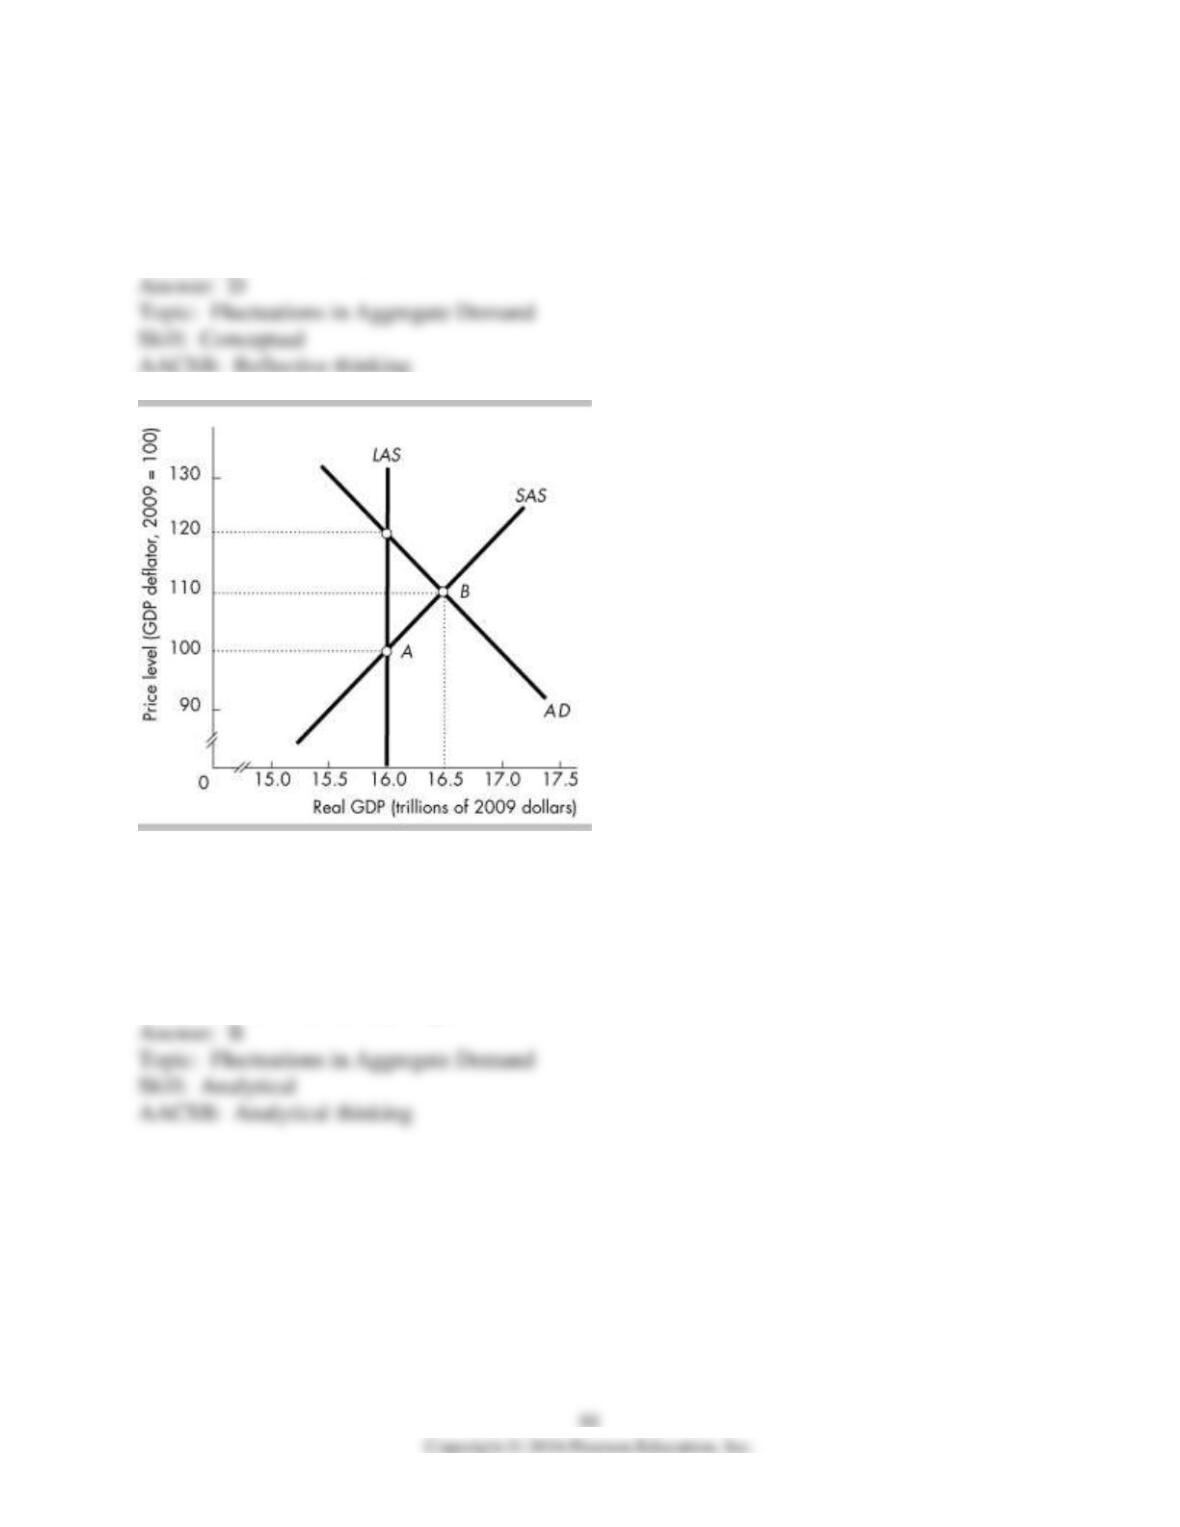
86) In the above figure, suppose the economy had been at point A and now is at B. What could
have led to the movement to B?
A) a tax hike
B) an increase in government expenditures on goods and services
C) Winter storms cause factories in the north to be shut down for several weeks.
D) an increase in the money wage rates
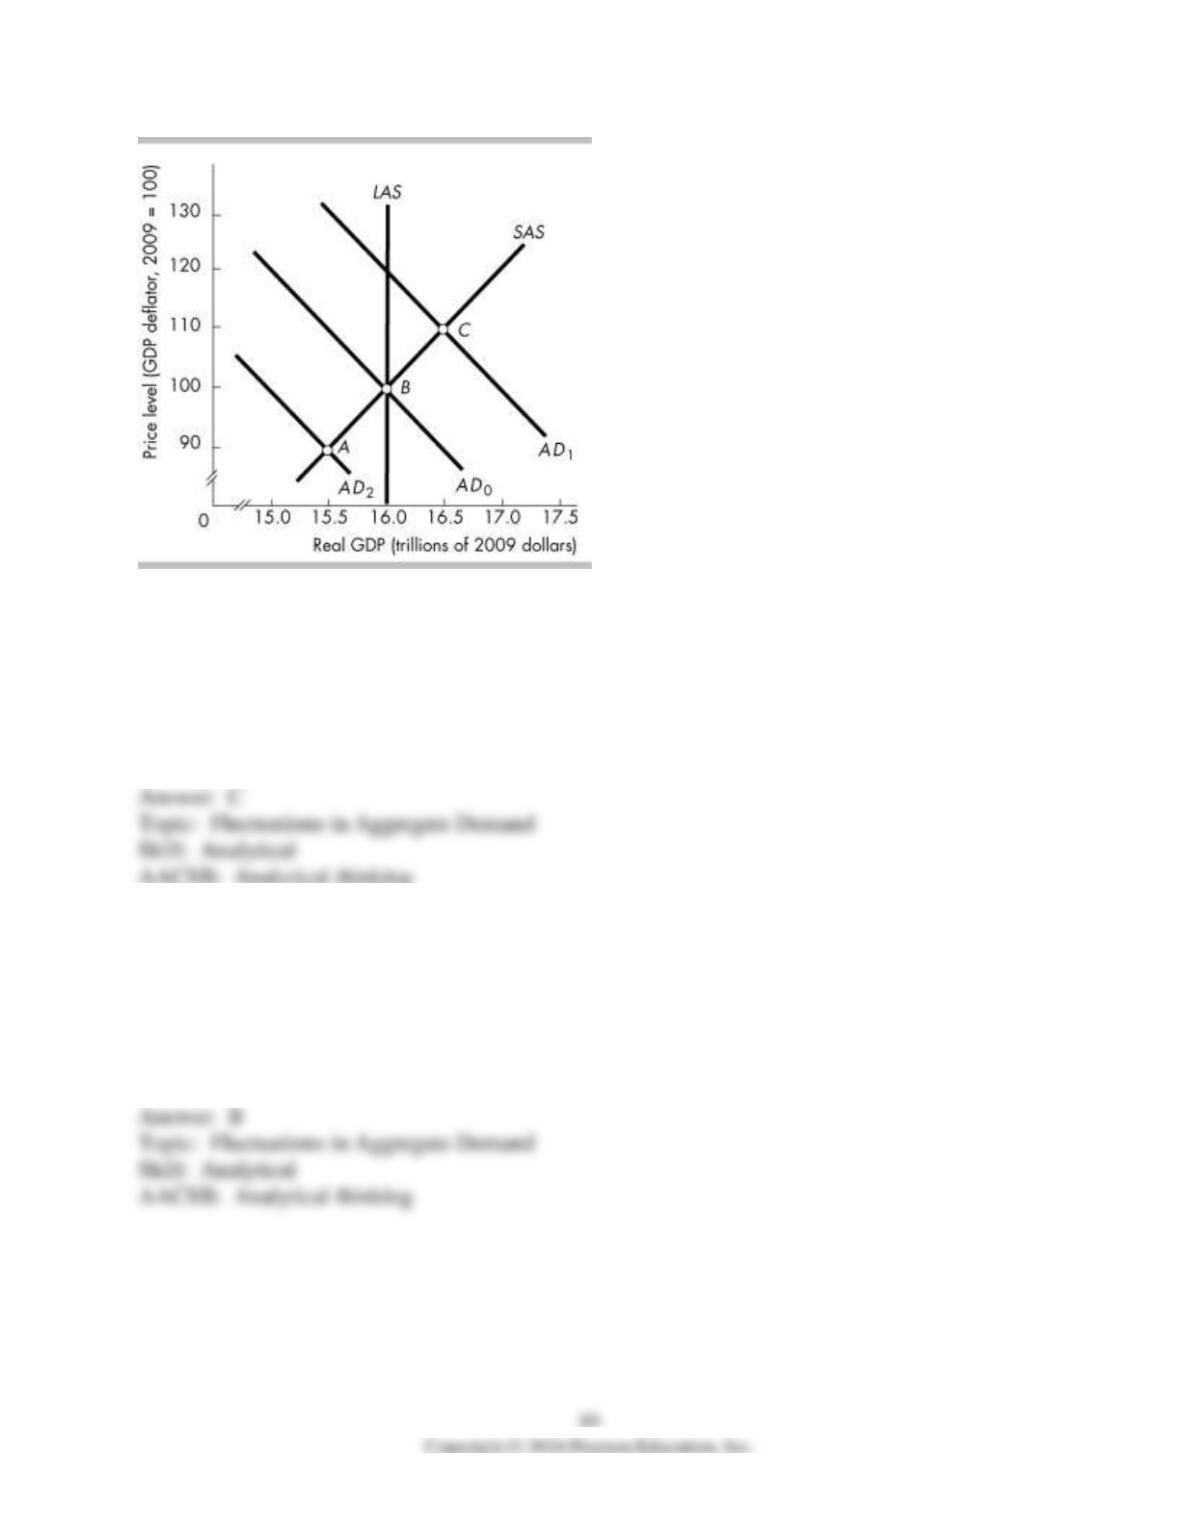
87) Suppose the economy is at point B. If firms expect profits will be higher in the future, to
what point might the economy’s move in the short run?
A) It stays at point B.
B) It shifts to a point such as A.
C) It shifts to a point such as C.
D) None of the above answers are correct because it is the SAS curve that shifts, not the AD
curve.
88) Suppose the economy is at point B. If a recession in another country decreases exports, to
what point might economy move in the short run?
A) It stays at point B.
B) It shifts to a point such as A.
C) It shifts to a point such as C.
D) None of the above answers are correct because it is the SAS curve that shifts, not the AD
curve.
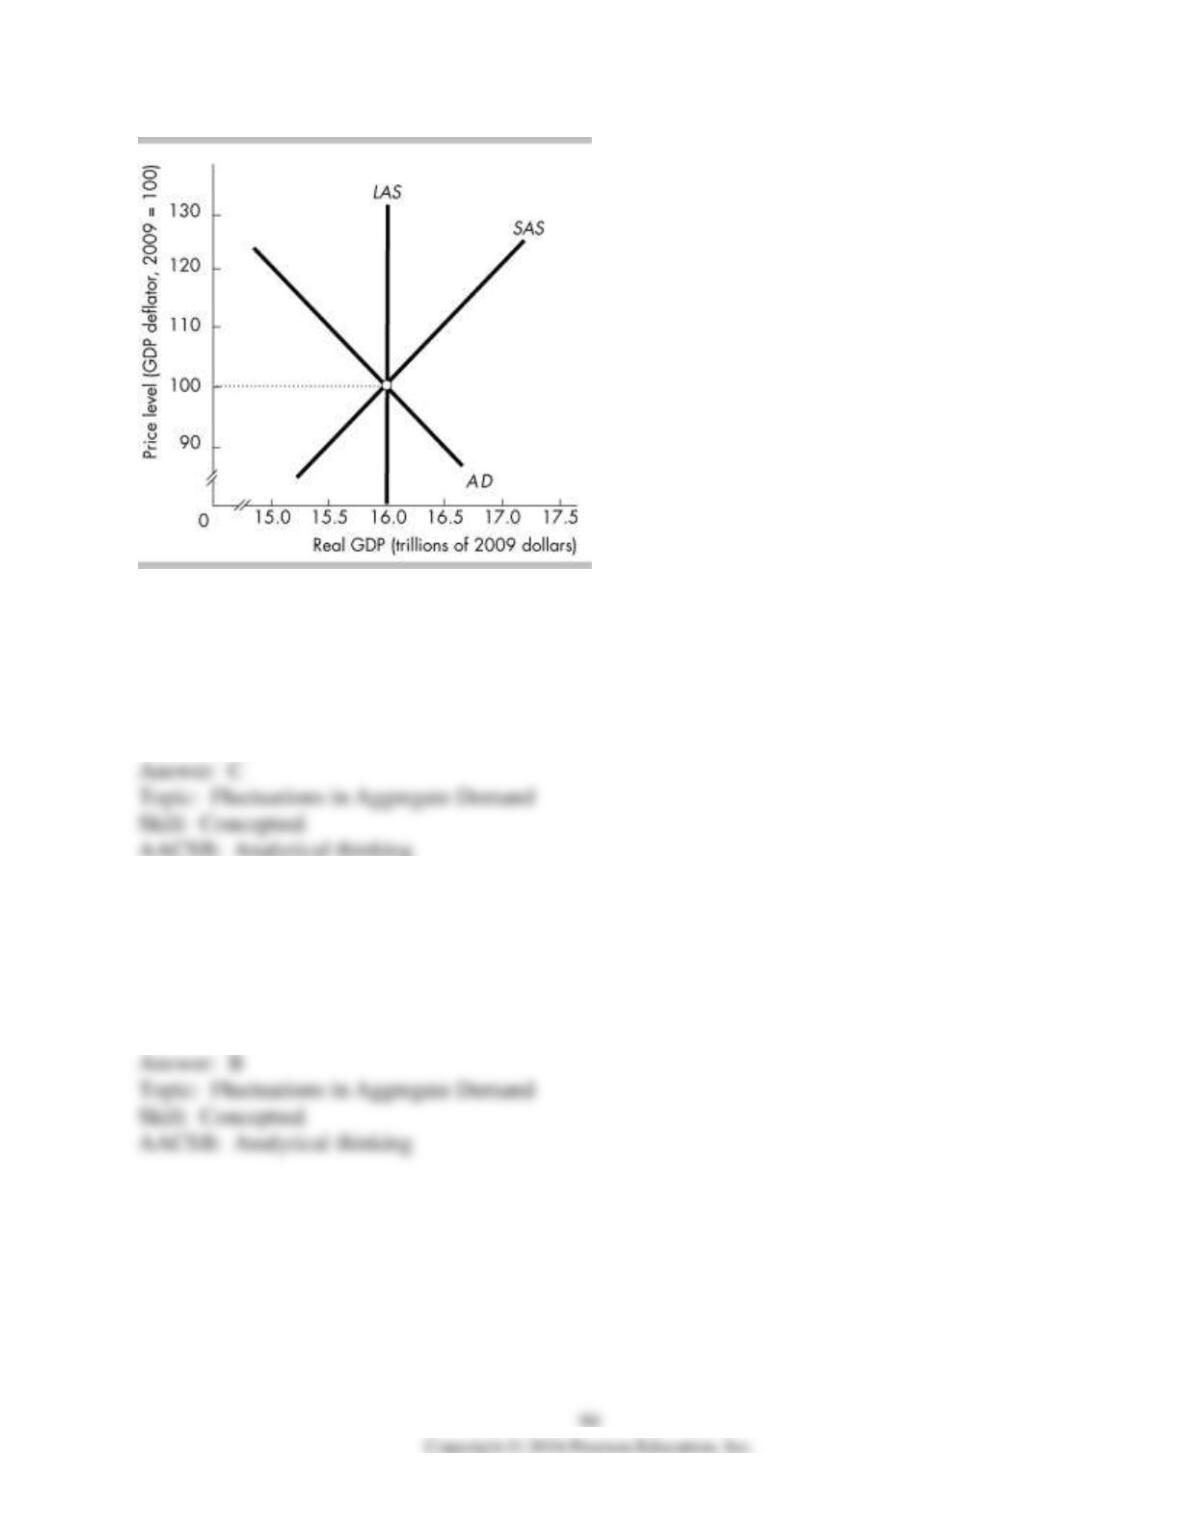
89) The figure illustrates aggregate demand and aggregate supply in Sparta. Which of the
following events will decrease Sparta’s real GDP in the short run?
A) a decrease in taxes
B) a fall in resource prices
C) a decrease in government expenditure
D) an increase in investment
90) The figure above illustrates aggregate demand and aggregate supply in Sparta. Sparta’s price
level will rise above 100 if ________.
A) government expenditure decreases
B) the quantity of money increases
C) the quantity of capital increases
D) taxes increase
91) In November, 2012, U.S. lawmakers were faced with a “fiscal cliff:” if they did not agree on
how to reduce the federal deficit, automatic tax increases and drastic cuts in government
spending would take effect. What would happen if the fiscal cliff occurred?
A) The aggregate demand curve shifts leftward, the price level falls and real GDP decreases.
B) The aggregate demand curve shifts rightward, the price level rises and real GDP increases.
C) The short run aggregate supply curve shift leftward, the price level rises and real GDP
decreases.
D) The short run aggregate supply curve shifts rightward, the price level falls and real GDP
increases.
92) In November, 2012, U.S. lawmakers were faced with a “fiscal cliff:” if they did not agree on
how to reduce the federal deficit, automatic tax increases and drastic cuts in government
spending would take effect. What would be the result if the fiscal cliff occurred?
A) a recessionary gap
B) an inflationary gap
C) stagflation
D) nothing
93) In a short-run macroeconomic equilibrium, potential GDP exceeds real GDP. If aggregate
demand does not change, then the
A) short-run aggregate supply curve will shift rightward as the money wage rate falls.
B) short-run aggregate supply curve will shift leftward as the money wage rate rises.
C) long-run aggregate supply curve will shift leftward as the money wage rate rises.
D) long-run aggregate supply curve will shift leftward as the money wage rate falls.
94) In a short-run macroeconomic equilibrium, real GDP exceeds potential GDP. If aggregate
demand does not change, then the
A) short-run aggregate supply curve will shift rightward as the money wage rate falls.
B) short-run aggregate supply curve will shift leftward as the money wage rate rises.
C) long-run aggregate supply curve will shift leftward as the money wage rate rises.
D) long-run aggregate supply curve will shift leftward as the money wage rate falls.
95) The country of Stanley is at an above-full-employment equilibrium. Which of the following
events will return Stanley to full employment?
A) an increase in government expenditures
B) a decrease in the interest rate
C) an increase in the money wage rate
D) an increase in the quantity of money
96) An economy currently has an inflationary gap. An increase in the money wage rate will
________ the inflationary gap and ________ the price level.
A) decrease; decrease
B) increase; increase
C) increase; decrease
D) decrease; increase
97) Suppose the current situation is such that the price level is 120, real GDP is $17 trillion, and
GDP along the long-run aggregate supply curve is $16.6 trillion. What will take place to restore
the long-run equilibrium?
A) The price level will fall until long-run aggregate supply increases to $17 trillion.
B) The price level will fall and money wage rates will rise until real GDP along the long-run
aggregate supply curve is $17 trillion.
C) Money wage rates will rise until real GDP reaches $16.6 trillion.
D) Aggregate demand will increase until both short-run and long-run aggregate supply equal $17
trillion.
98) The long-run aggregate supply curve is vertical at $16 trillion but the short-run aggregate
supply curve intersects the aggregate demand curve at $17 trillion. We know that
A) the economy is producing below full employment in the short run, and will adjust by hiring
more workers, thus decreasing unemployment.
B) the price level is too high. The long-run equilibrium will occur with a lower price level.
C) adjustments will occur so that the long-run aggregate supply equals $17 trillion.
D) adjustments will occur so that the short-run aggregate supply eventually intersects the
aggregate demand curve at $16 trillion.
99) In long-run macroeconomic equilibrium, the
A) real wage rate has adjusted so that the economy is on the short-run aggregate supply curve but
not on the long-run aggregate supply curve.
B) long-run aggregate supply curve has shifted in response to a money wage rate increase so that
potential GDP equals real GDP.
C) aggregate demand curve adjusts to the point where the long-run aggregate supply curve and
the short-run aggregate supply curve intersect.
D) None of the above answers is correct.
100) If the economy is in long run equilibrium and then aggregate demand increases, in the long
run the increase in aggregate demand means that the
A) price level will be higher but real GDP will be unaffected.
B) real GDP will be larger but the price level will be unaffected.
C) the price level will be higher and real GDP will be larger.
D) neither the price level nor real GDP will be unaffected.
101) In the long-run equilibrium, an increase in the quantity of capital leads to
A) an increase in the equilibrium price level and an increase in equilibrium real GDP.
B) a decrease in the equilibrium price level and an increase in equilibrium real GDP.
C) a decrease in the equilibrium price level, but no change in equilibrium real GDP.
D) no change in the equilibrium price level, but an increase in equilibrium real GDP.
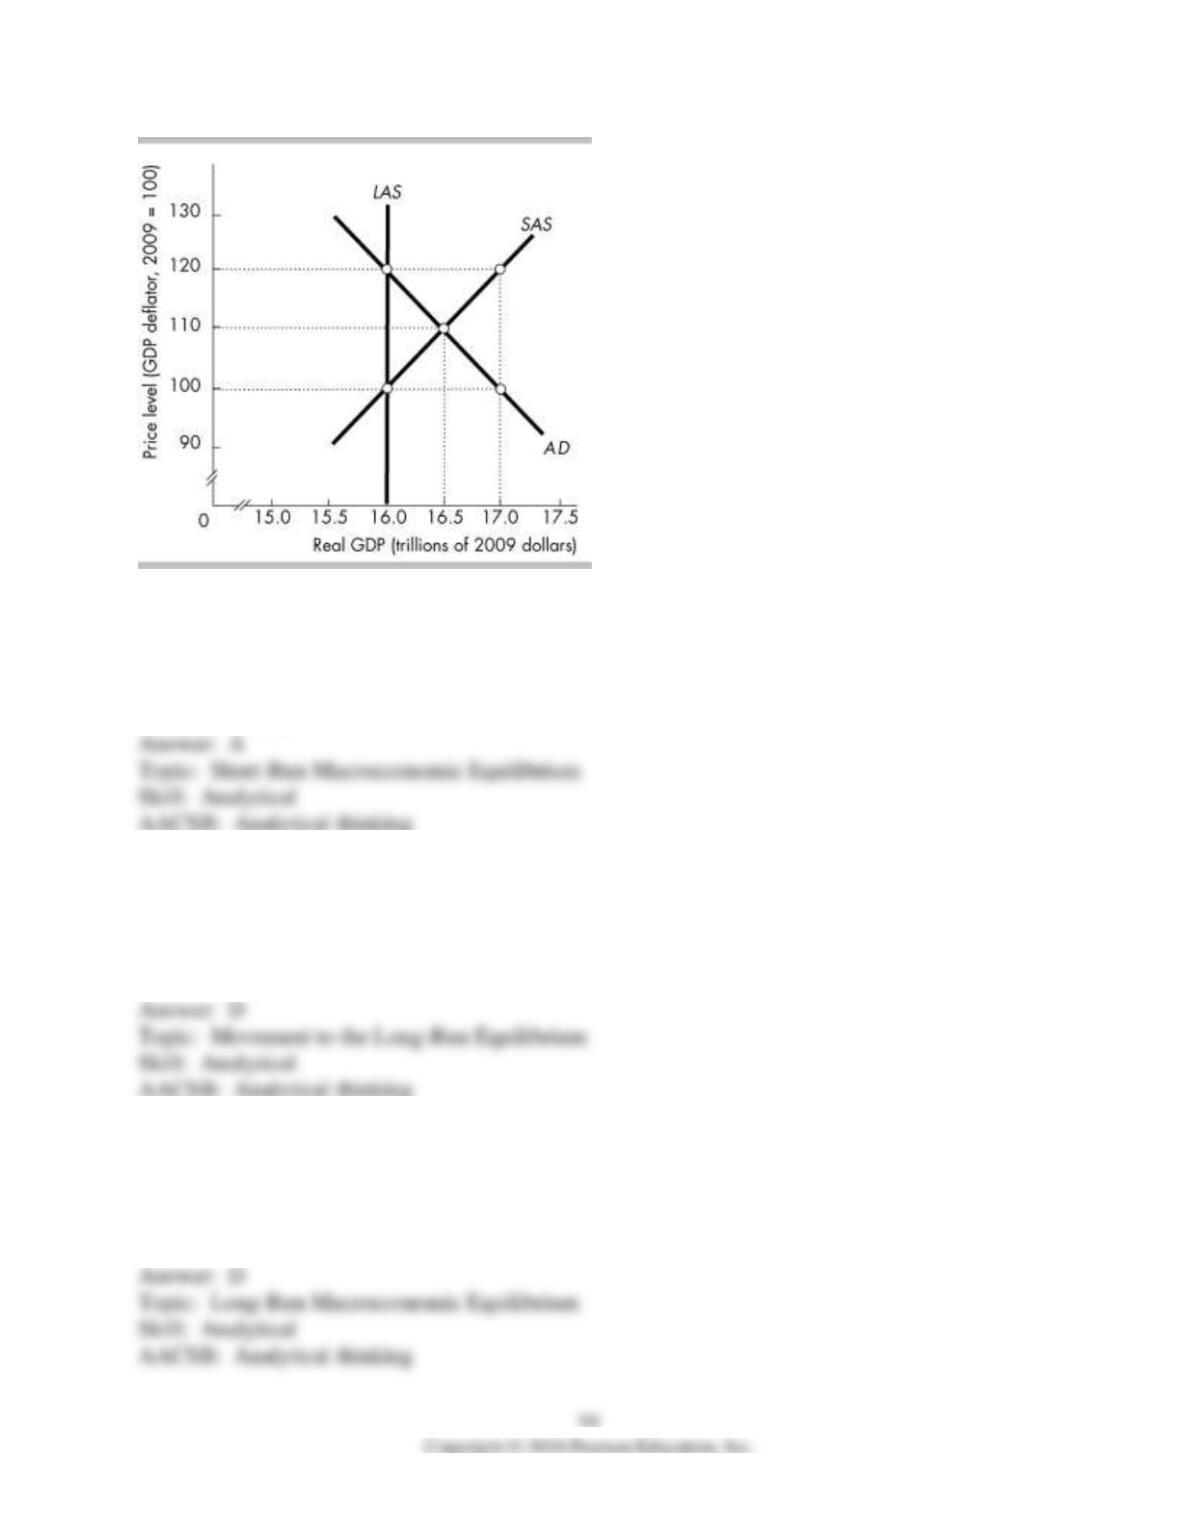
102) In the above figure, at the point where AD equals SAS
A) real GDP exceeds potential GDP.
B) potential GDP exceeds real GDP.
C) the economy is in a recession.
D) the unemployment rate is zero.
103) In the above figure, as the economy adjusts toward equilibrium, the
A) AD curve will shift rightward.
B) SAS curve will shift rightward.
C) AD curve will shift leftward.
D) SAS curve will shift leftward.
104) In the above figure, when the economy is in a long-run equilibrium, the price level will be
A) 90.
B) 100.
C) 110.
D) 120.
105) In the above figure, when the economy is in a long-run equilibrium, real GDP will be
A) $15.5 trillion.
B) $16.0 trillion.
C) $17.5 trillion.
D) $17.0 trillion.
Price
level
Aggregate
demand
(trillions of
2009 dollars)
Short-run
aggregate
supply
(trillions of
2009 dollars)
Long-run
aggregate
supply
(trillions of
2009 dollars)
140
9.0
11.5
10.0
130
9.5
11.0
10.0
120
10.0
10.5
10.0
110
10.5
10.0
10.0
100
11.0
9.5
10.0
106) The data in the above table indicate that the economy will be in a short-run macroeconomic
equilibrium at a price level
A) between 130 and 121.
B) between 119 and 111.
C) of 120.
D) of 110.
107) From the data in the above table, when the economy is in short-run equilibrium, if
aggregate demand does not change, then as time passes the
A) short-run aggregate supply curve shifts rightward.
B) short-run aggregate supply curve shifts leftward.
C) long-run aggregate supply curve shifts rightward.
D) long-run aggregate supply curve shifts leftward.
Price level
Aggregate demand
(trillions of 2009
dollars)
Short-run aggregate
supply (trillions of
2009 dollars)
Long-run aggregate
supply (trillions of
2009 dollars)
100
11
7
10
110
10
8
10
120
9
9
10
130
8
10
10
140
7
11
10
108) Based on the data in the table above, the economy will be in short-run equilibrium at a price
level of
A) 90.
B) 110.
C) 100.
D) 120.
109) Based on the data in the table above, at the short-run equilibrium
A) the unemployment rate is less than the natural unemployment rate.
B) the unemployment rate is greater than the natural unemployment rate.
C) the money wage rate will rise in the long run.
D) the economy is at full employment.
110) Based on the data in the table above, in the adjustment towards the long-run equilibrium
A) money wage rates will rise.
B) the aggregate demand curve will shift leftward.
C) the short-run aggregate supply curve will shift leftward.
D) the short-run aggregate supply curve will shift rightward.
Price
level
Aggregate
demand
(trillions of
2009 dollars)
Short-run
aggregate
supply
(trillions of
2009 dollars)
Long-run
aggregate
supply
(trillions of
2009 dollars)
140
4
8
7
130
5
7
7
120
6
6
7
110
7
5
7
100
8
4
7
111) The data in the above table show that the economy will be in a short-run macroeconomic
equilibrium at a price level of
A) 90.
B) 110.
C) 100.
D) 120.
112) The data in the above table show that when the price level is 120
A) the unemployment rate is below its natural rate.
B) the unemployment rate is above its natural rate.
C) money wages rates will rise in the future.
D) the long-run aggregate supply curve will shift leftward in the future.
113) The data in the above table show that when the price level is 120, the economy
A) is in a long-run macroeconomic equilibrium.
B) has an inflationary gap.
C) has a recessionary gap.
D) will have falling money wage rates sometime in the future.
114) The data in the above table show that when the price level is 120, if aggregate demand does
not change then the
A) money wage rate will rise in the future.
B) money wage rate will fall in the future.
C) short-run aggregate supply curve will shift leftward.
D) long-run aggregate supply curve will shift leftward.
115) The data in the above table show that when the price level is 120, if aggregate demand does
not change then the
A) short-run aggregate supply curve will shift rightward.
B) short-run aggregate supply curve will shift leftward.
C) long-run aggregate supply curve will shift rightward.
D) long-run aggregate supply curve will shift leftward.
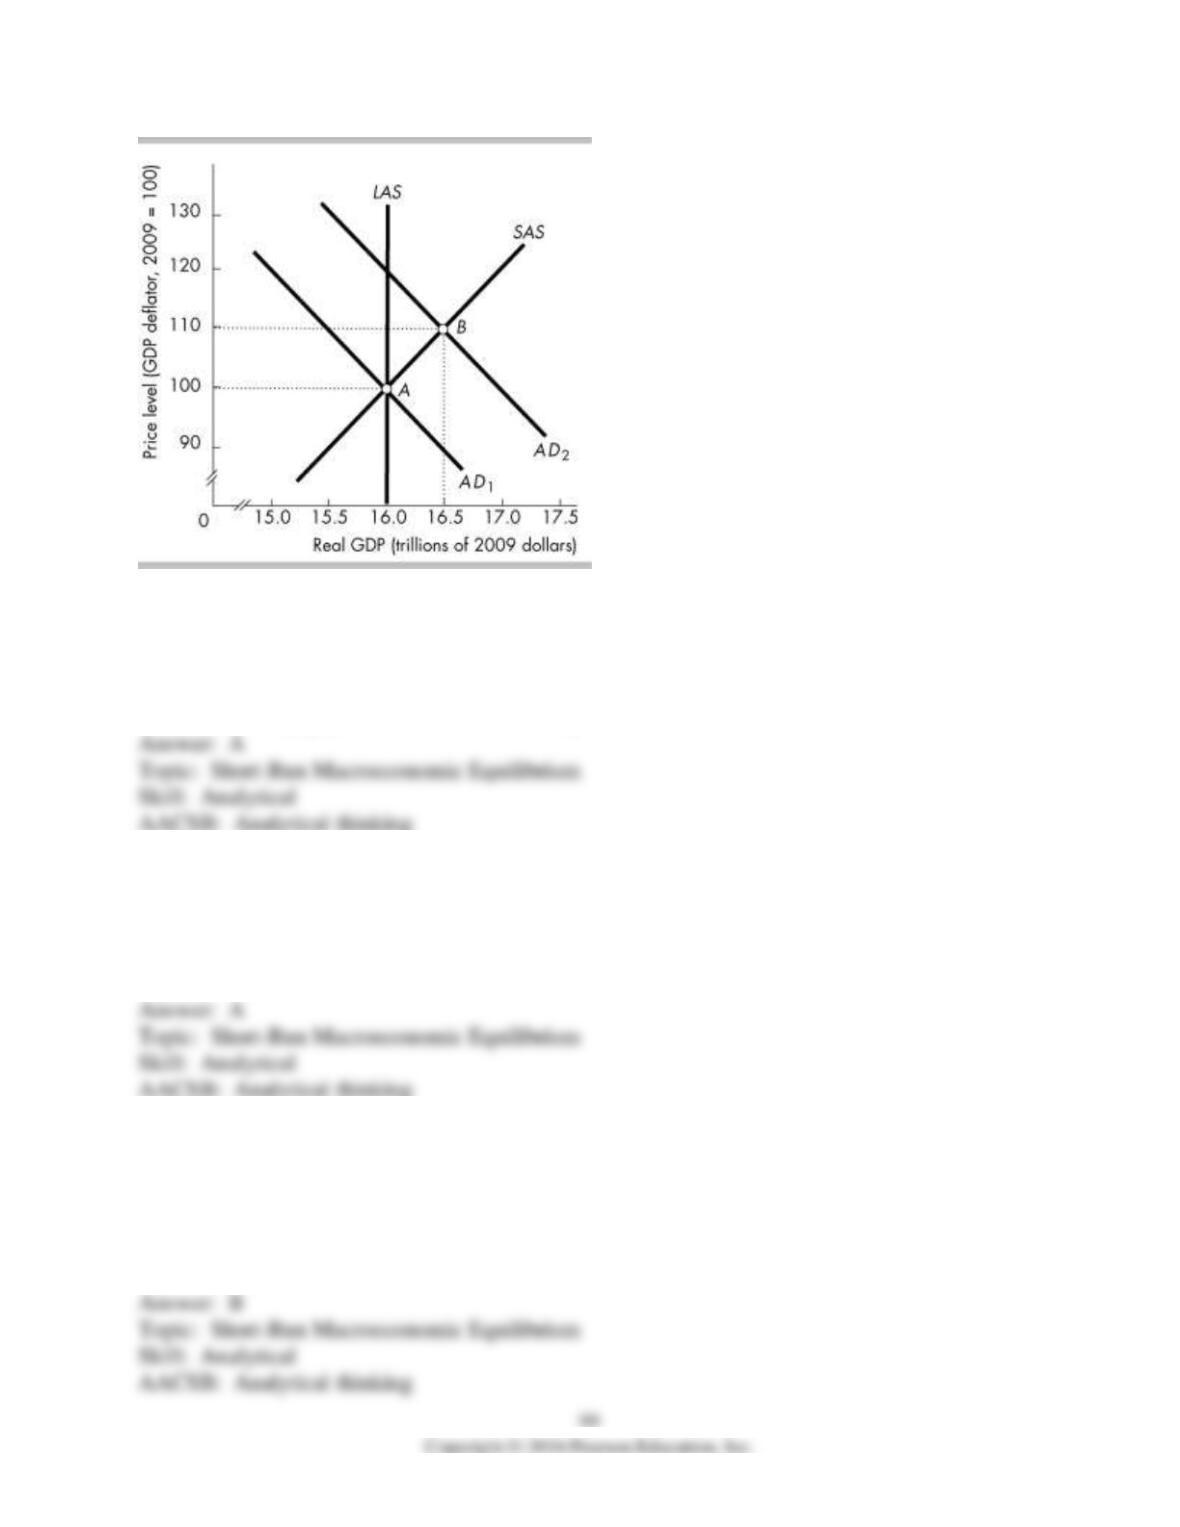
116) In the above figure, point B depicts
A) an inflationary gap with real GDP in excess of potential GDP.
B) an inflationary gap with real GDP less than potential GDP.
C) a recessionary gap with real GDP in excess of potential GDP.
D) a recessionary gap with real GDP less than potential GDP.
117) In the above figure, real GDP at full employment is
A) $16 trillion.
B) $16.5 trillion.
C) more than $16 and less than $16.5 trillion.
D) None of the above answers is correct.
118) In the above figure, the aggregate demand curve is AD2, so the short-run equilibrium level
of real GDP is
A) $16 trillion.
B) $16.5 trillion.
C) more than $16 and less than $16.5 trillion.
D) None of the above answers is correct.
119) In the above figure, the aggregate demand curve is AD2, so the long-run equilibrium level
of real GDP is
A) $16 trillion.
B) $16.5 trillion.
C) more than $16 and less than $16.5 trillion.
D) None of the above answers is correct.
120) In the above figure, the shift from AD1 to AD2 might have been the result of
A) an increase in government expenditure.
B) a decrease in taxes.
C) an increase in the quantity of money.
D) All of the above answers are correct.
121) Higher resource costs shift the
A) long-run aggregate supply curve leftward, decreasing real GDP and increasing potential GDP.
B) short-run aggregate supply curve leftward, raising the price level and decreasing potential
GDP.
C) short-run aggregate supply curve leftward, raising the price level and decreasing real GDP so
it is less than potential GDP.
D) short-run aggregate supply curve rightward, raising the price level and decreasing real GDP
so it is less than potential GDP.
122) Suppose that the economy begins at a long-run equilibrium. Which of the following raises
the price level and decrease real GDP in the short run?
A) a decrease in the quantity of money
B) an increase in the price of oil that decreases aggregate supply
C) an increase in the stock of capital that increases aggregate supply
D) an increase in government expenditures