Positive externalities
BLOOM’S: Application
165. Refer to Figure 10-11. Taking only private value and private cost into account, total surplus at the market
equilibrium amounts to
a.
$3,850.
b.
$4,320.
c.
$4,980.
d.
$5,530.
ECON.MANK.097 – Examine the effects of an externality on a market.
BLOOM’S: Application
Table 10-4
Quantity
Private Value
Private Cost
External Cost
1
$46
$21
$6
2
$44
$24
$6
3
$42
$27
$6
4
$40
$30
$6
5
$38
$33
$6
6
$36
$36
$6
7
$34
$39
$6
166. Refer to Table 10–4. The table represents a market in which
a.
there is no externality.
b.
there is a positive externality.
c.
there is a negative externality.
d.
The answer cannot be determined from inspection of the table.
ECON.MANK.215 – Given a scenario, identify if an externality is present.
Negative externalities
BLOOM’S: Application
167. Refer to Table 10–4. The social cost of the 2nd unit of output that is produced is
a.
$7.
b.
$23.
c.
$30.
d.
$38.
168. Refer to Table 10–4. The last unit of output for which private value exceeds social cost is the
a.
2nd unit.
b.
3rd unit.
c.
4th unit.
d.
5th unit.
169. Refer to Table 10–4. The market equilibrium quantity of output is
a.
3 units.
b.
4 units.
c.
5 units.
d.
6 units.
170. Refer to Table 10–4. Take into account private and external costs and assume the quantity of output is always a
whole number (that is, fractional units of output are not possible). The maximum total surplus that can be achieved in this
market is
a.
$29.
b.
$35.
c.
$40.
d.
$46.
171. Refer to Table 10–4. Taking into account private and external costs, total surplus in the market equilibrium amounts
to
a.
$28.
b.
$39.
c.
$45.
d.
$51.
172. Refer to Table 10–4. Which of the following policies would move the market from the market equilibrium to the
socially optimal equilibrium?
a.
a tax of $4 per unit of output
b.
a subsidy of $4 per unit of output
c.
a tax of $6 per unit of output
d.
a subsidy of $6 per unit of output
Figure 10–12
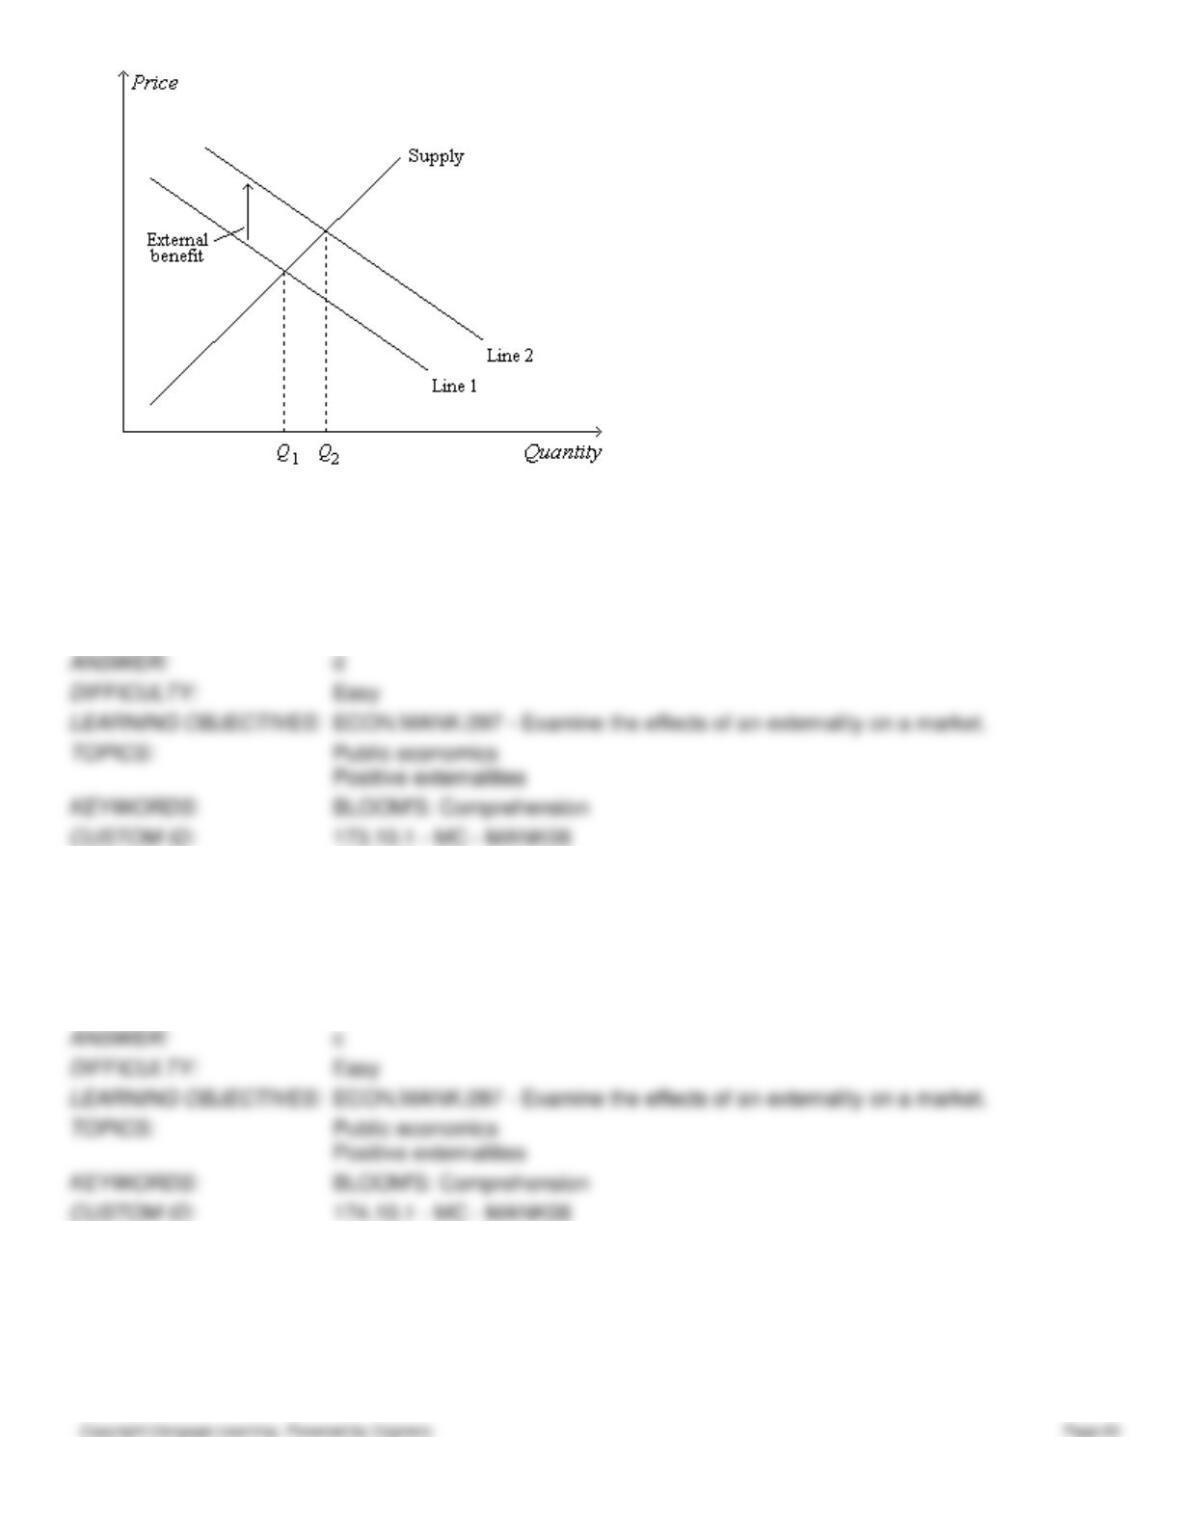
173. Refer to Figure 10–12. Which of the following is an appropriate label for Line 1?
a.
social cost
b.
social value
c.
private cost
d.
private value
174. Refer to Figure 10–12. Which of the following is an appropriate label for Line 1?
a.
social cost minus social value
b.
social value minus private cost
c.
demand
d.
private cost
175. Refer to Figure 10–12. Which of the following is an appropriate label for Line 2?
a.
social cost
b.
social value
c.
private cost
d.
private value
176. Refer to Figure 10–12. Which of the following is an appropriate label for Line 2?
a.
social cost minus social value
b.
social value minus private cost
c.
demand
d.
private value plus external benefit
177. Refer to Figure 10–12. An alternative label for the line labeled “Supply” would be
a.
private value.
b.
external value.
c.
private cost.
d.
external cost.
178. Refer to Figure 10–12. An alternative label for the quantity would be
a.
.
b.
.
c.
.
d.
.
179. Refer to Figure 10–12. An alternative label for the quantity would be
a.
.
b.
.
c.
.
d.
.
180. Refer to Figure 10–12. The graph, as drawn, could apply to the market for
a.
automobiles.
b.
aluminum.
c.
industrial robots.
d.
All of the above are correct.
181. Refer to Figure 10–12. The graph, as drawn, could apply to the market for
a.
fire extinguishers.
b.
immunizations such as flu shots.
c.
education.
d.
All of the above are correct.
182. Refer to Figure 10–12. Suppose, on the figure, Q represents the quantity of education and P represents the price of
education. Then the quantity represents
a.
an inefficiency.
b.
the extent of the negative externality that pertains to the market for education.
c.
the amount of the tax that would be required to correct the negative externality that pertains to the market for
education.
d.
the amount of the subsidy that would be required to correct the positive externality that pertains to the market
for education.
183. The externality associated with technology spillovers
a.
cannot be internalized by government.
b.
is a negative externality.
c.
can be internalized, potentially, through taxation of firms that are responsible for technology spillovers.
d.
can be internalized, potentially, through patent protection.
184. Before the flu season begins, Jeremy gets a flu shot. As a result, Jeremy and several of his friends and relatives avoid
the flu for the entire flu season. It would make sense to argue that
a.
flu shots provide a positive externality, and that flu shots should be subsidized.
b.
if flu shots are not subsidized, then the number of people getting flu shots will be smaller than the socially
optimal number.
c.
the externality generated by flu shots is more like the externality generated by education than the externality
generated by pollution.
d.
All of the above are correct.
185. Assuming education results in a positive externality, which of the following statements is correct?
a.
The social cost of producing education exceeds the private cost of producing education.
b.
The positive externality can be depicted on a graph by the vertical distance between the supply curve and the
social-cost curve.
c.
The socially optimal quantity of education will exceed the market equilibrium quantity of education.
d.
All of the above are correct.
186. Assume the production of a good causes a negative externality. In the market equilibrium, the marginal consumer
values the good at
a.
less than the social cost of producing it.
b.
less than the private cost of producing it.
c.
more than the social cost of producing it.
d.
more than the private cost of producing it.
187. If the social value of producing a good is always higher than the private value of producing it, then there is a
a.
negative externality associated with the production of the good, and the market equilibrium quantity of the
good is less than the socially optimal quantity.
b.
negative externality associated with the production of the good, and the socially optimal quantity of the good
is less than the market equilibrium quantity.
c.
positive externality associated with the production of the good, and the market equilibrium quantity of the
good is less than the socially optimal quantity.
d.
positive externality associated with the production of the good, and the socially optimal quantity of the good is
less than the market equilibrium quantity.
Scenario 10-1
The demand curve for gasoline slopes downward and the supply curve for gasoline slopes upward. The production of the
1,000th gallon of gasoline entails the following:
• a private cost of $3.10;
• a social cost of $3.55;
• a value to consumers of $3.70.
188. Refer to Scenario 10-1. From the given information, it is apparent that
a.
the production of gasoline involves a negative externality, so the market will produce a smaller quantity of
gasoline than is socially desirable.
b.
the production of gasoline involves a negative externality, so the market will produce a larger quantity of
gasoline than is socially desirable.
c.
the production of gasoline involves a positive externality, so the market will produce a smaller quantity of
gasoline than is socially desirable.
d.
the production of gasoline involves a positive externality, so the market will produce a larger quantity of
gasoline than is socially desirable.
189. Refer to Scenario 10-1. The production of the 1,000th gallon of gasoline entails an
a.
external cost of $0.15.
b.
external cost of $0.45.
c.
external benefit of $0.15.
d.
external benefit of $0.45.
190. Refer to Scenario 10-1. Let Q represent the number of gallons of gasoline and let P represent the price of a gallon of
gasoline. Which of the following statements is correct?
a.
One point on the social-cost curve is (Q = 1,000, P = $0.45).
b.
One point on the supply curve is (Q = 1,000, P = $3.10).
c.
One point on the demand curve is (Q = 1,000, P = $3.55).
d.
The socially optimal quantity of gasoline is less than 1,000 gallons.
191. Refer to Scenario 10-1. Let QMARKET represent the equilibrium quantity of gasoline, and let QOPTIMUM represent
the socially optimal quantity of gasoline. Which of the following inequalities is correct?
a.
1,000 < QOPTIMUM < QMARKET
b.
QOPTIMUM < 1,000 < QMARKET
c.
QMARKET < 1,000 < QOPTIMUM
d.
QOPTIMUM < QMARKET < 1,000
192. Refer to Scenario 10-1. Suppose the equilibrium quantity of gasoline is 1,150 gallons; that is, QMARKET = 1,150.
Then the equilibrium price of a gallon could be
a.
$2.80.
b.
$3.00.
c.
$3.30.
d.
$3.80.
193. Refer to Scenario 10-1. Suppose the dollar amount of the externality, per gallon of gasoline, is constant, regardless
of how much gasoline is produced. Then the externality could be internalized if producers of gasoline were
a.
provided a subsidy of $0.30 per gallon of gasoline sold.
b.
provided a subsidy of $0.45 per gallon of gasoline sold.
c.
required to pay a tax of $0.45 per gallon of gasoline sold.
d.
required to pay a tax of $0.30 per gallon of gasoline sold.
194. Education yields positive externalities. For example, a more educated population
a.
may increase the pace of technological advances, leading to higher productivity and wages for everyone.
b.
leads to more informed voters, resulting in better government for everyone.
c.
tends to result in lower crime rates.
d.
All of the above are correct.
195. Education yields positive externalities. For example,
a.
colleges and universities have benefited, in recent years, from increases in tuition paid by students.
b.
as a result of earning a college degree, a person becomes a more productive worker and benefits by earning
higher wages.
c.
a more educated population tends to result in lower crime rates.
d.
All of the above are correct.
196. Education is heavily subsidized through public schools and government scholarships. This subsidization of education
reflects the fact that
a.
a negative externality requires a subsidy to move the market equilibrium closer to the social optimum.
b.
the social cost of education exceeds the private cost of education.
c.
the social value of education exceeds the private value of education.
d.
the market-equilibrium quantity of education exceeds the optimal quantity of education.
197. Suppose the market-equilibrium quantity of good x is 5,000 units and the socially-optimal quantity of good x is 4,000
units. Then
a.
the production of good x imposes external costs on society.
b.
the private value of good x exceeds the private cost of good x when 5,000 units are produced.
c.
the private cost of good x exceeds the private value of good x when 5,000 units are produced.
d.
the social cost of good x exceeds the private value of good x when 4,000 units are produced.
198. Suppose the socially-optimal quantity of good x is 2,500 units and the market-equilibrium quantity of good x is 3,000
units. When 2,500 units of good x are produced, the
a.
external cost of good x exceeds the private value of good x.
b.
external cost of good x equals the private value of good x.
c.
social cost of good x exceeds the private value of good x.
d.
social cost of good x equals the private value of good x.
Figure 10-20.
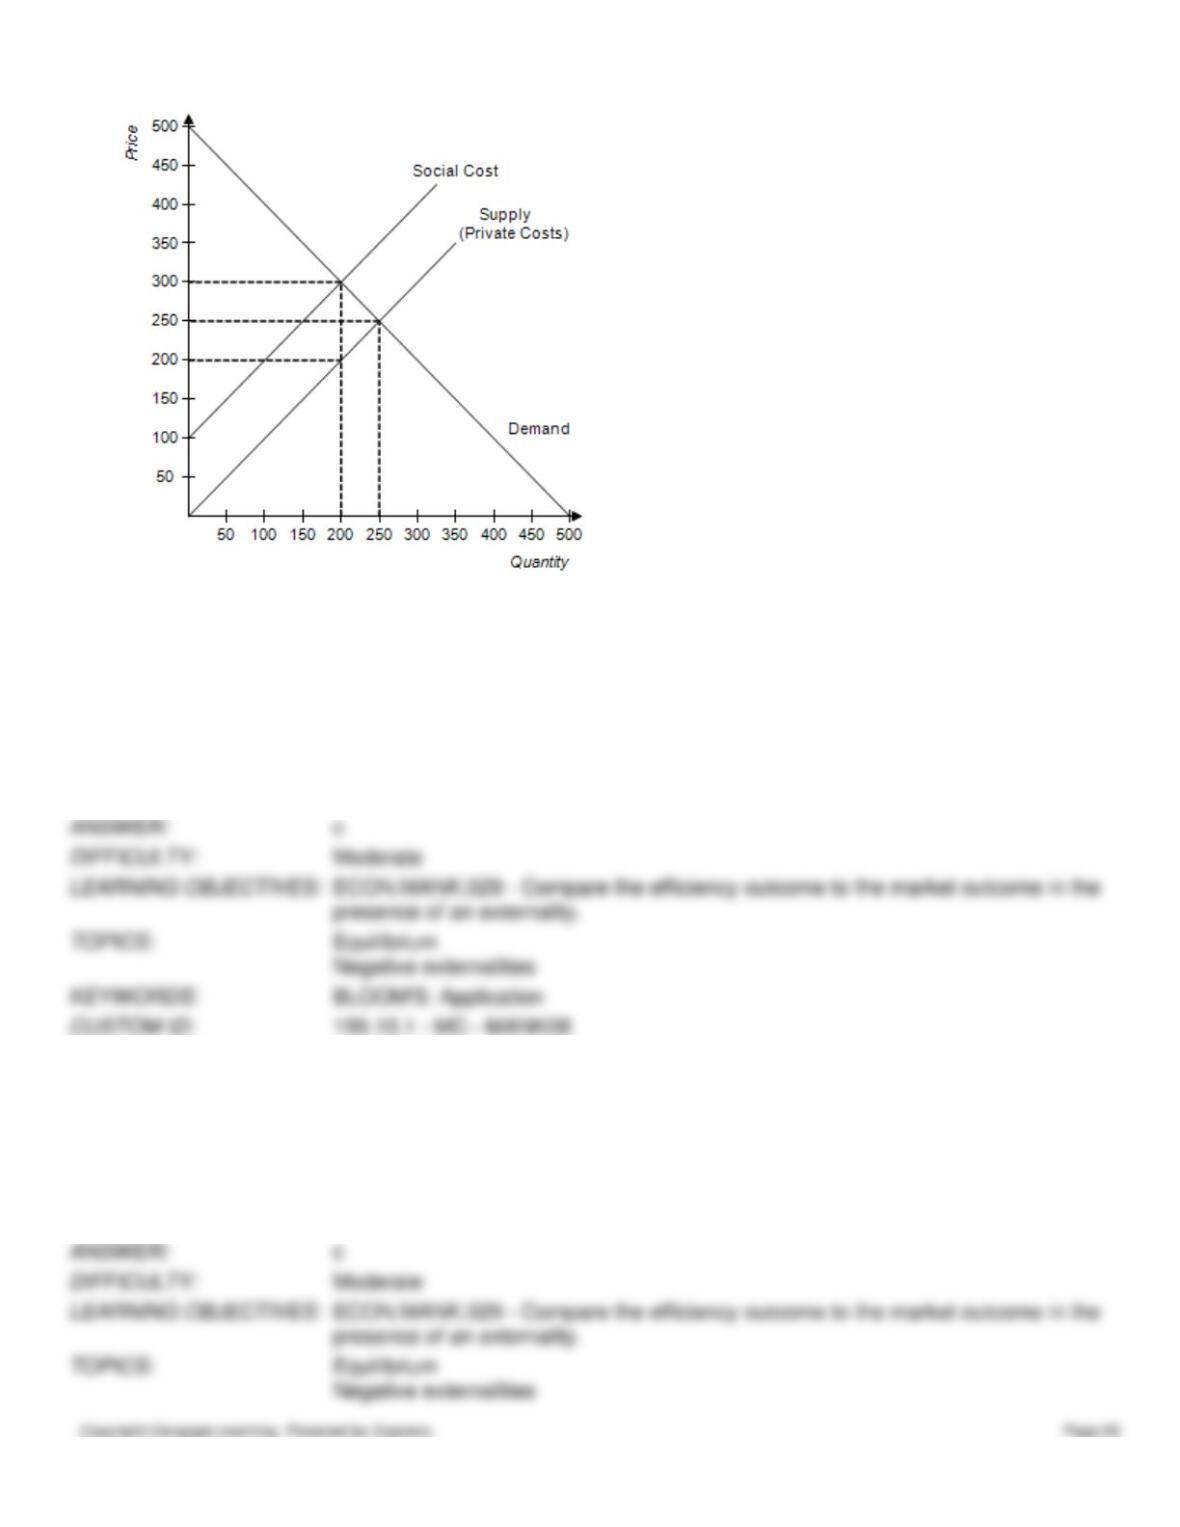
199. Refer to Figure 10–20. The graph depicts the market for fertilizer. Without any government regulation, how much
fertilizer will be produced?
a.
100 units
b.
200 units
c.
250 units
d.
300 units
200. Refer to Figure 10–20. The graph depicts the market for fertilizer. Without any government regulation, what is the
equilibrium price of fertilizer?
a.
$100
b.
$200
c.
$250
d.
$300
201. Refer to Figure 10–20. The graph depicts the market for fertilizer. What is the socially optimal price of fertilizer?
a.
$100
b.
$200
c.
$250
d.
$300
202. Refer to Figure 10-20. The graph depicts the market for fertilizer. What is the socially optimal quantity of fertilizer?
a.
100 units
b.
200 units
c.
250 units
d.
300 units
203. Refer to Figure 10-20. Without government intervention,
a.
the equilibrium quantity is less than the socially optimal quantity.
b.
the equilibrium quantity is larger than the socially optimal quantity.
c.
the equilibrium quantity equals the socially optimal quantity.
d.
there is no clear relationship between the equilibrium quantity and socially optimal quantity.
204. A rain barrel is a container that captures and stores rainwater for landscape and garden use during dry periods. As a
result, rain barrels benefit the community through water conservation. If homeowners do not consider this external
benefit of rain barrels, then
a.
the socially optimal quantity of rain barrels will be larger than the equilibrium quantity of rain barrels.
b.
the socially optimal quantity of rain barrels will be smaller than the equilibrium quantity of rain barrels.
c.
the socially optimal price of rain barrels will be lower than the equilibrium price of rain barrels.
d.
the market for rain barrels would benefit from a tax on rain barrels.