13) In the United States in 2012, the CDC estimated that the total number of people with diabetes (both
diagnosed and undiagnosed cases) was lowest for people in the age range of ________, and the
percentage of people with diabetes was lowest for people in the age range of ________.
A) 20 – 44; 20 – 44
B) 45 – 64; 65 and older
C) 65 and older; 65 and older
D) 65 and older; 20 – 44
14) In the United States in 2012, the number of new, diagnosed diabetes cases was lowest for people in
the age range of ________, and the rate of new diabetes cases per 1,000 people was lowest for people in
the age range of ________.
A) 20 – 44; 20 – 44
B) 45 – 64; 65 and older
C) 45 – 64; 45 – 64
D) 65 and older; 20 – 44
15) In the market for factors of production, households earn income by supplying factors of production
to firms.
16) One example of human capital is the amount of savings that you have.
17) Human capital refers to the accumulated skills and training that workers possess.
18) Physical capital refers to stocks and bonds.
19) What is technology and what factors does it depend on?
20) What is the difference between physical capital and human capital?
21) What is the difference between accounting profit and economic profit?
22) What is a household? How do households interact with firms in a market?
1.6 Appendix: Using Graphs and Formulas
1) If a graph has a line that shows the quantity of flat-screen televisions sold in the last five years, it is
known as
A) a pie chart.
B) a time-series graph.
C) a demand curve for outsourcing.
D) a supply curve of outsourcing.
2) Two-dimensional graphs have a horizontal and a vertical axis and are used in economics to illustrate
A) relationships between two economic variables.
B) one variable.
C) a flow chart.
D) a pie chart.
3) How can the influence of a third variable be shown on a two-dimensional graph?
A) by allowing the relationship to be nonlinear
B) by allowing the position of the relationship line or curve to shift on the graph
C) by drawing a third axis coming out of the two axes
D) by super-imposing the third variable on the two-dimensional graph
4) Which of the following statements is true?
A) An inverse relationship has a positive slope value.
B) A direct relationship has a negative slope value.
C) A curved line has slope values that change at every point.
D) A straight line has a slope of one.
5) The relationship between sales and revenue is
A) an inverse relationship.
B) a direct relationship.
C) a negative relationship.
D) independent.
6) Suppose when the price of hybrid automobiles rises, consumers buy fewer hybrid automobiles. This
implies that
A) there is a positive relationship between hybrid automobile prices and quantities purchased by
consumers.
B) there is a negative relationship between hybrid automobile prices and quantities purchased by
consumers.
C) there is a direct relationship between hybrid automobile prices and quantities purchased by
consumers.
D) there is a one-to-one relationship between hybrid automobile prices and quantities purchased by
consumers.
7) In 2015, Smileytown consumed 50,000 tubes of toothpaste. In 2016, toothpaste consumption rose to
62,000 tubes. Calculate the percentage change in toothpaste consumption.
A) 12%
B) 16.42%
C) 19.35%
D) 24%
8) In 2015, Peelville consumed 30,000 bananas. In 2016, banana consumption rose to 35,000. Calculate
the percentage change in banana consumption.
A) 11.66%
B) 14.28%
C) 16.67%
D) 22.25%
9) If a straight line passes through the point x = 12 and y = 4 and also through the point x = 4 and y = 8,
the slope of this line is
A) negative 8 divided by 4.
B) seven tenths.
C) negative one half.
D) one -and one half.
10) If a straight line passes through the point x = 8 and y = 4 and also through the point x = 12 and y = 6,
the slope of this line is
A) negative 4 divided by 2.
B) two.
C) negative one half.
D) one half.
11) If the price of milk was $1.25 a gallon and it is now $2.25 a gallon, what is the percentage change in
price?
A) 4.4 percent
B) 8 percent
C) 44 percent
D) 80 percent
12) If the price of pineapple juice was $4.50 a gallon and it is now $5.75 a gallon, what is the percentage
change in price?
A) 7.8 percent
B) 12.5 percent
C) 27.7 percent
D) 57.5 percent
13) At a recent company meeting, Geraldine Erwin, sales manager of Dastoria, a flavored-beverage
producer announced, “We have increased our sales by 8 percent in just six months.” Suppose six months
ago, its sales amounted to $452,000, what is the value of its sales today?
A) $36,160
B) $415,840
C) $488,160
D) $565,000
59
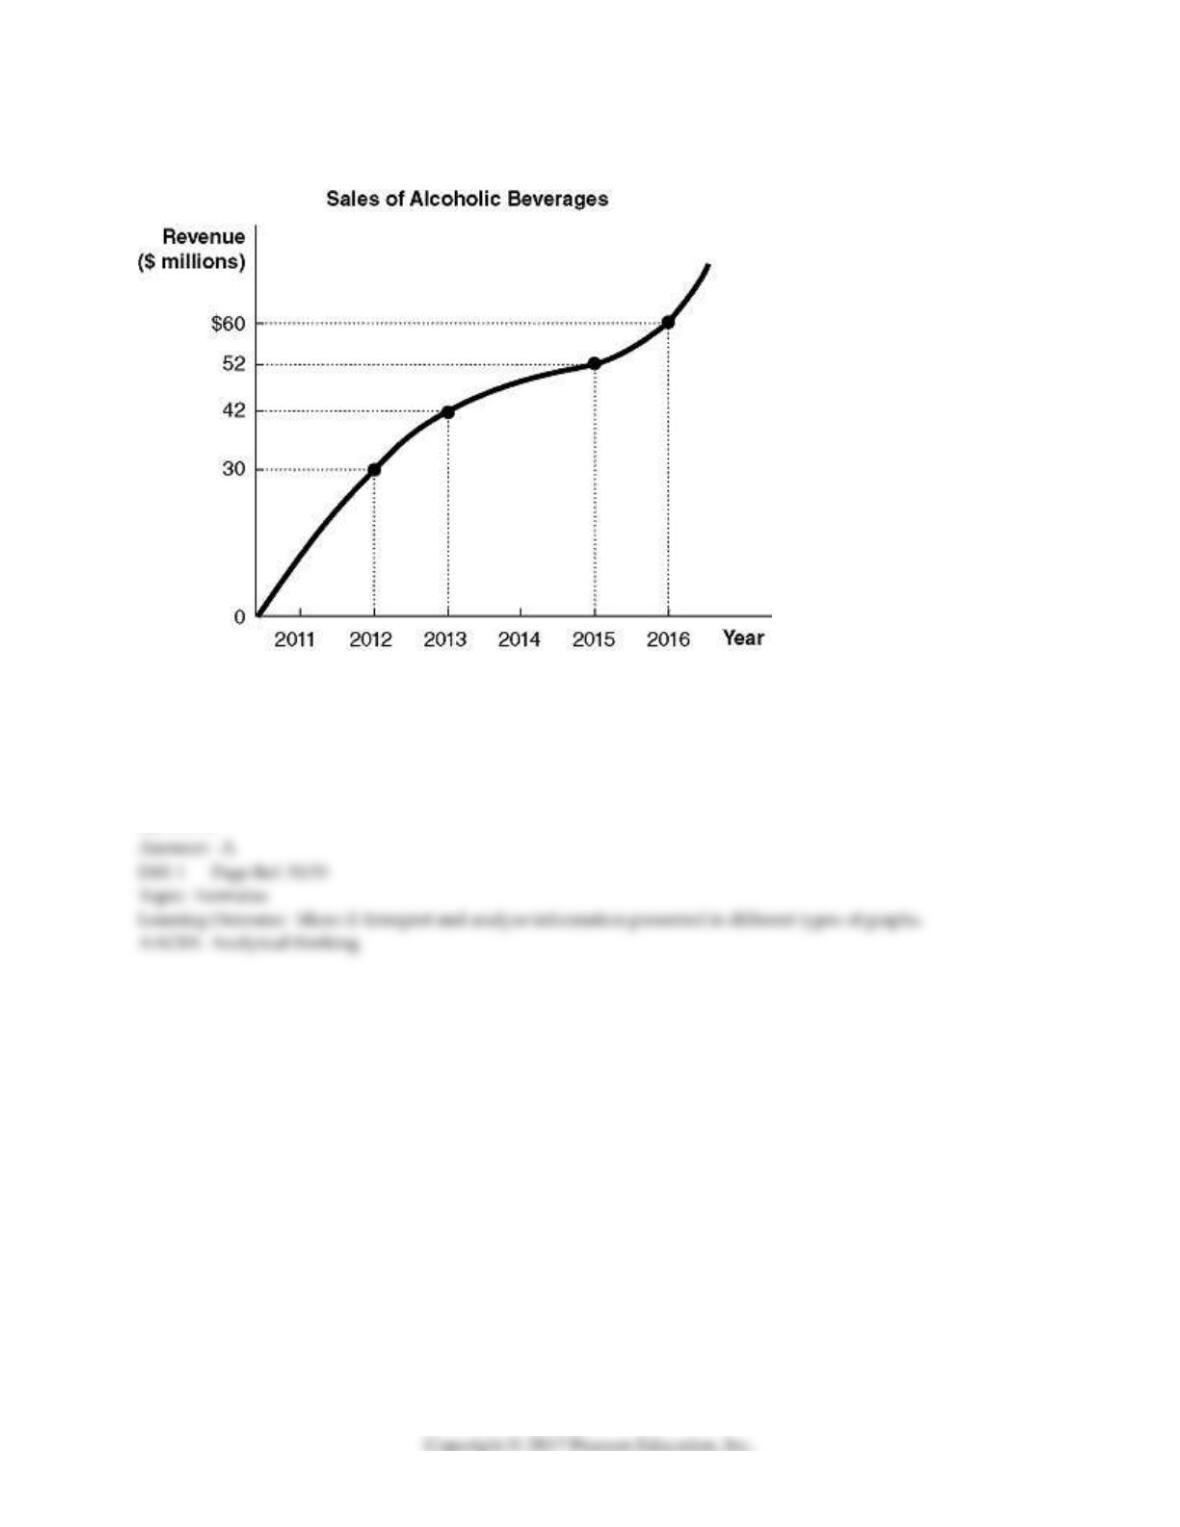
Figure 1-1
14) Refer to Figure 1-1. Using the information in the figure above, calculate the percentage change in
sales of alcoholic beverages between 2013 and 2015.
A) 23.8%
B) 40%
C) 42.9%
D) 73.3%
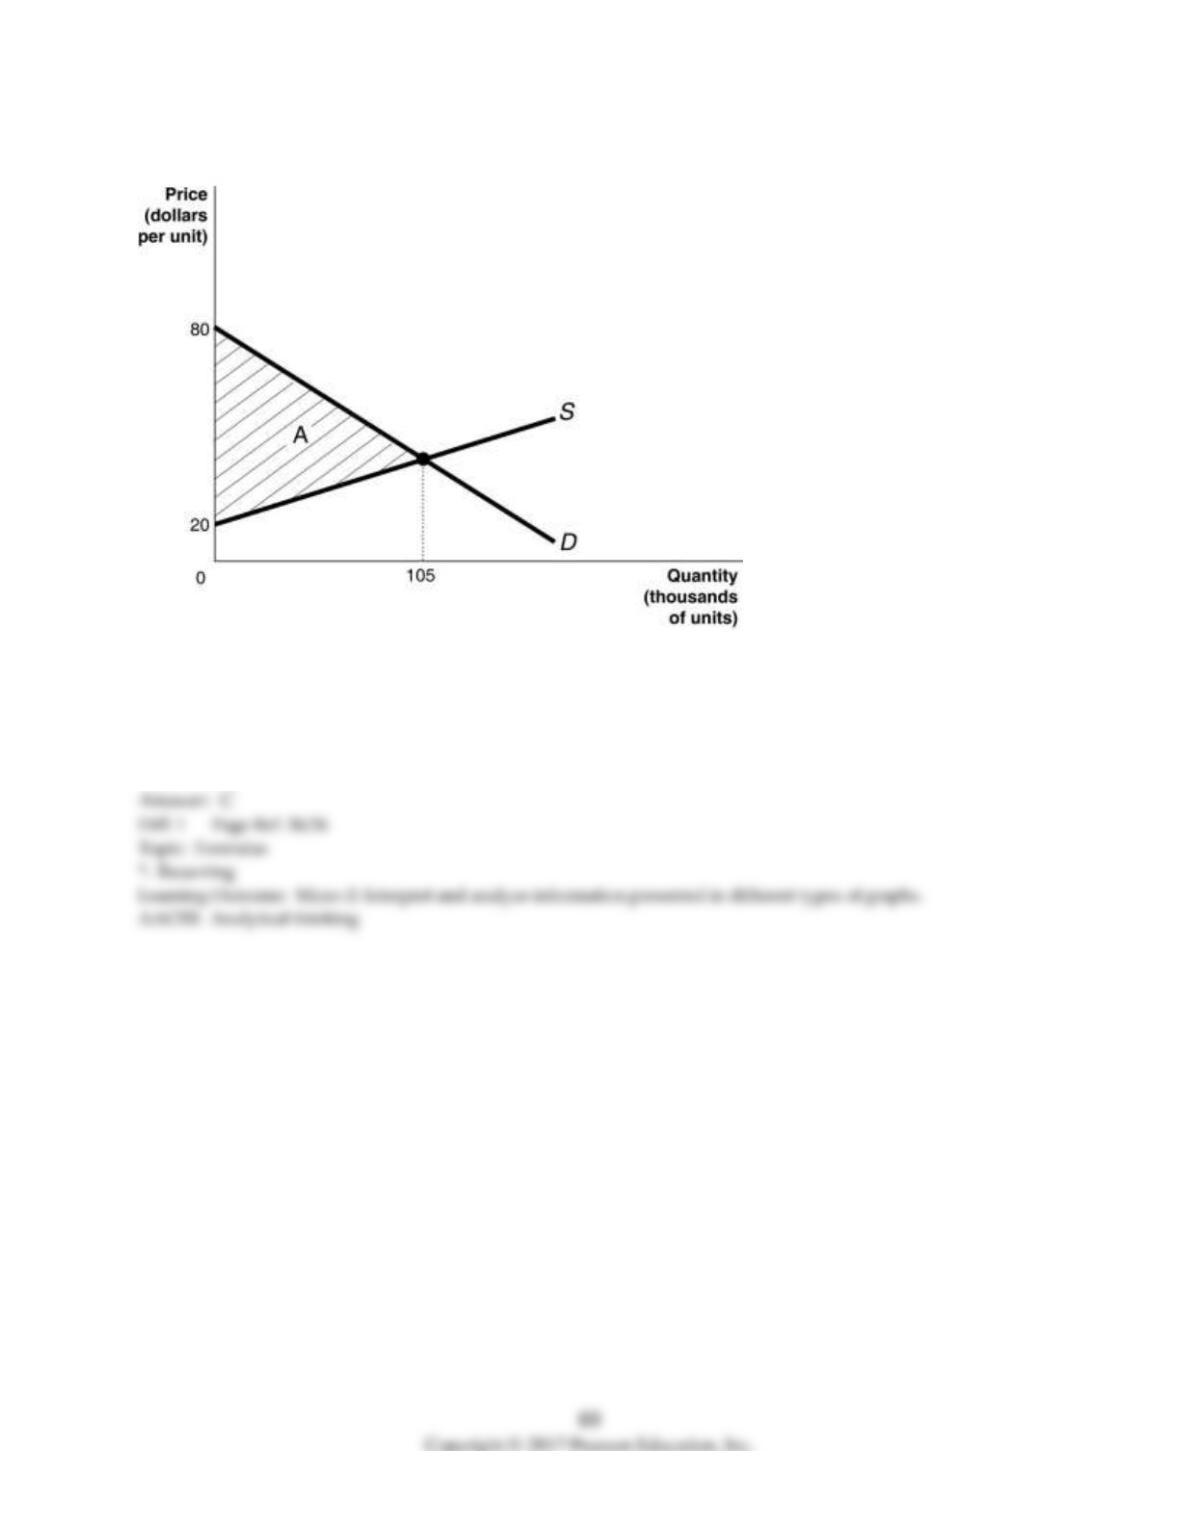
Figure 1-2
15) Refer to Figure 1-2. Calculate the area of the triangle A.
A) $8.4 million
B) $6.3 million
C) $3.15 million
D) $2.1 million
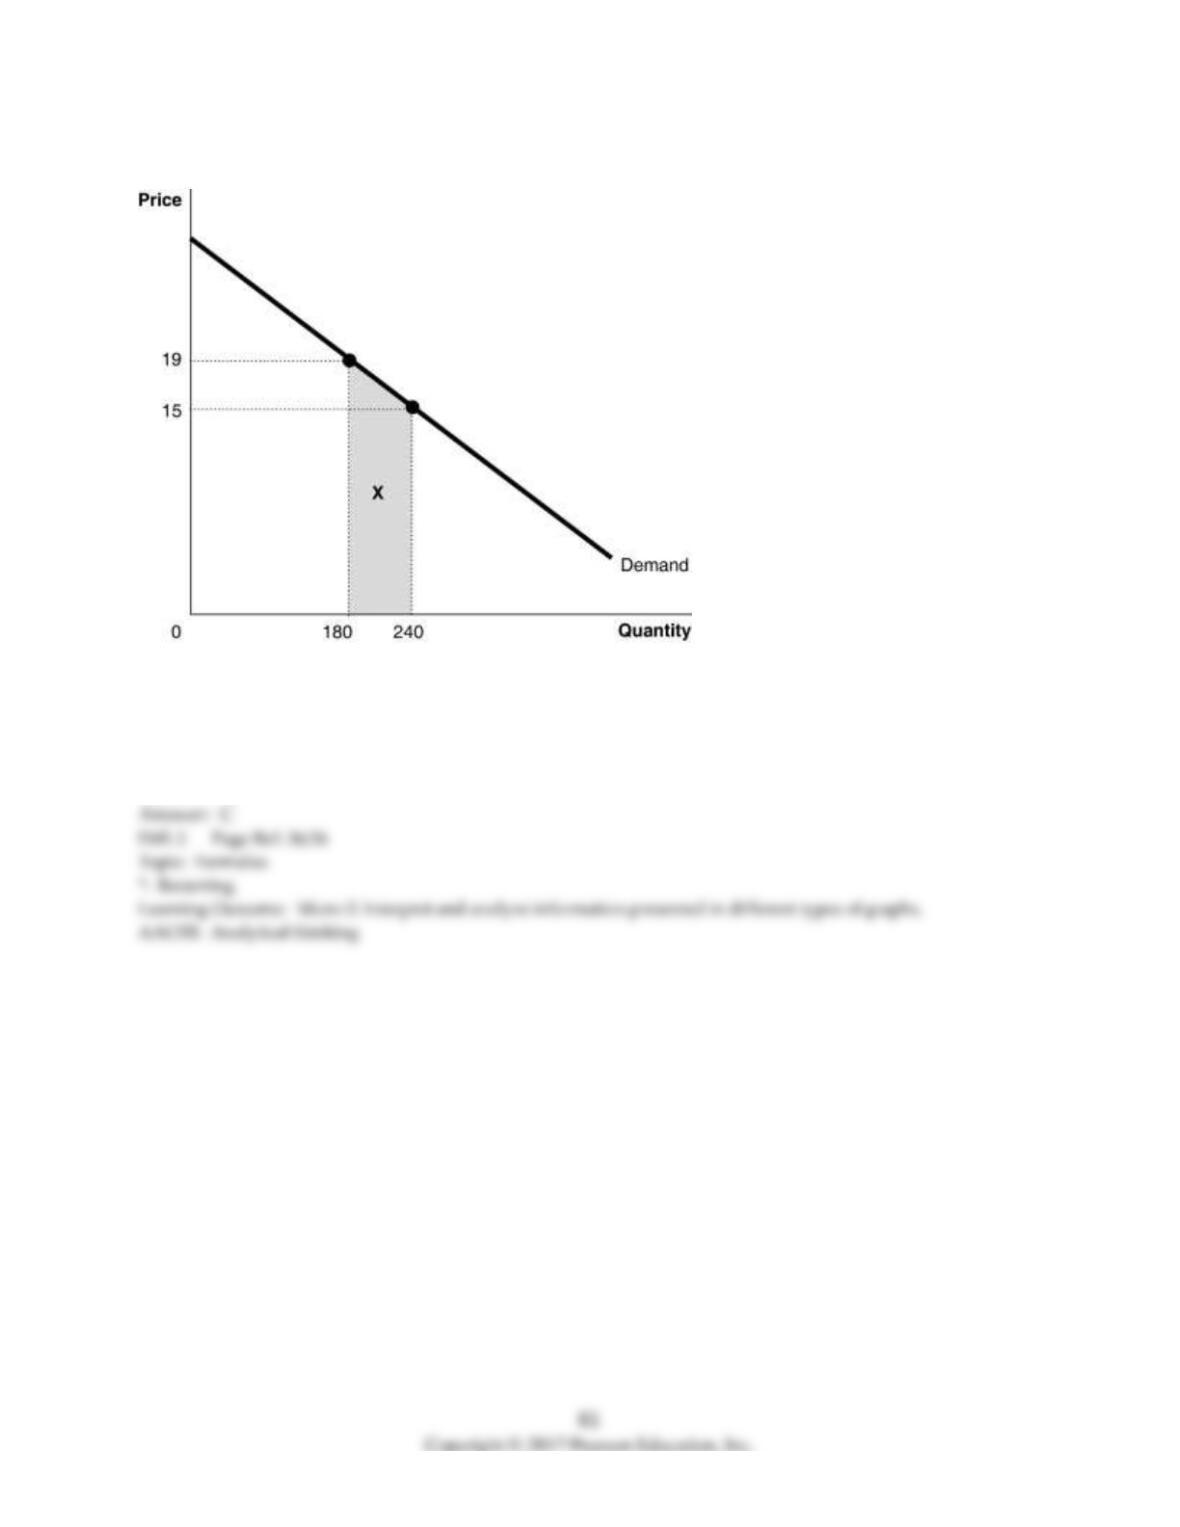
Figure 1-3
16) Refer to Figure 1-3. Calculate the area of the trapezoid X.
A) $361
B) $450
C) $1,020
D) $1,140
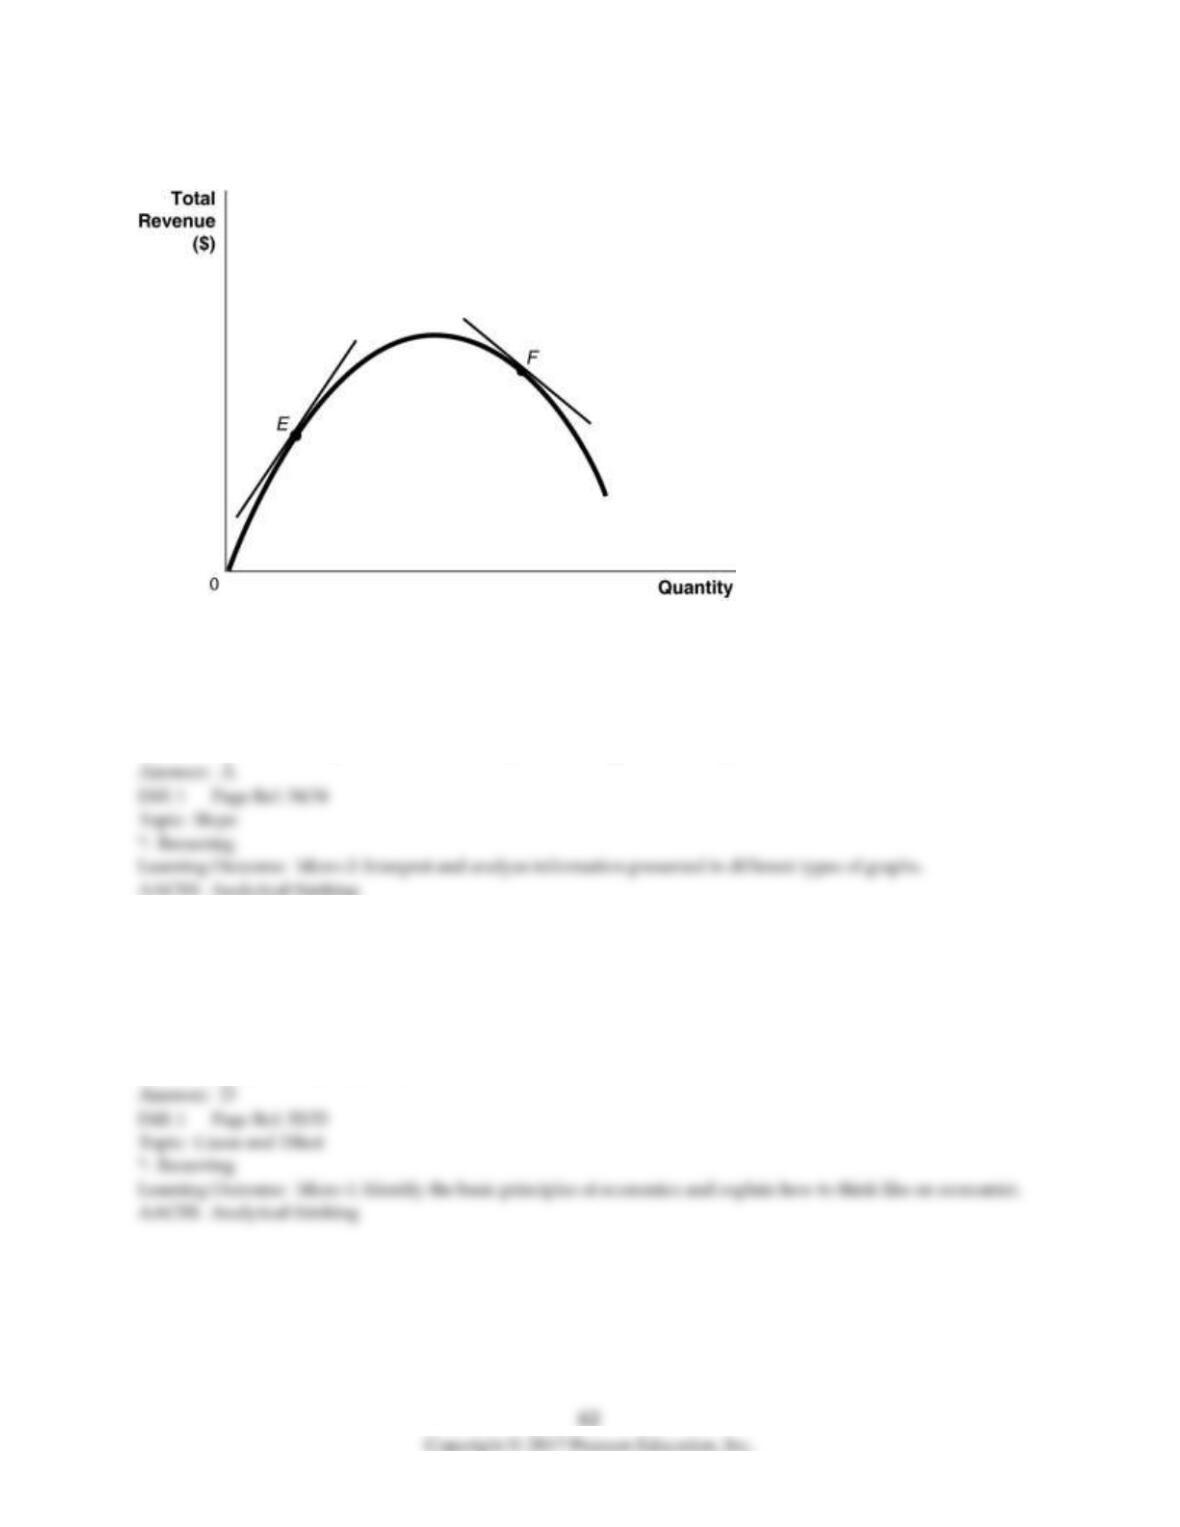
Figure 1-4
17) Refer to Figure 1-4. Which of the following statements is true?
A) The slope of the tangent at E is positive and the slope of the tangent at F is negative.
B) The slope of the tangent at E is negative and the slope of the tangent at F is positive.
C) The slope of the tangent at E and the slope of the tangent at F are negative.
D) The slope of the tangent at E and the slope of the tangent at F are positive.
18) An “omitted variable” is
A) a variable which is purposely omitted from an economic analysis.
B) a variable which is inadvertently omitted from an economic analysis.
C) a variable that has no impact on other variables in an economic analysis.
D) a variable that affects other variables and its omission from economic analysis can lead to false
conclusions about cause and effect.
19) What is the “reverse causality” problem in determining cause and effect?
A) It is a problem that occurs when one concludes that a change in variable X caused a change in
variable Y when in actual fact, it is a change in variable Z that caused a change in variable Y.
B) It is a problem that occurs when one observes that a change in variable X caused a change in variable
Y which caused a change in variable Z and concludes that a change in variable X caused a change in
variable Z.
C) It is a problem that occurs when one concludes that a change in variable X caused a change in
variable Y when in actual fact, it is a change in variable Y that caused a change in variable X.
D) It is a problem that arises when two variables are inter-connected so that a change in variable X
causes a change in variable Y, and a change in variable Y causes a change in variable X.
20) The number of people who have gray hair is very high among residents living in Florida. A student
concludes that living in Florida causes hair to turn gray. What is the flaw in this student’s reasoning?
A) The student is drawing a false conclusion by making the mistake of omitting critical variables such
as the age and gender of the residents.
B) The student is using an inadequate sample size.
C) The student is drawing a false conclusion; he is confusing cause and effect.
D) The student has failed to take into account other causes of gray hair.
21) You explain to your friend Haslina, who runs a catering service called “Meals in a Zip,” about an
economic theory which asserts that consumers will purchase less of a product at higher prices than they
will at lower prices. She contends that the theory is incorrect because over the past two years she has
raised the price of her catered meals and yet has seen a brisk increase in sales. How would you respond
to Haslina?
A) Haslina is right; she has evidence to back her claim. The theory must be erroneous.
B) I will explain to her that she is making the error of reverse causality: it is the increase in demand that
has enabled her to raise her prices.
C) I will explain to her that there are some omitted variables that have contributed to an increase in her
sales such as changes in income.
D) Haslina is making the mistake of assuming that correlation implies causation.
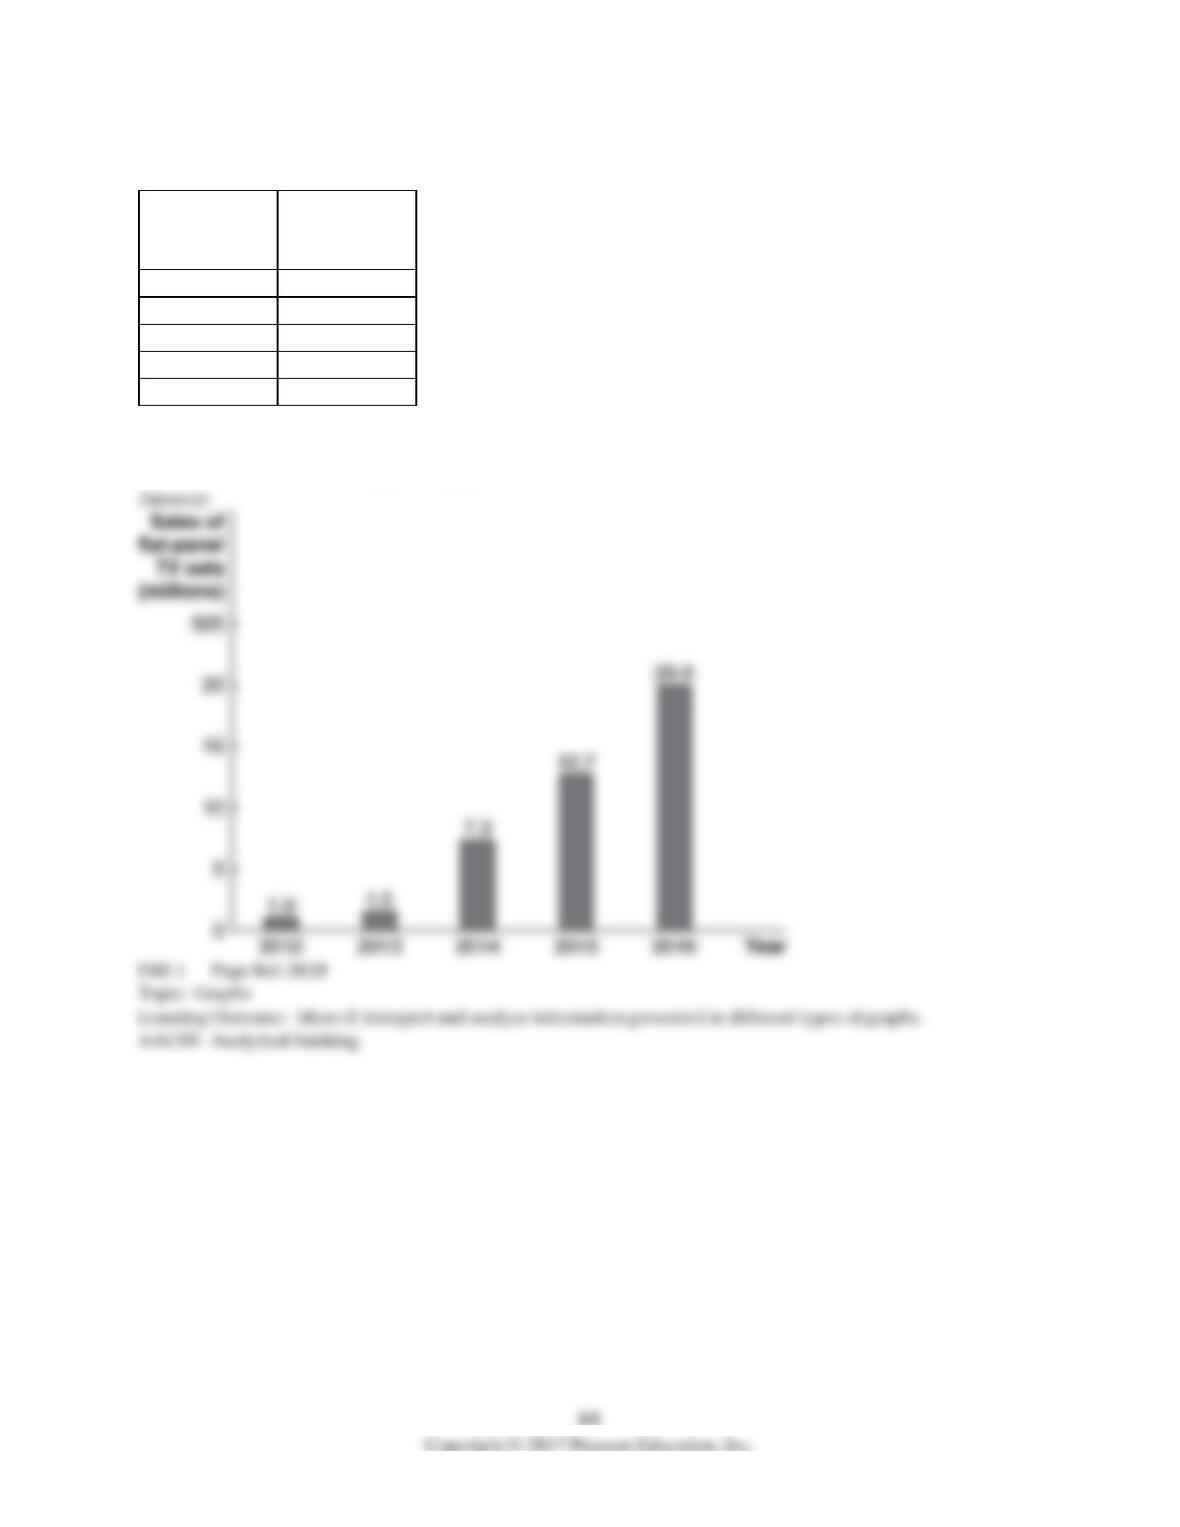
Table 1-4
Year
Flat-Panel TV
Sets
(millions)
2012
1.0
2013
1.5
2014
7.3
2015
12.7
2016
20.0
22) Refer to Table 1-4. The table above shows the sales of flat-panel television sets in Central America.
Present the information using a bar graph.