183. Graphs are useful because of the way they
a.
facilitate interpretation and analysis of data.
b.
clarify interpretation and analysis of ideas.
c.
permit a person to easily see relationships.
d.
convey an idea that might otherwise take many words.
e.
All of the above are correct.
184. A diagram is a good example of a(n)
a.
hypothesis.
b.
abstraction.
c.
theory.
d.
concept.
e.
instrumentation.
185. The beginning point of a graph (the 0,0 point) is known as
a.
ground zero.
b.
mother lode.
c.
the origin.
d.
square one.
e.
the beginning.
186. “The hotter it gets, the more water people drink.” This statement implies that the relationship between temperature
and water consumption must have a
a.
negative slope.
b.
positive slope.
c.
slope always equal to one.
d.
slope always equal to 45 degrees.
187. Suppose that a curve has a slope equal to zero at some point A. To the right of A, the curve may
a.
have a positive slope.
b.
have a negative slope.
c.
be a straight line.
d.
All of the above are correct.
188. The slope of a curved line differs from that of a straight line in that
a.
the numerical value of the slope of a straight line is different at every point, but is the same at every point for a
curved line.
b.
the numerical value of the slope of a straight line is always higher than the numerical value of the slope of a
curved line.
c.
the numerical value of the slope of a curved line is different at every point, but is the same at every point for a
straight line.
d.
the numerical value of the slope of a curved line is an irrational number, but the numerical value of the slope
of a straight line is always a rational number.
e.
straight lines are more realistic, but curved lines are not descriptively accurate for the real world.
189. If an economic curve has a negative slope, then one variable
a.
falls as the other rises.
b.
changes at a slower rate than another.
c.
has a smaller value than another.
d.
changes after another variable.
190. The tangent at point A on a curve has a positive slope. Therefore, the curve has a
a.
positive slope at all points.
b.
positive slope at point A.
c.
negative slope at all points.
d.
negative slope at point A.
191. When variable A rises by 10 units, variable B rises by 15 units. The slope of the line describing this relationship is
a.
always 2/3.
b.
either 2/3 or 1.5, depending on which variable goes on which axis of the graph.
c.
either 1.5 or −1.5, depending on which variable goes on which axis.
d.
always −1.5.
192. The slope of a downward-sloping straight line can be calculated as the distance from the
a.
horizontal intercept of the line to the origin divided by the distance from the origin to the vertical intercept of
the line.
b.
origin to the horizontal intercept of the line minus the distance from the origin to the vertical intercept of the
line.
c.
vertical intercept of the line to the origin divided by the distance from the origin to the horizontal intercept of
the line.
d.
vertical intercept of the line to the origin minus the distance from the origin to the horizontal intercept of the
line.
193. A horizontal line has a slope of
a.
one.
b.
zero.
c.
infinity.
d.
undefined.
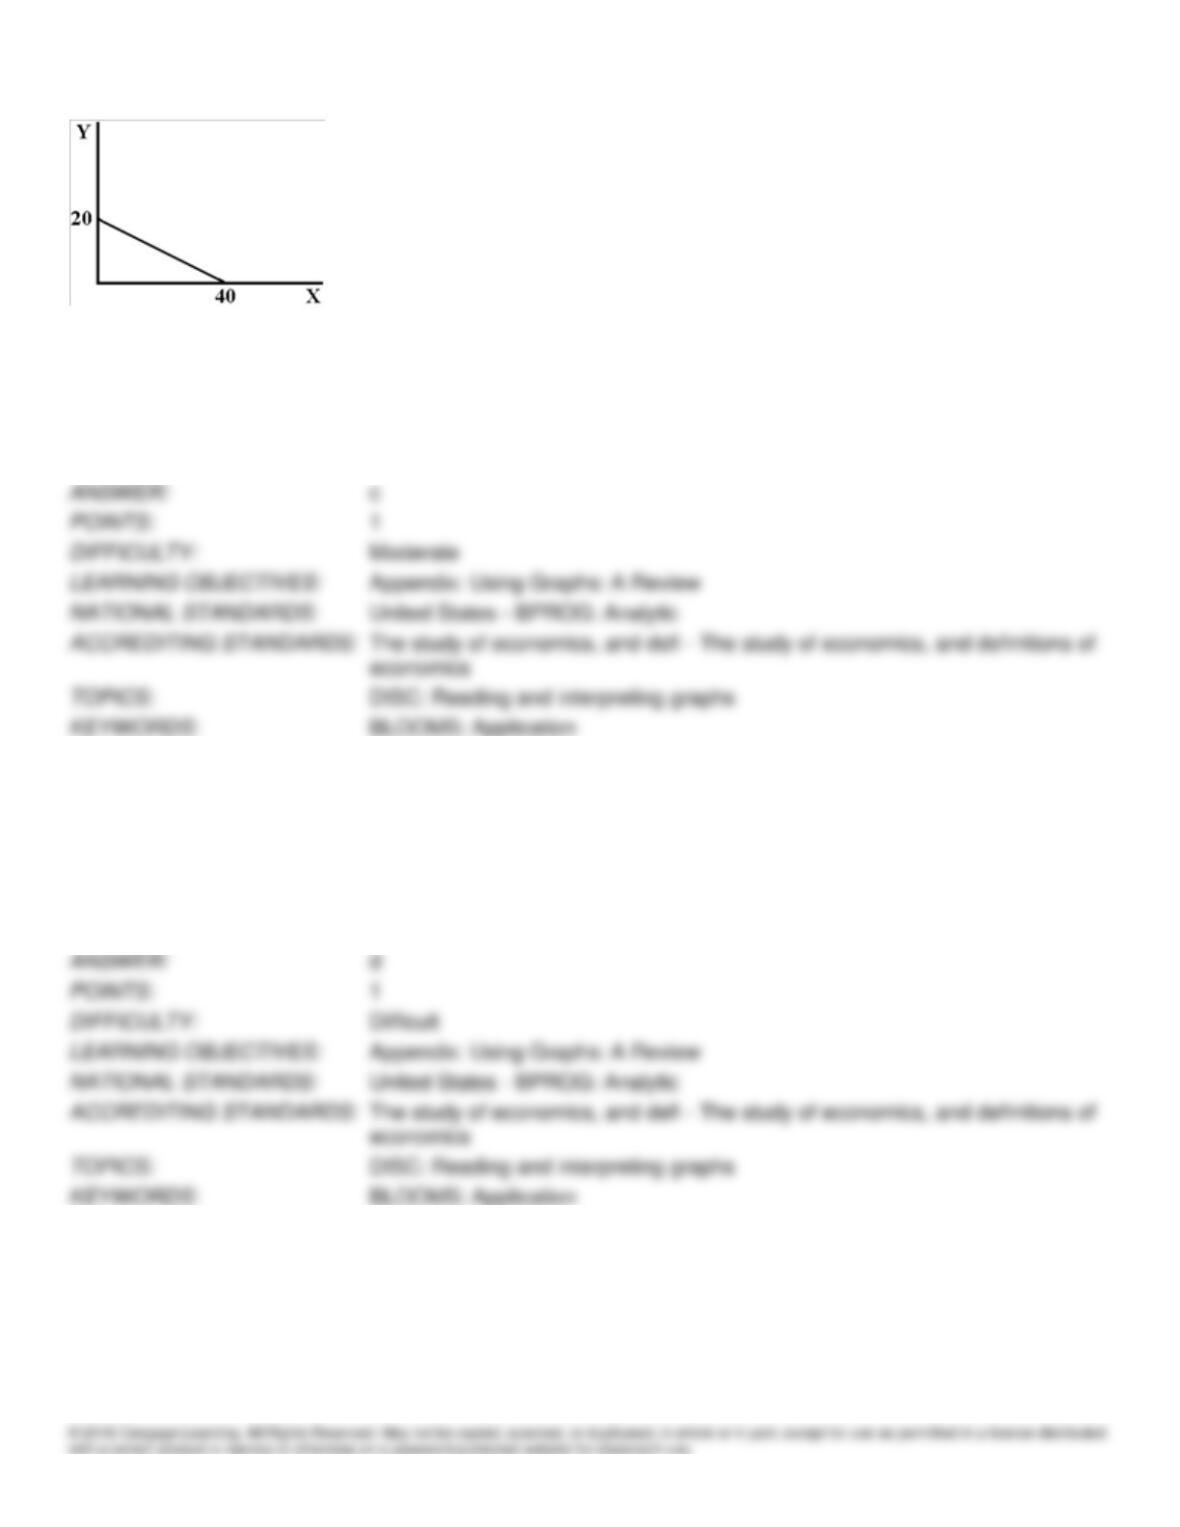
Figure 1-1
194. The slope of the line in Figure 1-1 is
a.
0.5.
b.
2.0.
c.
−0.5.
d.
−2.0.
195. Which of the following mathematical expressions represents the equation of a straight line with a slope of zero at all
points on a graph with Y on the vertical axis and X on the horizontal axis?
a.
Y = a + X
b.
X = bY
c.
X = a
d.
Y = a
196. A vertical line has a slope of
a.
infinity.
b.
zero.
c.
undefined.
d.
1,000.
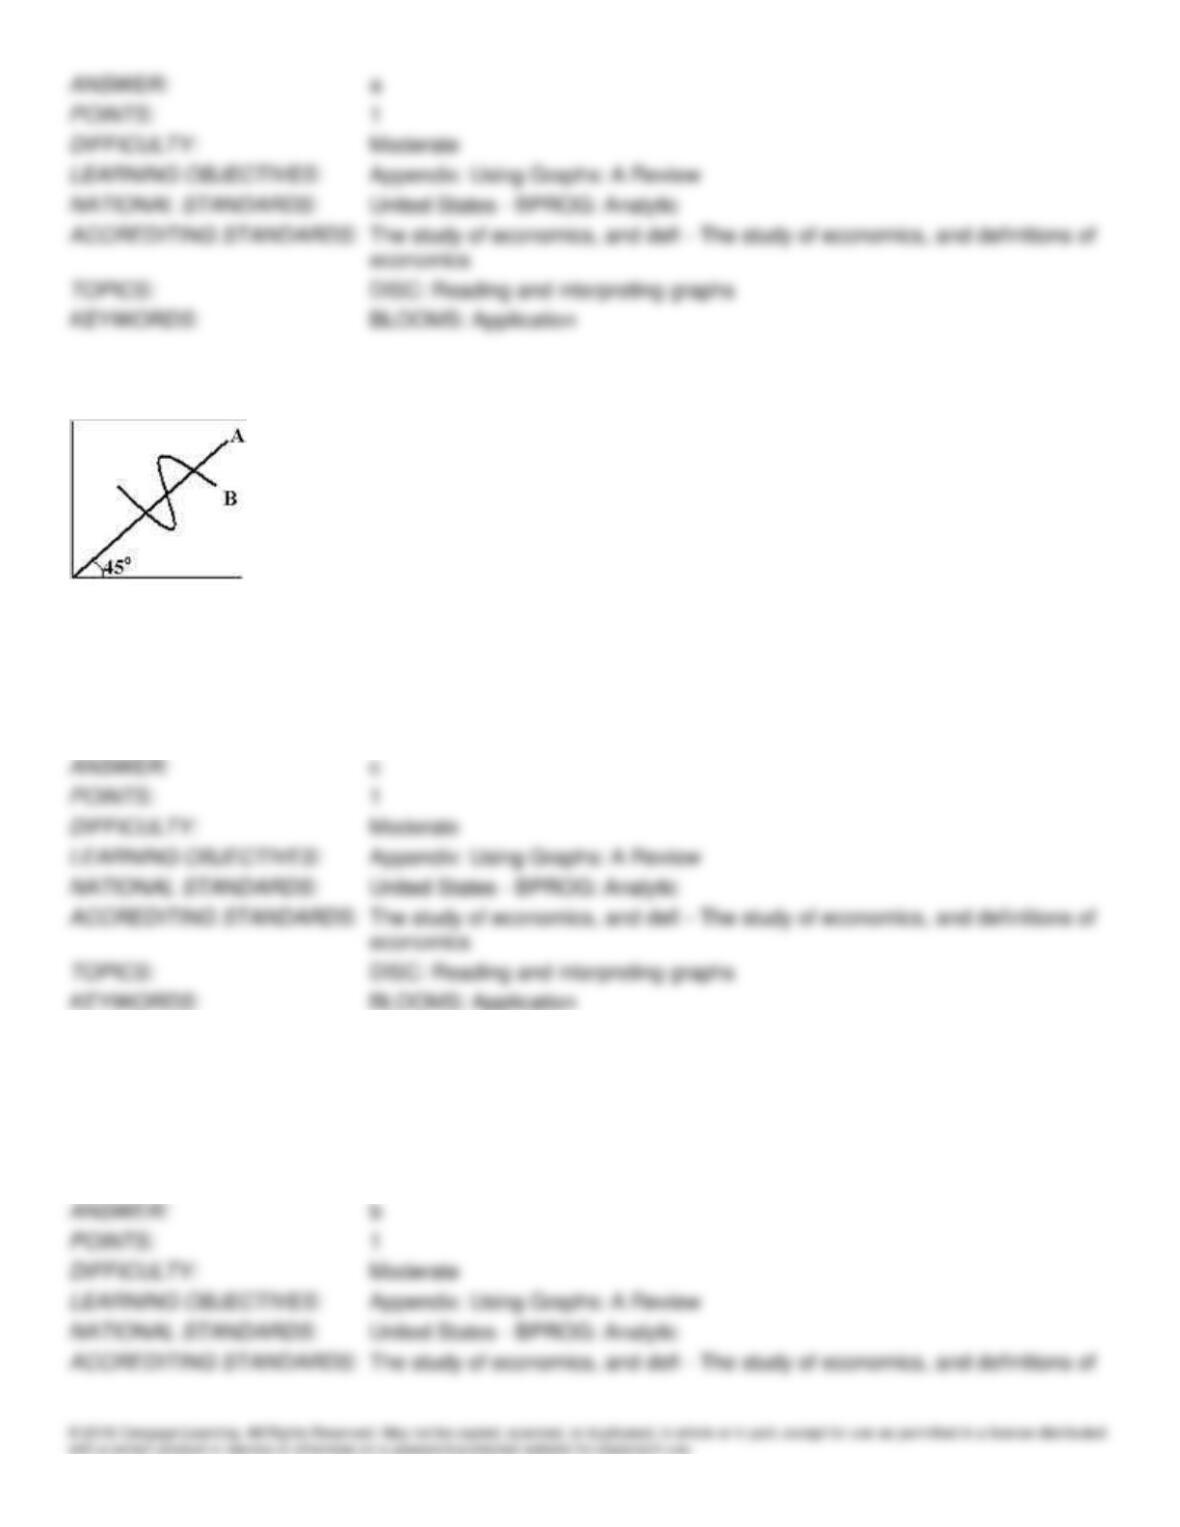
Figure 1-2
197. Identify the slope of the two curves A and B in Figure 1-2.
a.
A – zero, B – one.
b.
A – one, B – zero.
c.
A – one, B – different at different points.
d.
A – different at different points, B – zero.
198. A line that rises at a 45 degree angle has a slope of
a.
0.45.
b.
1.
c.
45.
d.
1/45.
199. If movement along a graph causes the value on the vertical axis to rise by 5 units and the value on the horizontal axis
to fall by 10 units, the slope of the function is
a.
5.
b.
−.5.
c.
−2.
d.
−72.
200. The slope of a curved line at a particular point is
a.
always greater than the slope of a straight line at the same point.
b.
always smaller than the slope of a straight line at the same point.
c.
defined as the slope of the straight line representing the average values for the entire curve.
d.
defined as the slope of the straight line that is tangent to the curve at that point.
201. It is possible to represent three dimensions on a two-dimensional graph by using
a.
a contour map.
b.
a razor blade.
c.
curved lines.
d.
all of the above.
202. A contour map illustrates which of the following?
a.
the cause-effect relationship between two variables
b.
the cause-effect relationship between three variables
c.
the way that three variables are correlated
d.
the way that one variable affects another, which in turn affects a third variable
e.
the way that two variables are correlated and in turn cause changes in a third variable
203. People generally purchase less of a commodity as its price increases. This implies that the relationship between
quantity purchased and the price of the commodity must have a
a.
slope always equal to one.
b.
positive slope.
c.
zero slope.
d.
negative slope.
204. A ____ is a graph whose axes show the quantities of two inputs that are used to produce some output.
a.
production indifference map
b.
two-variable diagram
c.
scalar diagram
d.
time-series graph
205. An “opportunity cost” may be described as:
a.
the value of what must be gtiven up
b.
the opporrtunity foregone
c.
the value of the next best alternative
d.
the correct measure of cost
e.
all of these are correct
206. Regarding economic models, which of the following statements is NOT true?
a.
An economic model is a simplified representation of a theory or part of a theory
b.
An economic model can provide answers for policy makers.
c.
An economic model can illuminate an important economic problem
d.
An economic model can depict 3-variable diagrams.
Essay
207. Carefully define the following terms, and explain their importance in economics.
a.
opportunity cost
b.
abstraction
c.
theory
d.
model
e.
marginal analysis
economic analysis.
under consideration.
208. How does correlation differ from causation? Give an example of each to illustrate your answer.
209. How do markets respond to price ceilings and price floors? Do attempts to repeal the laws of supply and demand
meet their objectives?
products, surpluses pile up because people buy less.
210. Economists often say that trade is a win-win situation. How do you justify this?
211. What are the tools available to governments to mitigate cycles of boom and bust? Why do these tools fail?
212. Why might well-educated economists disagree on appropriate public policy in some situations?
213. How would you interpret (1) an upward sloping curve and (2) a zero slope curve in a two variable diagram?
214. How is a production indifference map helpful?
215. Why do economists abstract, and is it appropriate?
216. Carefully distinguish between an economic theory and economic model.
217. What is the role of value judgments in economic analysis?
218. Suppose that one can read a graph that shows information about price and quantity of some product. Relying solely
on the graph, is it possible to explain the relationship between the two variables?
219. It has been said that “economics is the science of common sense.” Is economics synonymous with common sense?
220. Harry Truman is credited with the statement, “Give me a one-armed economist,” because economists are likely to
say, “On the one hand, . . . on the other hand.” Why do economists “waffle” more than physicists or chemists?
221. In the early 1800s, there was a smallpox outbreak in a remote part of Russia. The government sent in a large group of
army doctors, but they were too late to stop the epidemic. Thirty years later, there was another smallpox scare. A local
statistician cautioned the government against a similar response, noting the increased mortality and high number of army
doctors during the earlier epidemic. Was the statistician providing good advice?
222. A student was heard to remark, “Even though I am certain to fail this course, I cannot withdraw from it since it is too
late to get back my tuition.” Use one or more “Ideas for Beyond the Final Exam” to analyze this reasoning.
223. A large airline calculates that the additional cost of a having a passenger on a flight to the Bahamas as the cost of a
bag of peanuts and a soft drink, which totals $1.50, but the airline’s price is $600 for potential customers who want to buy
vacant seats on the day of the flight. Which economic principle is this airline failing to utilize?
224. In the United States the distribution of income is relatively unequal, and output is relatively high, while in the former
Soviet Union the distribution of income was more equal and output per worker was much lower. Give one possible
explanation for this phenomenon.
225. It has been found that people die at a much higher rate in hospitals than in most other environments, leading some to
conclude that hospitals cause death. What is the problem with this reasoning?
226. Explain why an airline may decide to sell an air ticket to a stand-by passenger at less than the full-fare if there are
empty seats on the airplane?
227. How does the United States differ from the European Union in how it balances the competing claims of equality and
efficiency?
228. Many believe that fairness calls for higher income taxes on the wealthy. Using one of the “Ideas for Beyond the Final
Exam,” explain how higher taxes on the wealthy will affect output.
reduce their tax liability.
229. Carefully define the following terms and explain their importance.
a.
variable
b.
ray
c.
slope
d.
contour map
230. If you leave your money in the bank at a fixed interest rate and allow for compounding of interest, show what will
happen to your savings over time. Indicate with a graph whether there is a negative or positive slope between savings and
time and what happens to the slope over time.
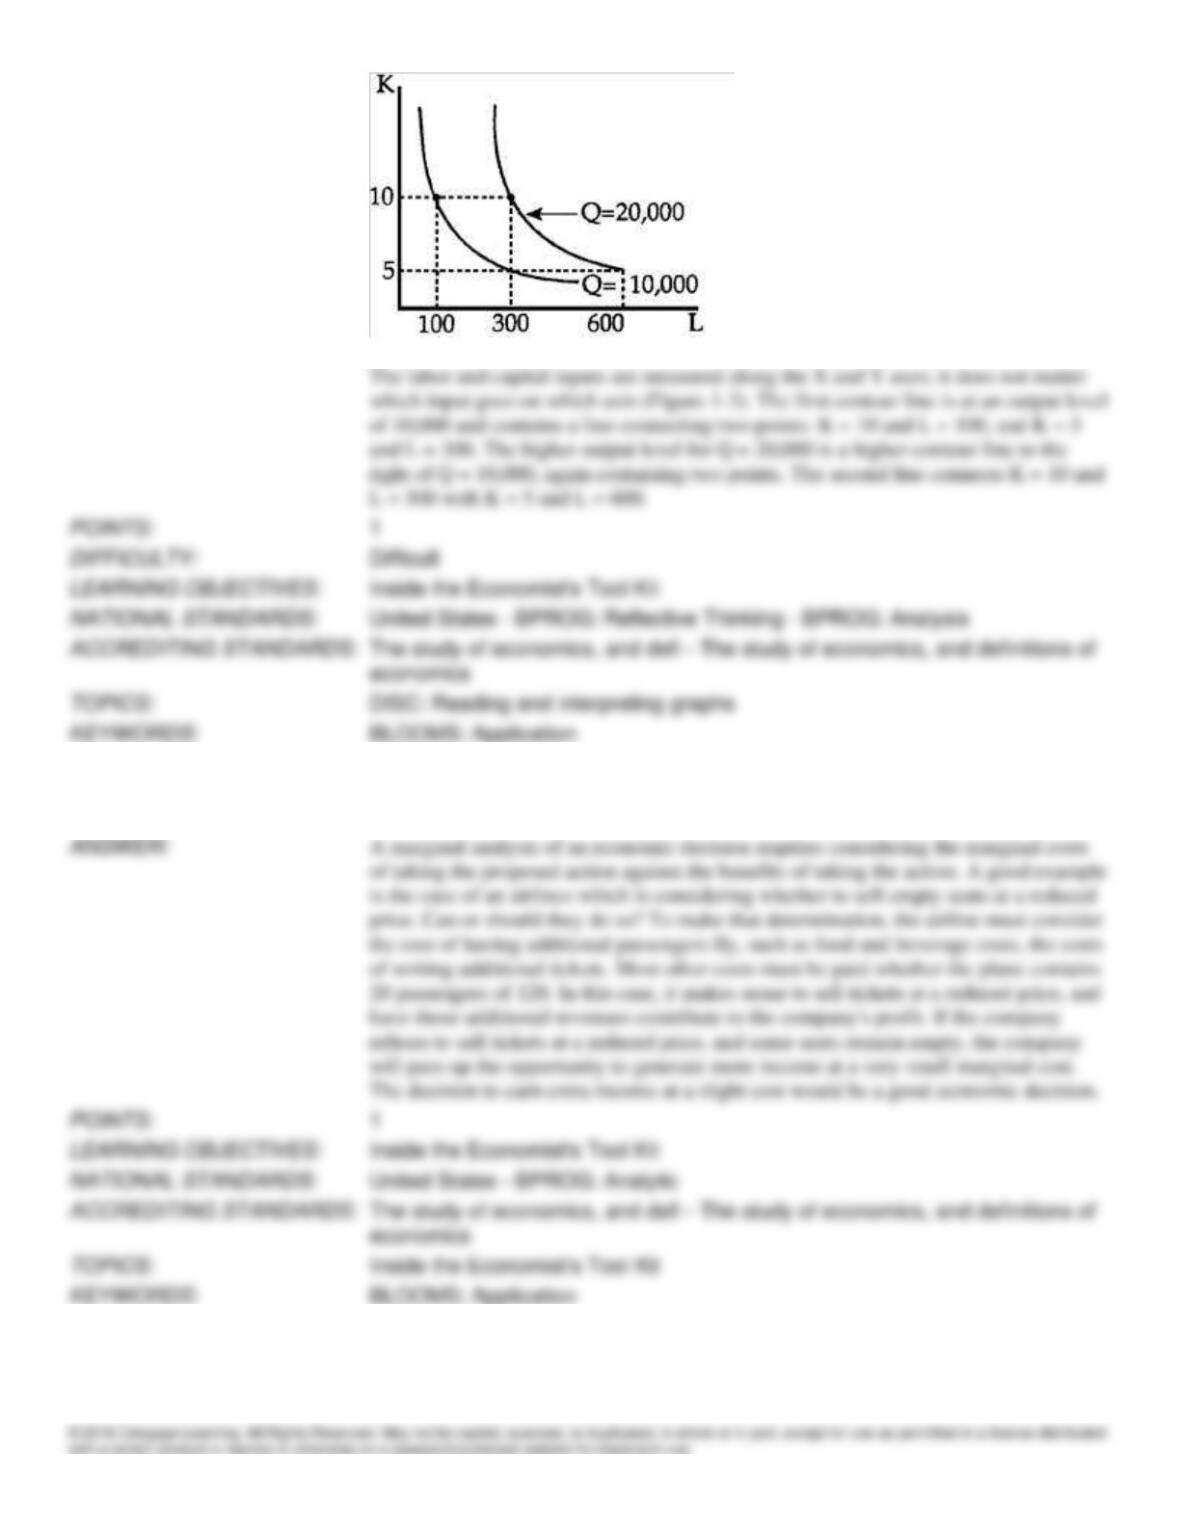
231. Dryden Press can produce 10,000 textbooks using 10 machines and 100 workers or using five machines and 300
workers. It can produce 20,000 textbooks using 10 machines and 300 workers or five machines and 600 workers.
Construct a two-dimensional contour-type graph to show the relationship between the output of textbooks and the labor
and machinery inputs.
232. Explain the following statement: “Good decisions typically require marginal analysis, which weighs added costs
against added benefits.”