72 Miller Economics Today, 16th Edition
43) Which one of the following is an example of a normative statement?
A) Public school teachers are not paid enough.
B) The average public school teacher earns less than the average truck driver.
C) The average public school teacher earns more than the average truck driver.
D) Students in smaller classes perform better on standardized tests.
44) Normative economics
A) is never studied at the undergraduate level.
B) involves value judgments.
C) is always objective.
D) cannot be applied to all economic problems.
45) The President s statement that to encourage economic growth, taxes should be cut,
A) would be an example of a normative statement.
B) would be an example of a positive statement.
C) would be an example of a microeconomic statement.
D) would be a statement of mercantilist economic philosophy.
46) The headline in the local paper today is College tuition next fall will be raised by 3 percent.
This statement is an example of
A) a normative statement. B) a positive statement.
C) a macroeconomic statement. D) ceteris paribus.
47) Positive economics
A) always gives an optimistic spin to economic news.
B) is concerned with the economic policies that should be implemented.
C) is objective.
D) was not used by nineteenth century economists.
48) Which of the following is a normative economic statement?
A) Few auto mechanics are women.
B) Men and women should earn the same salary if they perform the same job.
C) Auto mechanics typically earned more than waitresses in the United States in 2004.
D) Most wait staff are women.
49) Economics seeks to use only positive analysis to
A) provide a value free analysis. B) seek the best answer.
C) predict how people should act. D) provide normative values.
50) Which of the following is a positive economic statement?
A) We should strive to achieve full employment in the United States.
B) The President of the United States should promote stable prices in the United States.
C) If the price of eggs increases, the quantity demanded of bacon will fall.
D) We should try to eliminate poverty in the United States.
51) Normative economic statements
A) are statements of what ought to be.
B) are statements of what is.
C) are statements that may be tested by referring to facts and data.
D) do not involve value judgments.
52) Which of the following is a normative economic statement?
A) If the government increases spending, unemployment will fall.
B) The government should increase spending during times of economic recession.
C) If banks create more money, unemployment will decrease.
D) If the price of gasoline rises, car pooling will increase.
53) The U.S. government should not use my tax dollars to subsidize people on welfare
A) is a positive economic statement because it simply describes one person s opinion.
B) is a normative economic statement because it involves a value judgment about an
economic policy.
C) is a positive economic statement because it predicts that my tax dollars will go to welfare.
D) is a normative economic statement because it is a scientific fact.
54) All of the following are positive statements EXCEPT
A) the President of the United States in 2008 was George W. Bush.
B) California is in the United States.
C) migratory birds fly south for the winter.
D) a dog is man s best friend.
55) Positive analysis can be described as
A) the study of whether people respond to positive incentives.
B) the study of whether people respond to negative incentives.
C) a value free approach to inquiry.
D) a study that is not tested empirically.
56) A positive economic statement is one that
A) can be refuted.
B) is free of the ceteris paribus assumption.
C) is based on a value judgment.
D) asserts something about the role of moral behavior in building a strong economy.
57) Which of the following is a positive statement?
A) We need to carefully protect our borders.
B) Hyperinflation is the most damaging thing that can occur in an economy.
C) When tax revenues are less than government spending there is a budget deficit.
D) Foreign aid should be reduced to help our budget deficit.
58) Which of the following is a normative statement?
A) The Gross Domestic Product is the dollar value of all goods and services produced in a
country in a year.
B) Fiscal policy is determined by the Congress and the president.
C) Tax cuts ought to be enacted for the good of the economy.
D) Monetary policy is determined by the Federal Reserve System.
59) A positive economic statement is always true and a normative economic statement is always
false. Do you agree or disagree with this statement? Explain.
1.7 Appendix A: Direct and Inverse Relationships
1) A relationship between two variables in which one variable increases at the same time as the
other decreases is called
A) nonlinear. B) constant. C) inverse. D) direct.
2) A direct relationship occurs when
A) the two variables being compared change in opposite directions, or when one goes up the
other goes down.
B) a change in one of the variables causes a change in the other variable in any direction.
C) the two variables being compared change in the same direction, or when one goes up the
other also goes up.
D) the two variables have no identifiable relationship with each other.
3) If an increase in one variable causes a decrease in another variable, this is
A) a direct relationship. B) a dependent relationship.
C) an independent relationship. D) an inverse relationship.
4) A relationship between two variables in which one variable increases at the same time that the
other increases is called
A) nonlinear. B) constant. C) inverse. D) direct.
5) When two variables have an inverse relationship, the slope is
A) negative. B) positive. C) infinity. D) zero.
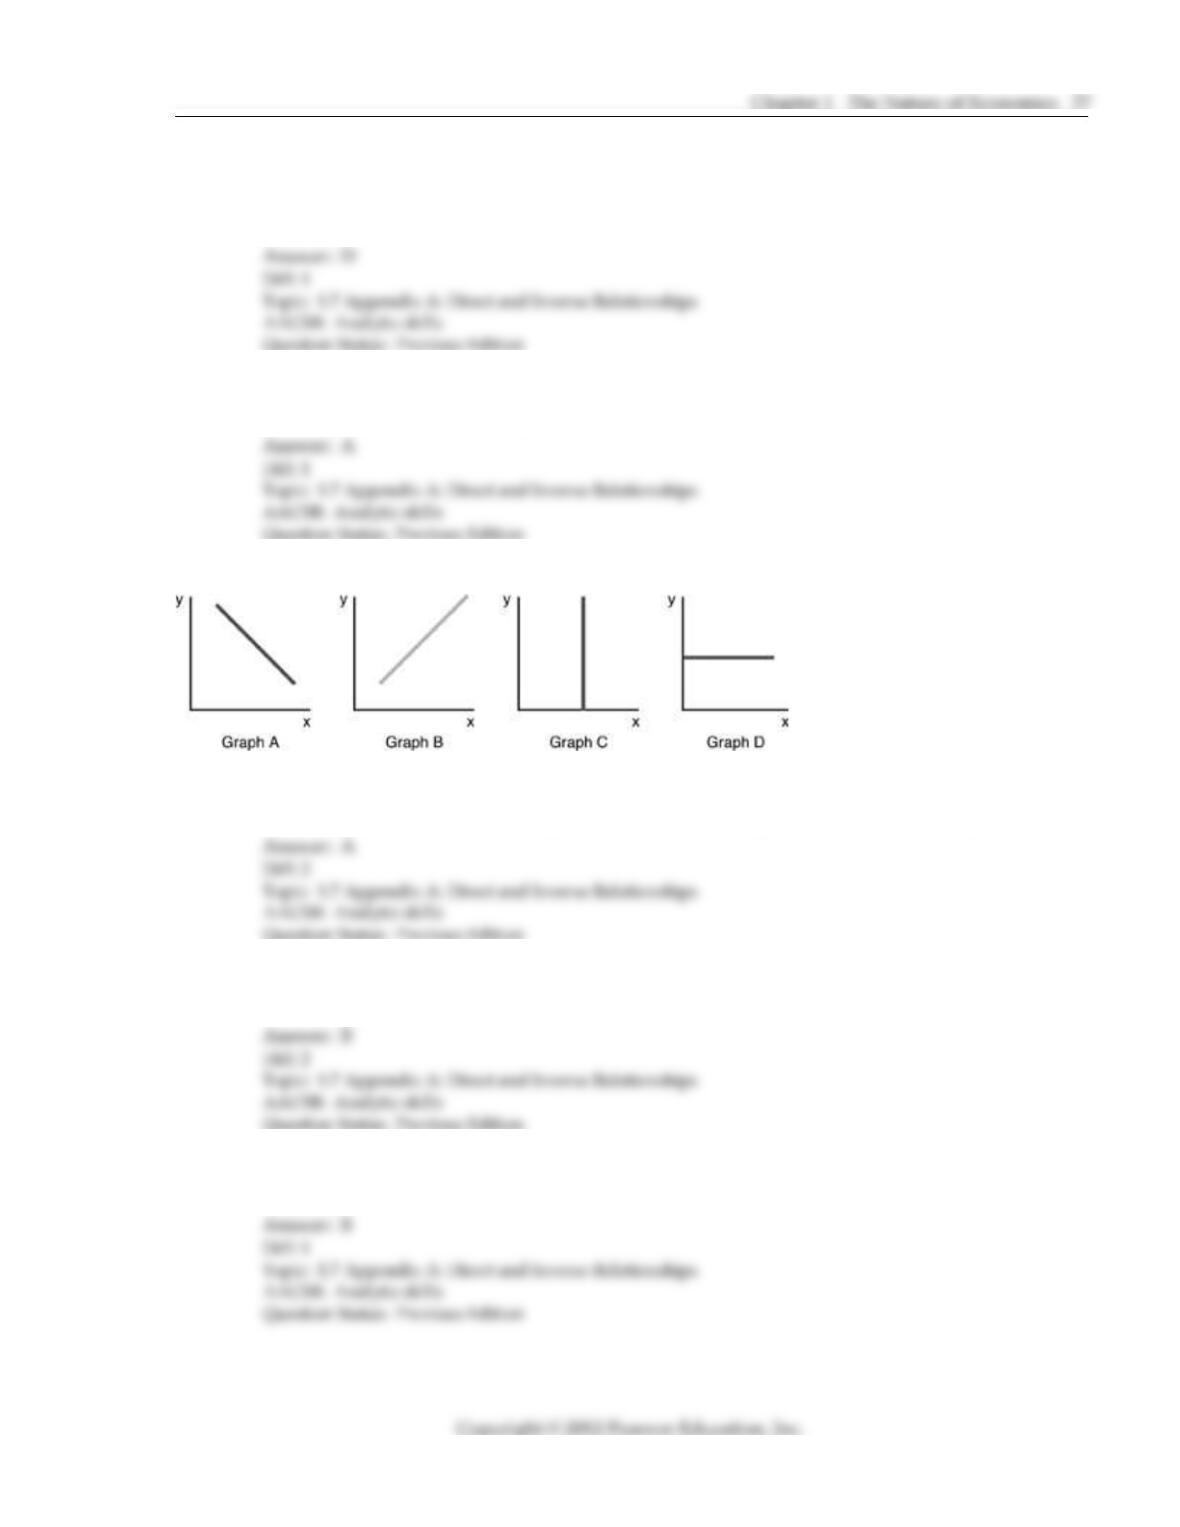
6) In the above graphs, an inverse relationship is shown by
A) Graph A. B) Graph B. C) Graph C. D) Graph D.
7) In the above graphs a direct relationship is shown by
A) Graph A. B) Graph B. C) Graph C. D) Graph D.
8) When two variables have a direct relationship, the slope is
A) negative. B) positive. C) zero. D) infinity.
9) An inverse relationship will be graphed as
A) a line that is upward sloping. B) a line that is downward sloping.
C) a loop. D) a U shaped curve.
10) In an inverse relationship,
A) one variable rises while the other falls.
B)
b
oth variables rise together.
C)
b
oth variables fall together.
D) the two variables have nothing to do with each other.
11) Which of the following is an example of an inverse relationship?
A) hours of study and test grade
B) calories eliminated from diet and weight loss
C)
b
eers consumed while studying and test grade
D) amount of snowfall and profits of ski resorts
1.8 Appendix A: Constructing a Graph
1) Consider the statement, The number of beers consumed the night before a test affects the
grade. In this statement
A)
b
eer is the dependent variable and test grade is the independent variable.
B)
b
eer is the independent variable and test grade is the dependent variable.
C)
b
oth beer and grade are dependent variables.
D)
b
oth beer and grade are independent variables.
2) The paired observation of (14, 6) means
A) x 14, y 6.
B) x 6, y 14.
C) x any multiple of 14, y any multiple of 6.
D) the origin is at 14 and 6.
3) The paired observation of ( 14, 6) means
A) x 14, y 6
B) x 6, y 14
C) that the distance between the two points will be 8.
D) the origin is at 14 and 6.
4) The intersection of the xaxis and the
y
axis is called the
A) meeting point. B) origin.
C) zero point. D) corresponding point.
1.9 Appendix A: Graphing Numbers in a Table
1) The relationship between beers consumed the night before an exam and test grade will be
graphed as
A) a line sloping down from upper right to lower left.
B) a line sloping down from upper left to lower right.
C) a circle.
D) a u shaped curve.
2) Suppose that on average there are five more car accidents for every extra inch of snowfall in a
certain region. If snowfall is graphed on the y axis and car accidents on the x axis, then if we
graph this relationship, the slope of the line will be
A) 25. B) 5. C) 1/5. D) 1.
3) If the slope of a curve is 1/5, we know that
A) the relationship is linear, and the line moves from lower left to upper right.
B) the relationship is non linear, and the line moves from lower left to upper right.
C) the relationship is linear, and the line moves from upper left to lower right.
D) the relationship is non linear, and the line moves from upper left to lower right.
1.10 Appendix A: The Slope of a Line (A Linear Curve)
1) A negative slope
A) represents an inverse relationship, such as beers consumed and test score.
B) represents a direct relationship, such as snow fall and car accidents.
C) indicates that there is no relationship between two variables, such as women s wages and
likelihood of sunshine.
D) means that the line crosses below the x axis.
2) The slope of a straight line
A) is the same at all points along that line.
B) cannot be defined.
C) changes from one point to the next on that line.
D) is always equal to zero.
3) The slope of a nonlinear curve
A) is constant.
B) is always negative.
C) changes along the various points of the curve.
D) is always equal to 1.
4) The slope of a nonlinear curve is ________ when the curve is rising, and ________ when the
curve is falling.
A) negative, positive B) negative, negative
C) positive, negative D) positive, positive
5) If a straight line crosses the Y axis at 5 and crosses the X axis at 10, we can conclude that the
slope of the line is
A) positive. B) negative. C) zero. D) infinity.
6) The slope of a line is the
A) change in the values along the x axis divided by the change in the values along the y axis.
B) values on the x axis divided by the values on the y axis.
C) change in the values along the y axis divided by the change in the values along the x axis.
D) values on the y axis divided by the values on the x axis.
7) Given a linear curve, the value on the y axis changes from 100 to 120 when the value on the
xaxis changes from 20 to 10, then the slope of that curve is
A) 20. B) 20. C) 2. D) 2.