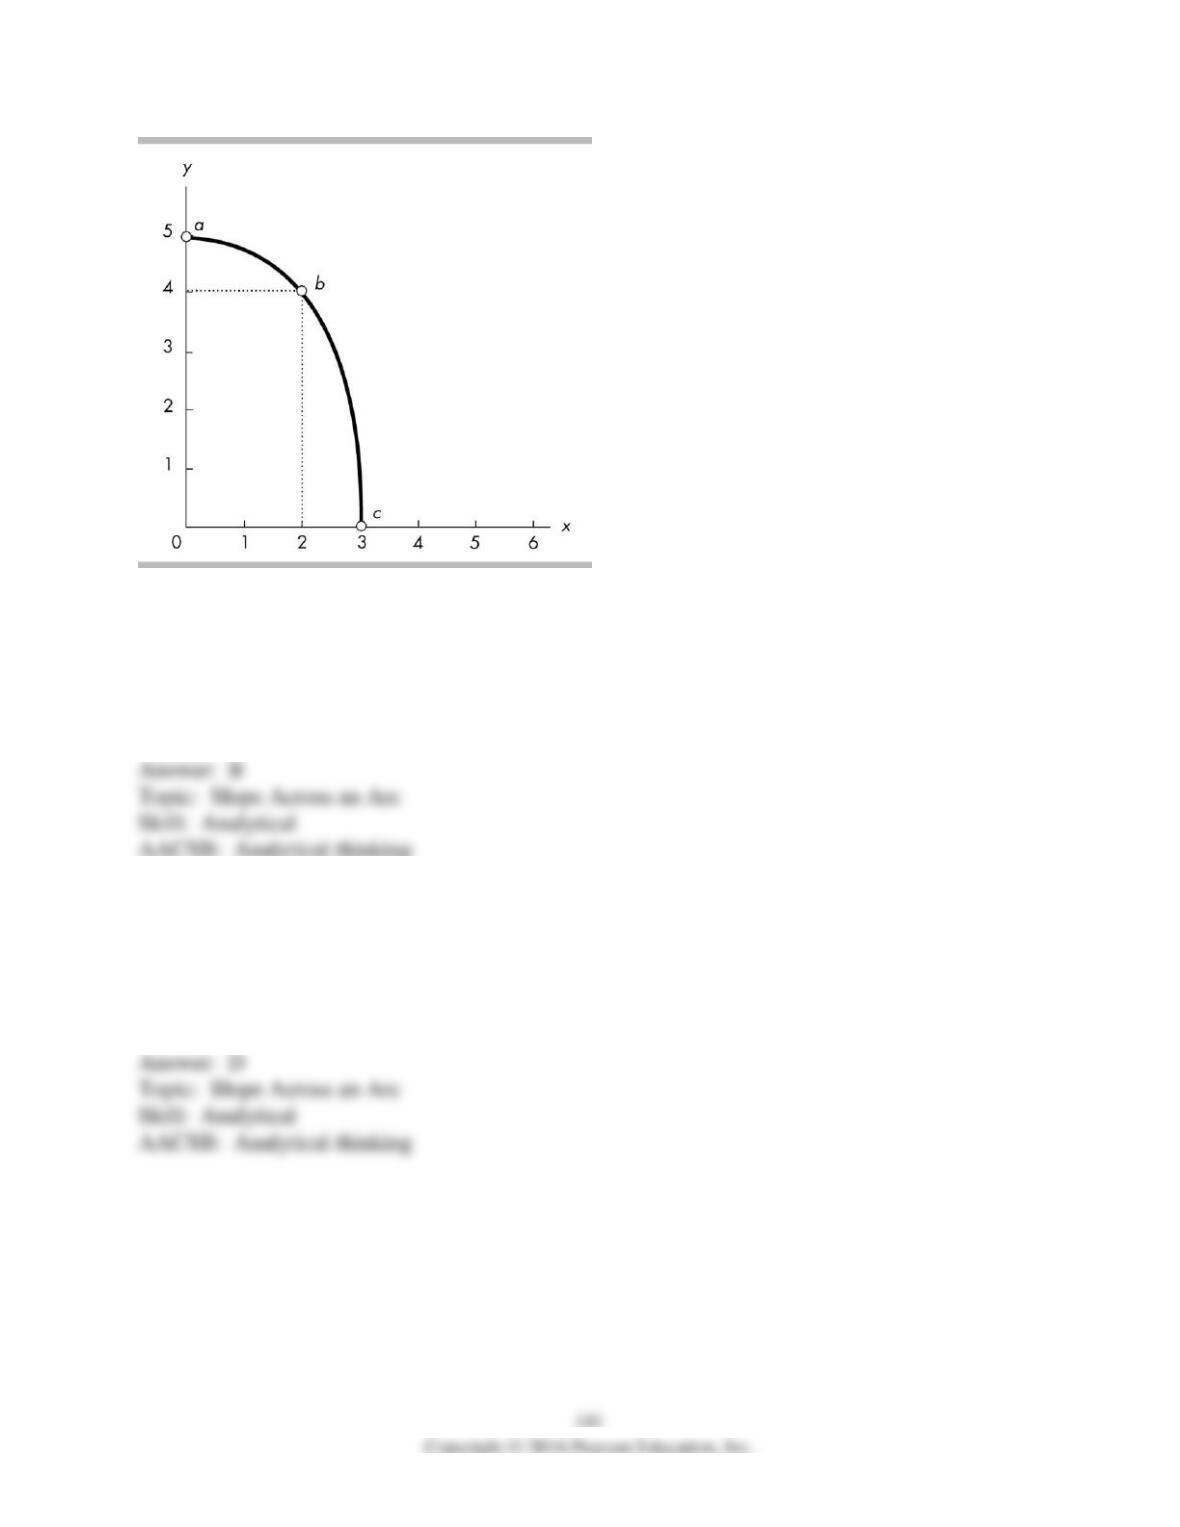
67) In the above figure, using the slope across an arc, the slope of the curve between points a and
b is
A) 1/2.
B) -1/2.
C) 2.
D) -2.
68) In the above figure, using the slope across an arc, the slope of the curve between points a and
c is
A) 3/5.
B) 5/3.
C) -3/5.
D) -5/3.
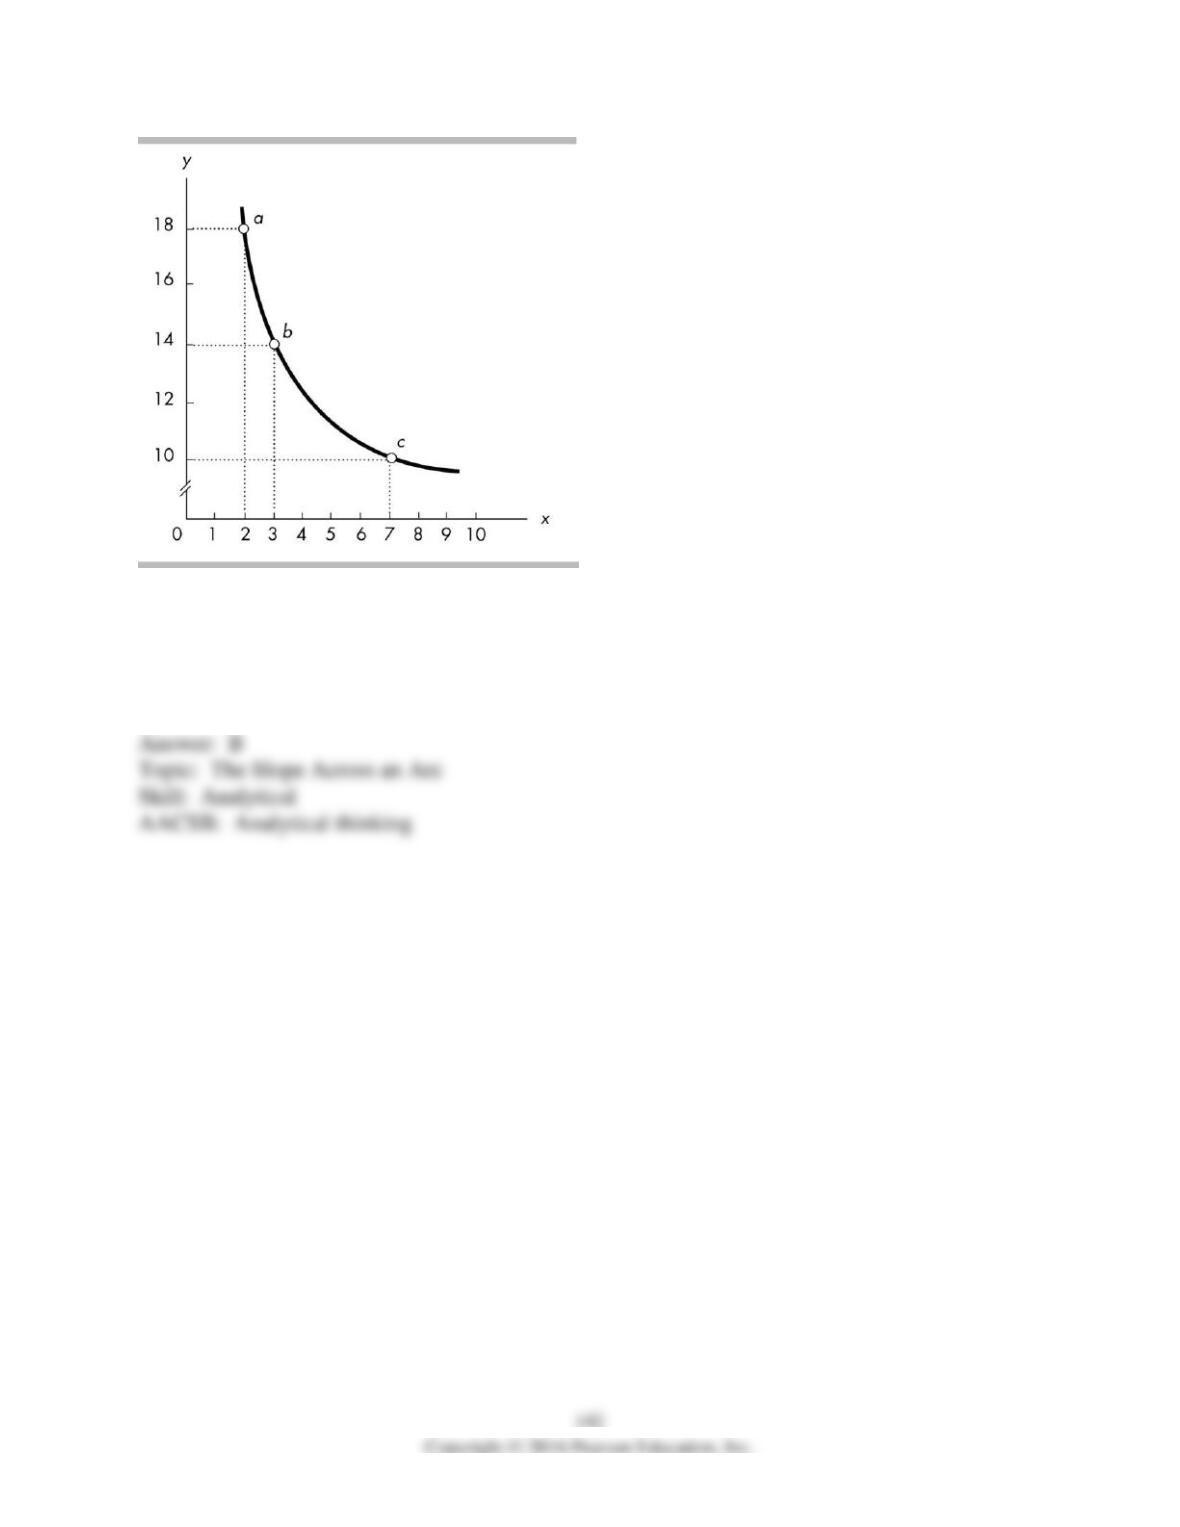
69) In the above figure, the slope across the arc between a and b is
A) 1.
B) -4.
C) 1/4.
D) -1/4.
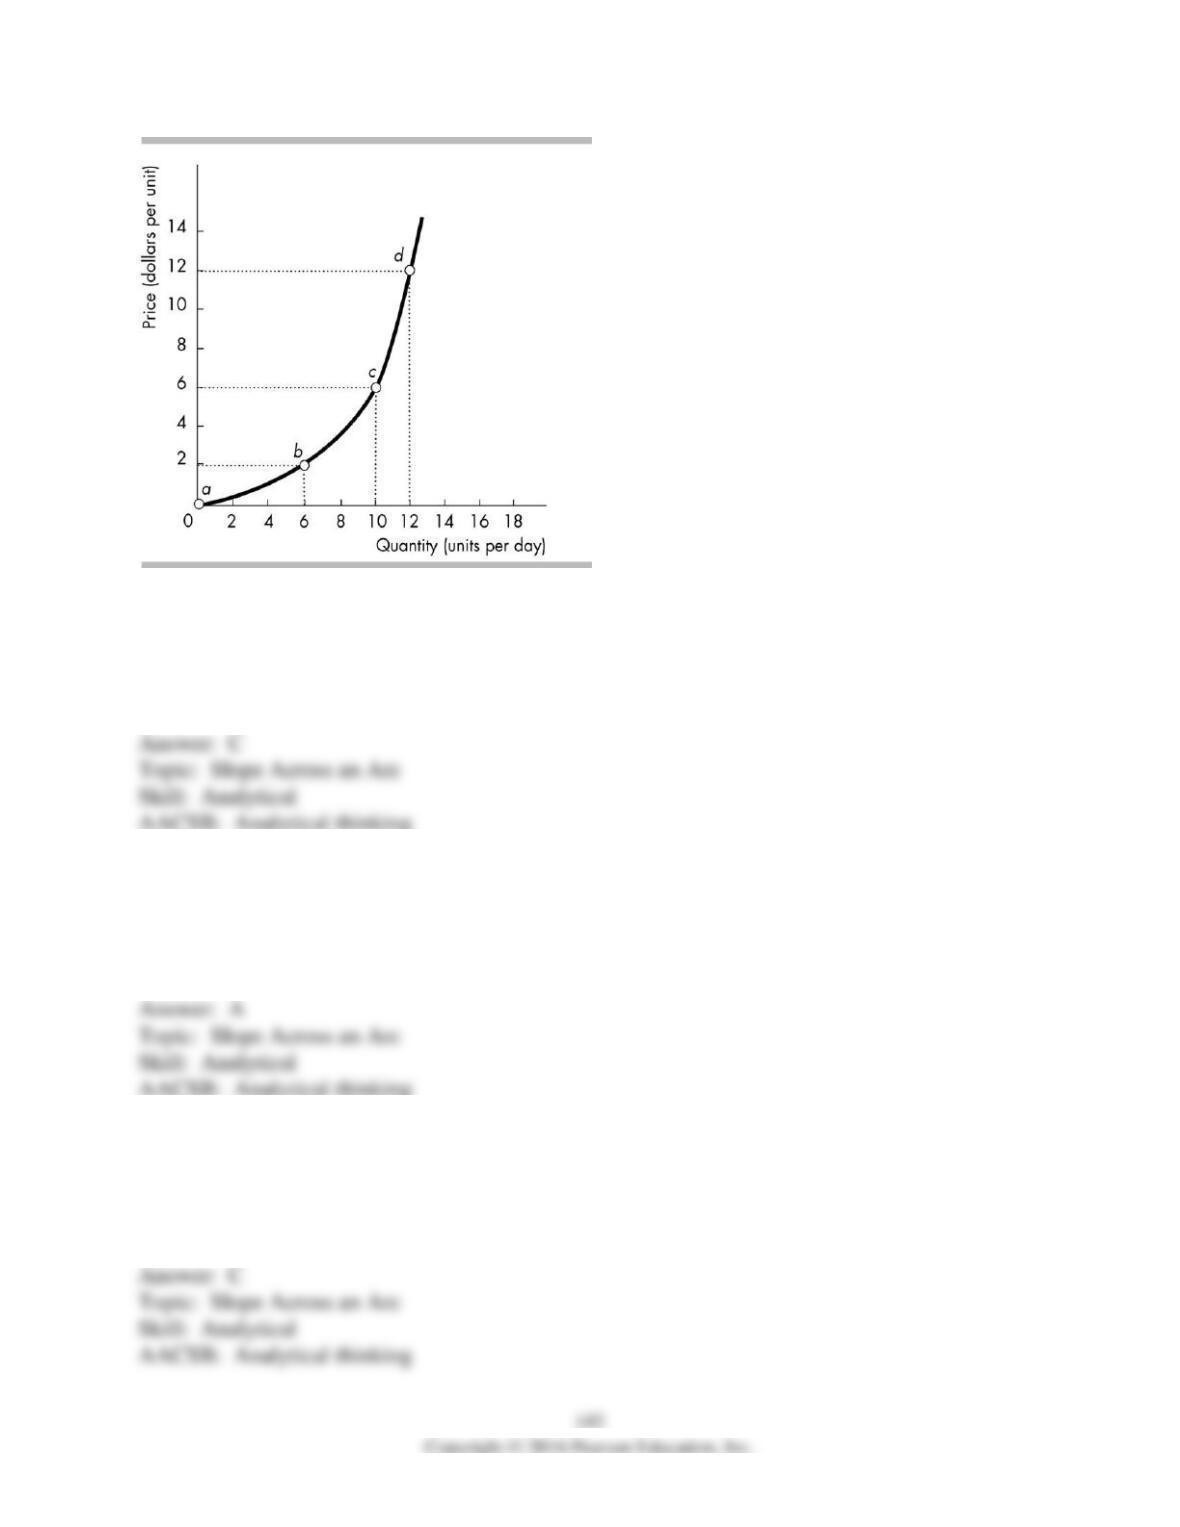
70) In the above figure, the slope across the arc between b and d is
A) 1/2.
B) 1/3.
C) 5/3.
D) 6/5.
71) In the above figure, the slope at point b
A) lies between 1/3 and 1.
B) equals 1.
C) lies between 1 and 2.
D) exceeds 2.
72) In the above figure, the slope across the arc between c and d is
A) 1/6.
B) 12/11.
C) 3.
D) 4.
73) In the above figure, the slope across the arc between a and b is
A) 3.
B) 1.
C) 3/5.
D) 1/3.
74) Along a curved line, the slope at the maximum
A) is greater than zero.
B) is zero.
C) is less than zero.
D) may be greater than, less than, or equal to zero.
75) Consider a diagram in which the variable measured on the y-axis remains constant while the
variable measured on the x-axis increases. The graph is of this relationship is a
A) perpendicular line.
B) line with slope equal to zero.
C) line that has positive slope.
D) line that has a negative slope.
76) The slope of a negative relationship is
A) negative.
B) undefined.
C) positive to the right of the maximum point and negative to the left.
D) constant as long as the relationship is nonlinear.
77) A linear relationship
A) always has a maximum.
B) always has a constant slope.
C) always slopes up to the right.
D) never has a constant slope.
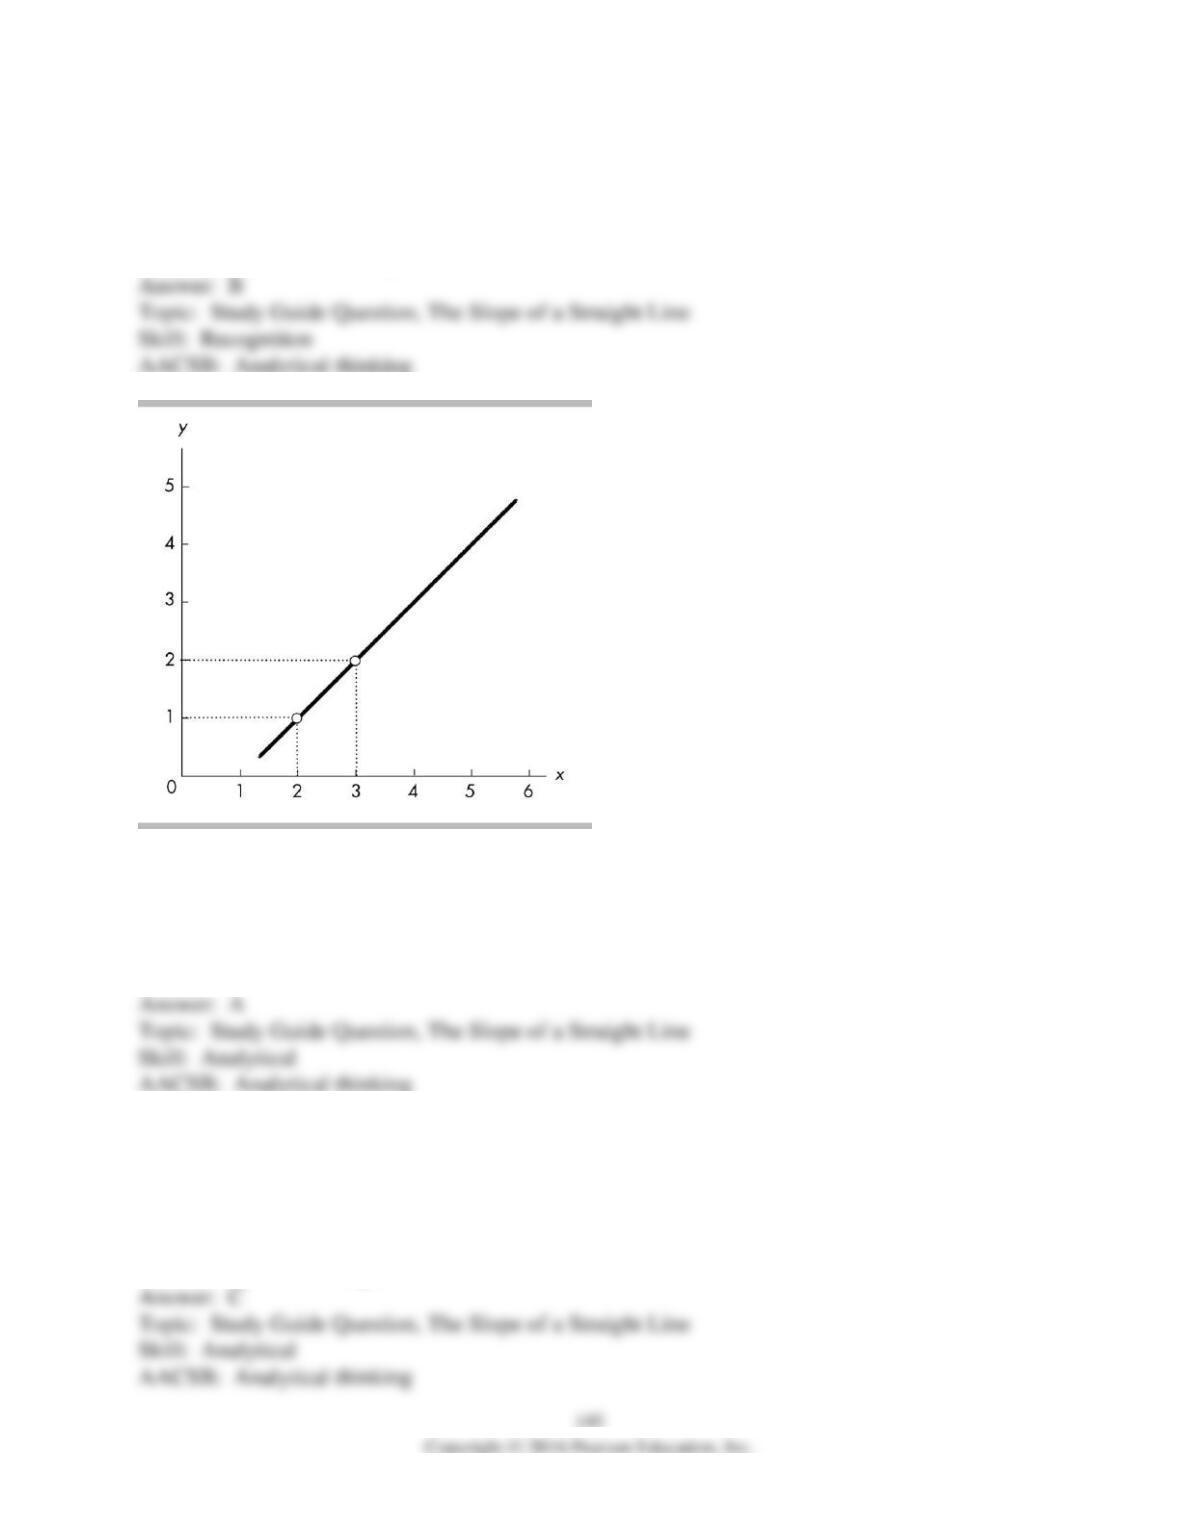
78) In the above figure, between x = 2 and x = 3, what is the slope of the line?
A) 1
B) -1
C) 2
D) 3
79) In the above figure, how does the slope of the line between x = 4 and x = 5 compare with the
slope between x = 2 and x = 3?
A) The slope is greater between x = 4 and x = 5.
B) The slope is greater between x = 2 and x = 3.
C) The slope is the same.
D) The slope is not comparable.
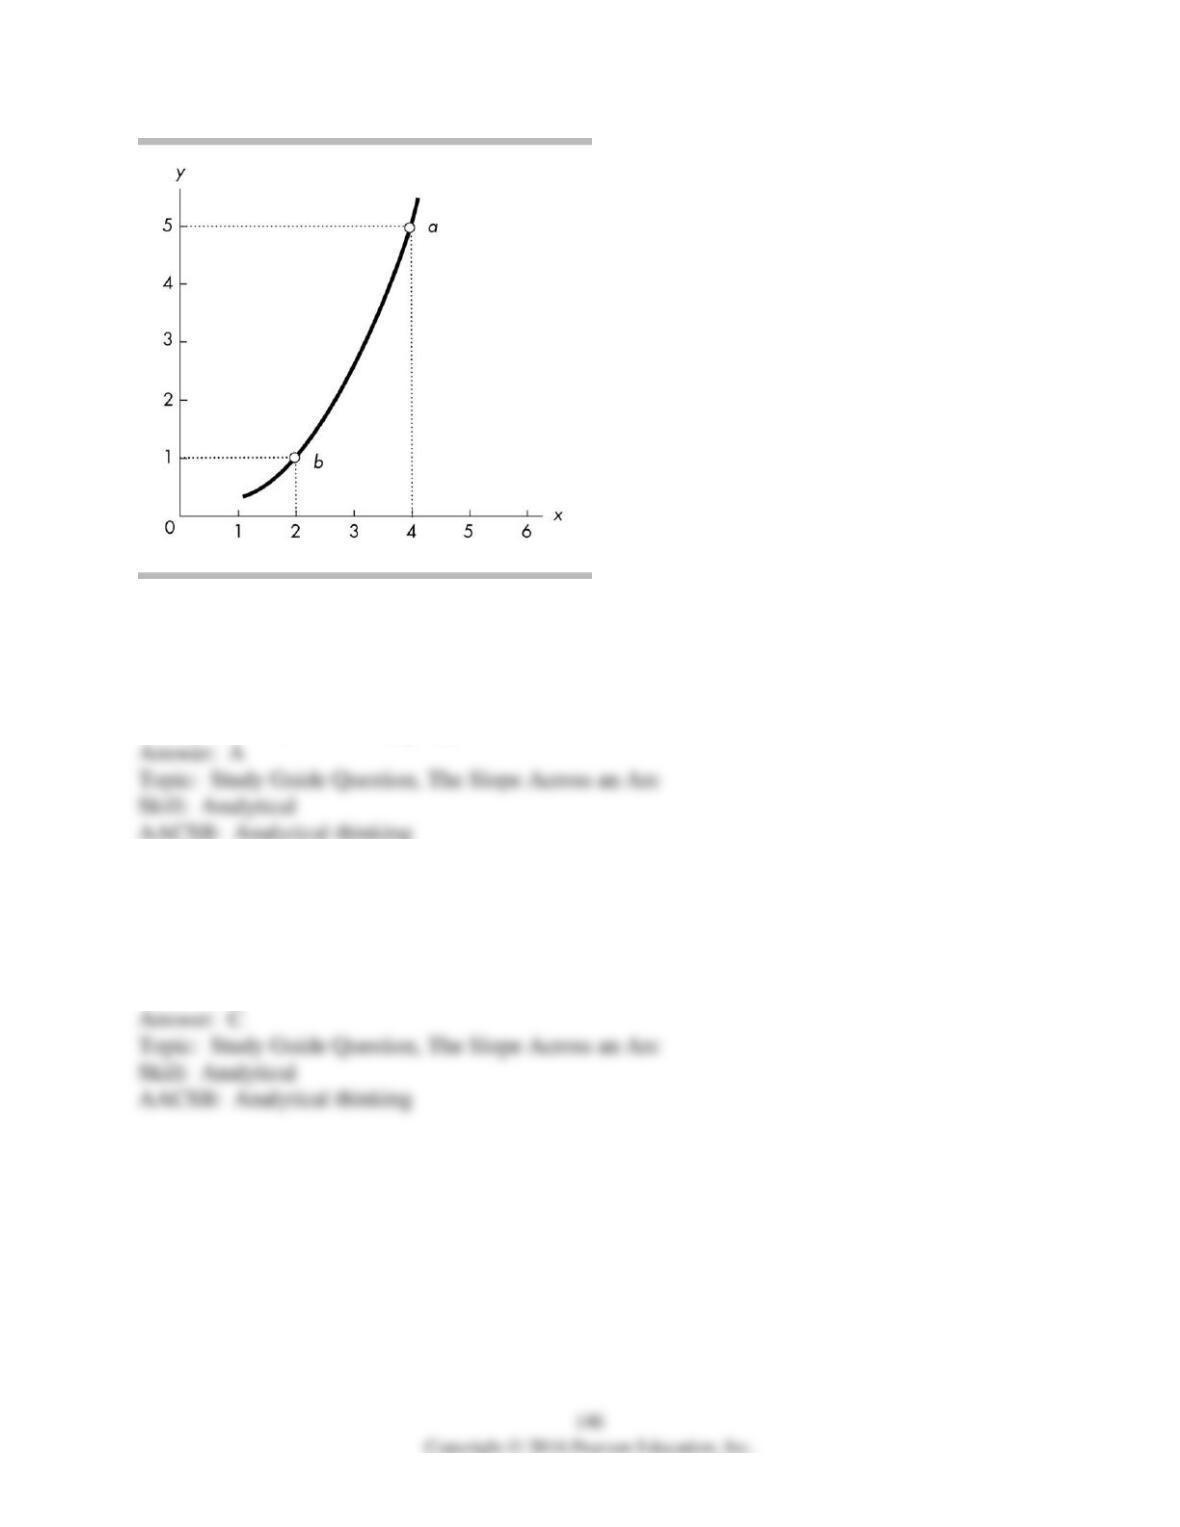
80) The relationship between x and y in the above figure is
A) positive with an increasing slope.
B) positive with a decreasing slope.
C) negative with an increasing slope.
D) negative with a decreasing slope.
81) In the above figure, the slope across the arc between points a and b equals
A) 5.
B) 4.
C) 2.
D) 1.
13 Appendix: Graphing Relationships Among More Than Two Variables
1) Ceteris paribus when graphing a relationship refers to
A) letting all the variables change at once.
B) changing the origin of the graph.
C) holding constant all but two variables.
D) rescaling the coordinates.
2) In evaluating a relationship between x and y, ceteris paribus means other variables
A) are not relevant to x and y.
B) move in opposite directions to x and y.
C) are not changing while x and y change.
D) move in the same direction as x and y.
3) On a graph showing the relationship between x and y, the ceteris paribus condition implies
that
A) no other variables are related to x and y.
B) the value of x is held constant.
C) the value of y is held constant.
D) other variables not shown are held constant.
4) Assume that the quantity consumed of pizza is dependent on three factors: the price of a pizza,
the income of pizza purchasers, and consumers’ taste for pizza. When graphing the relationship
between the price of a pizza and the quantity of pizza consumed
A) the price of a pizza and the income of pizza consumers are the only variables that are allowed
to change.
B) the price of pizza and quantity consumed of pizza are the only variables that are allowed to
change.
C) consumers’ taste for pizza and the income of pizza purchasers are the only variables that are
allowed to change.
D) None of the above answers are correct.
5) To graph a relationship among several variables, we hold all but ________ variable(s)
constant and use the ________ assumption.
A) one; scarcity
B) two; ceteris paribus
C) three; marginal benefit
D) one; ceteris paribus
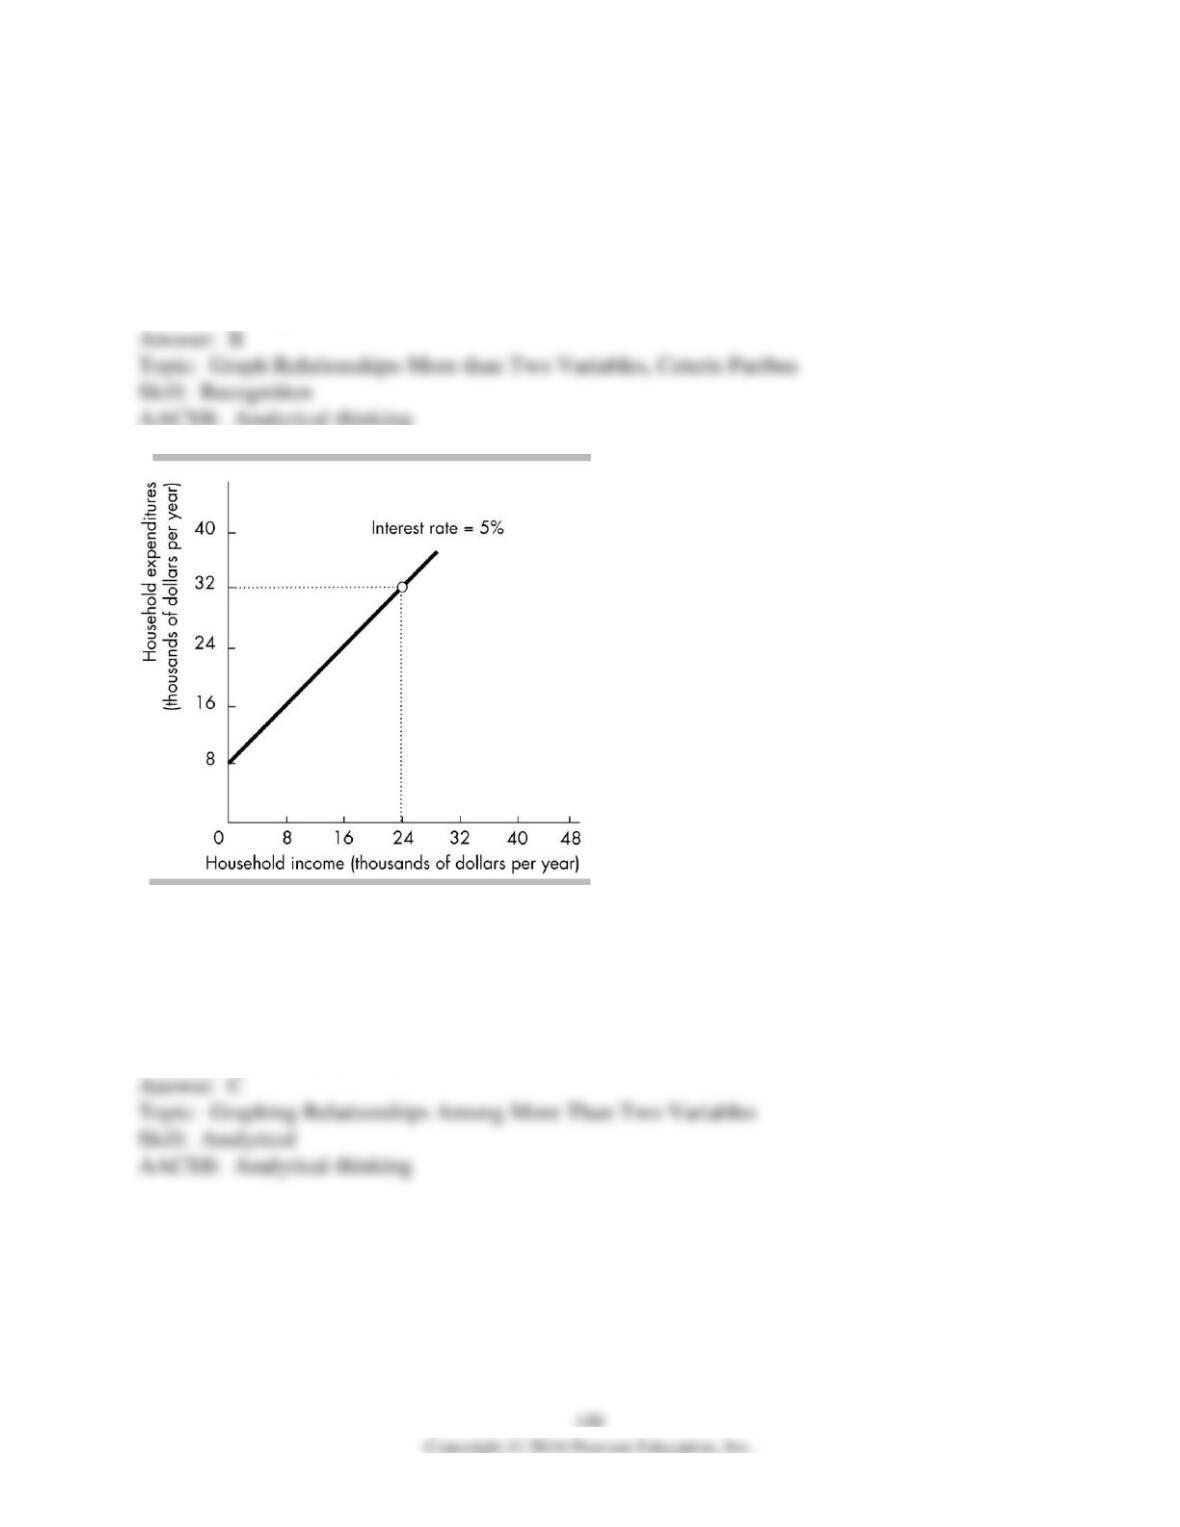
6) In the above figure, while moving along the line showing the relationship between household
income and expenditure
A) household expenditures are held constant.
B) household income is held constant.
C) the interest rate is held constant.
D) no variable is held constant.
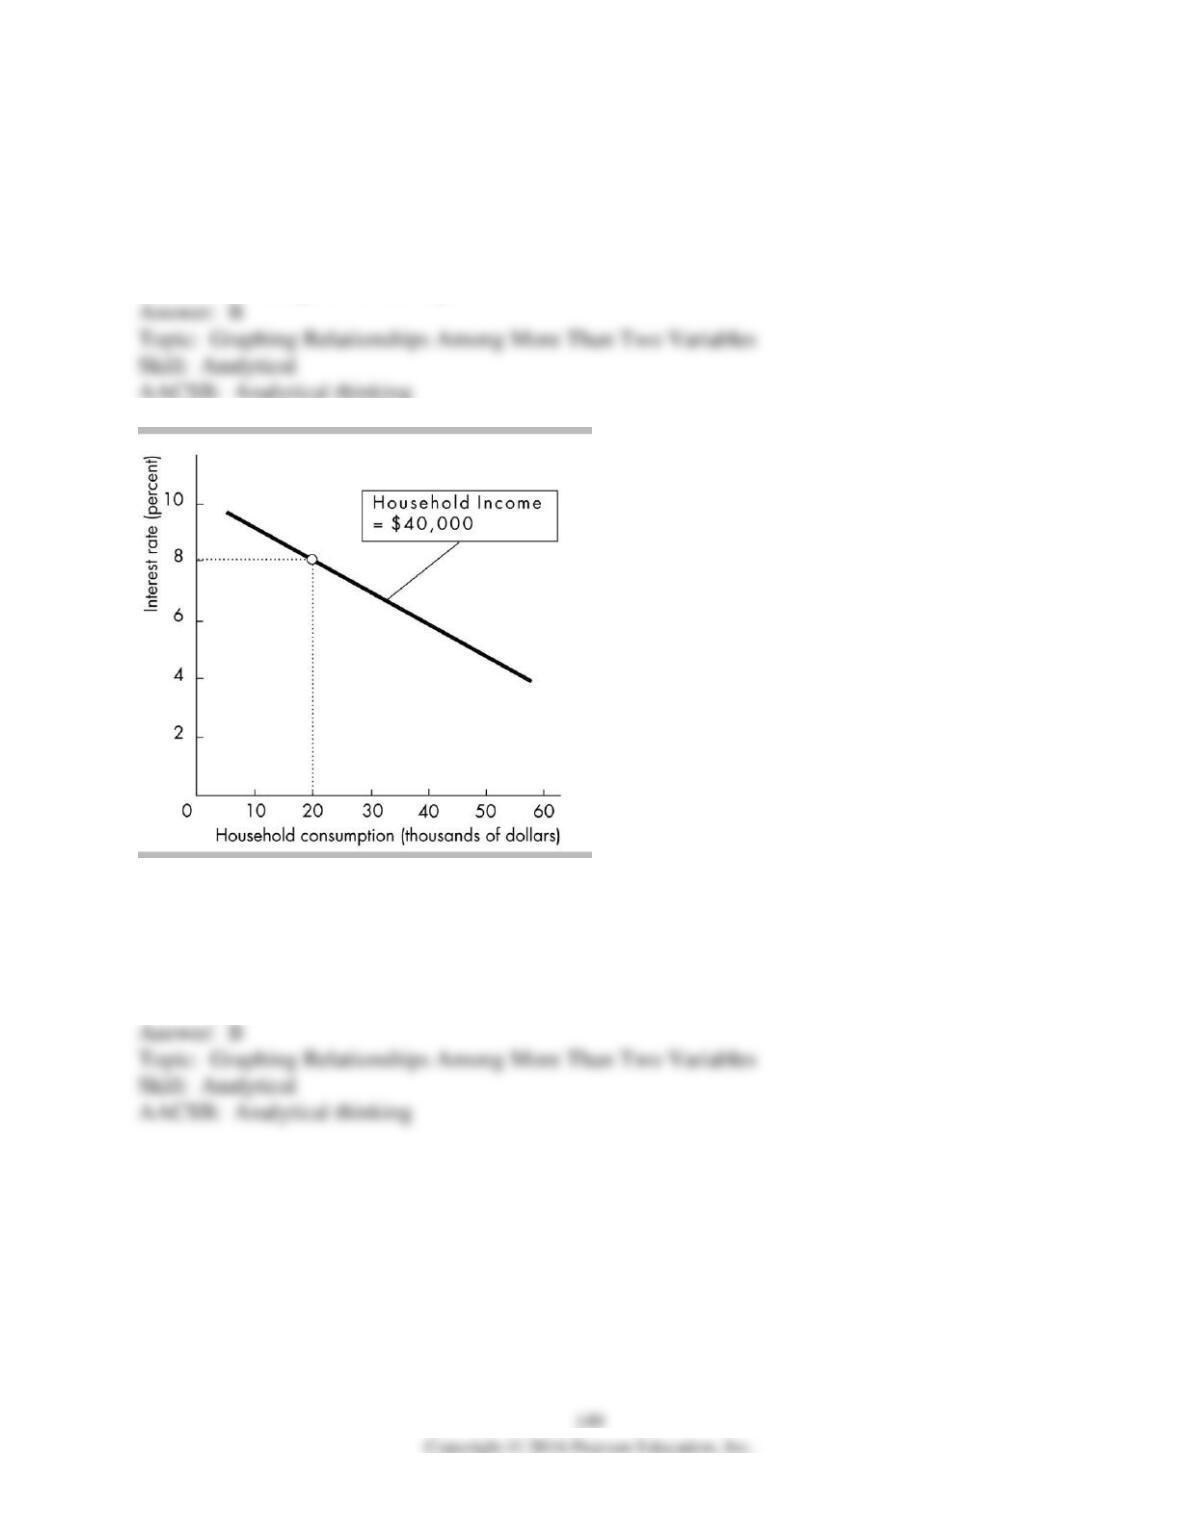
7) In the above figure, if the interest rate is negatively related to household expenditures for any
given level of household income, an increase in the interest rate will
A) shift the line vertically upward.
B) shift the line vertically downward.
C) make the line negatively sloped.
D) cause no change in the line’s position.
8) The slope of the line in the above figure is
A) positive.
B) negative.
C) direct.
D) independent.
9) In the above figure, when the interest rate is 8 percent and household income is $40,000,
household consumption is
A) $0.
B) $20,000.
C) $35.000.
D) $60,000.
10) The relationship in the above figure indicates that
A) a decrease in the interest rate leads to a decrease in household income.
B) a decrease in household consumption leads to a decrease in interest rates.
C) a decrease in household income will lead household consumption to increase.
D) none of the above.
11) Household consumption depends on both income and interest rates. In the above figure
A) household consumption is held constant.
B) interest rates are held constant.
C) household income is held constant.
D) no variable is held constant.
12) In the above figure, if household consumption is positively related to household income, then
an increase in household income will
A) shift the line rightward.
B) shift the line leftward.
C) make the line positively sloped.
D) cause a movement along the line.
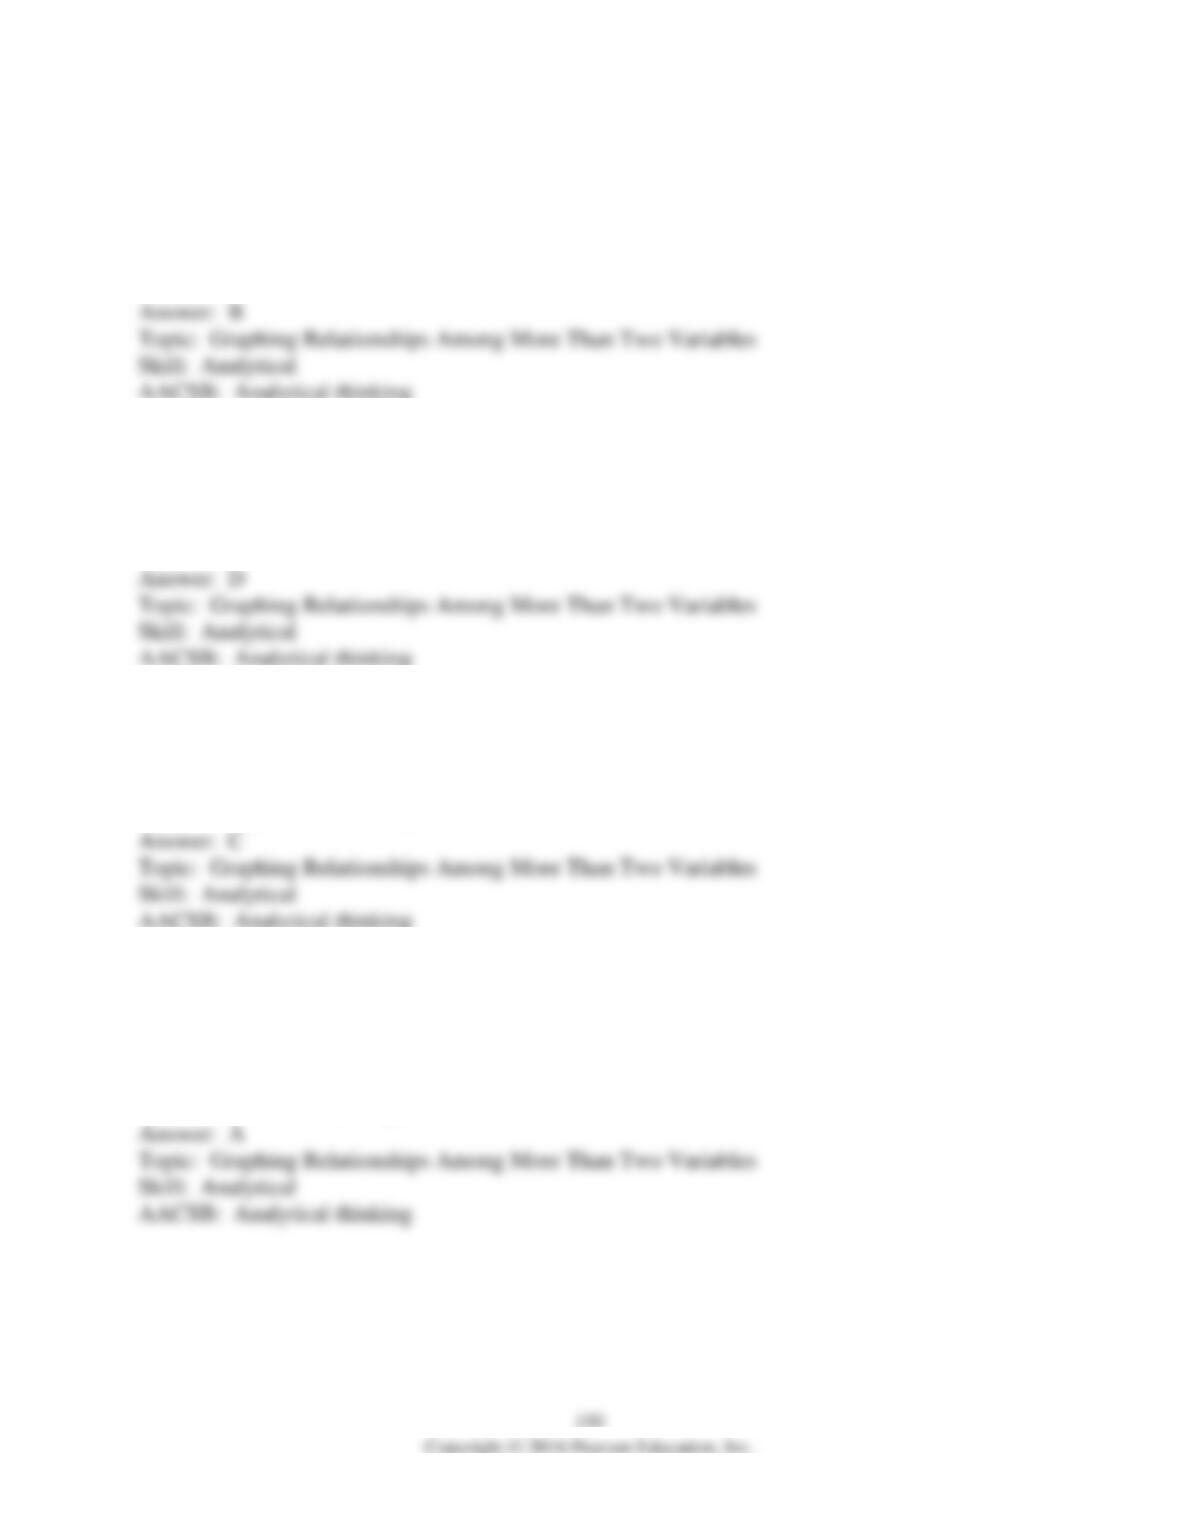
13) The above figure shows how many pounds of peanuts farmers are willing to sell at different
prices per pound of peanuts. If the price of a pound of peanuts is $1 and the price of a pound of
pecans is $2, peanut farmers are willing to sell
A) no peanuts.
B) 1000 pounds of peanuts.
C) 2000 pounds of peanuts.
D) 4000 pounds of peanuts.
14) In the above figure, while drawing the line showing the relationship between the price of a
pound of peanuts and the quantity sold, the
A) price of a pound of pecans is held constant.
B) price of a pound of peanuts is held constant.
C) quantity of peanuts that farmers supply is constant.
D) Both answers A and B are true.
15) In the figure above, suppose the price of a pound of pecans is negatively related to the
quantity of peanuts that farmers are willing to supply. If the price of pecans increases
A) the curve will shift rightward.
B) the curve will shift leftward.
C) there is a movement along the curve.
D) the curve will be unaffected.
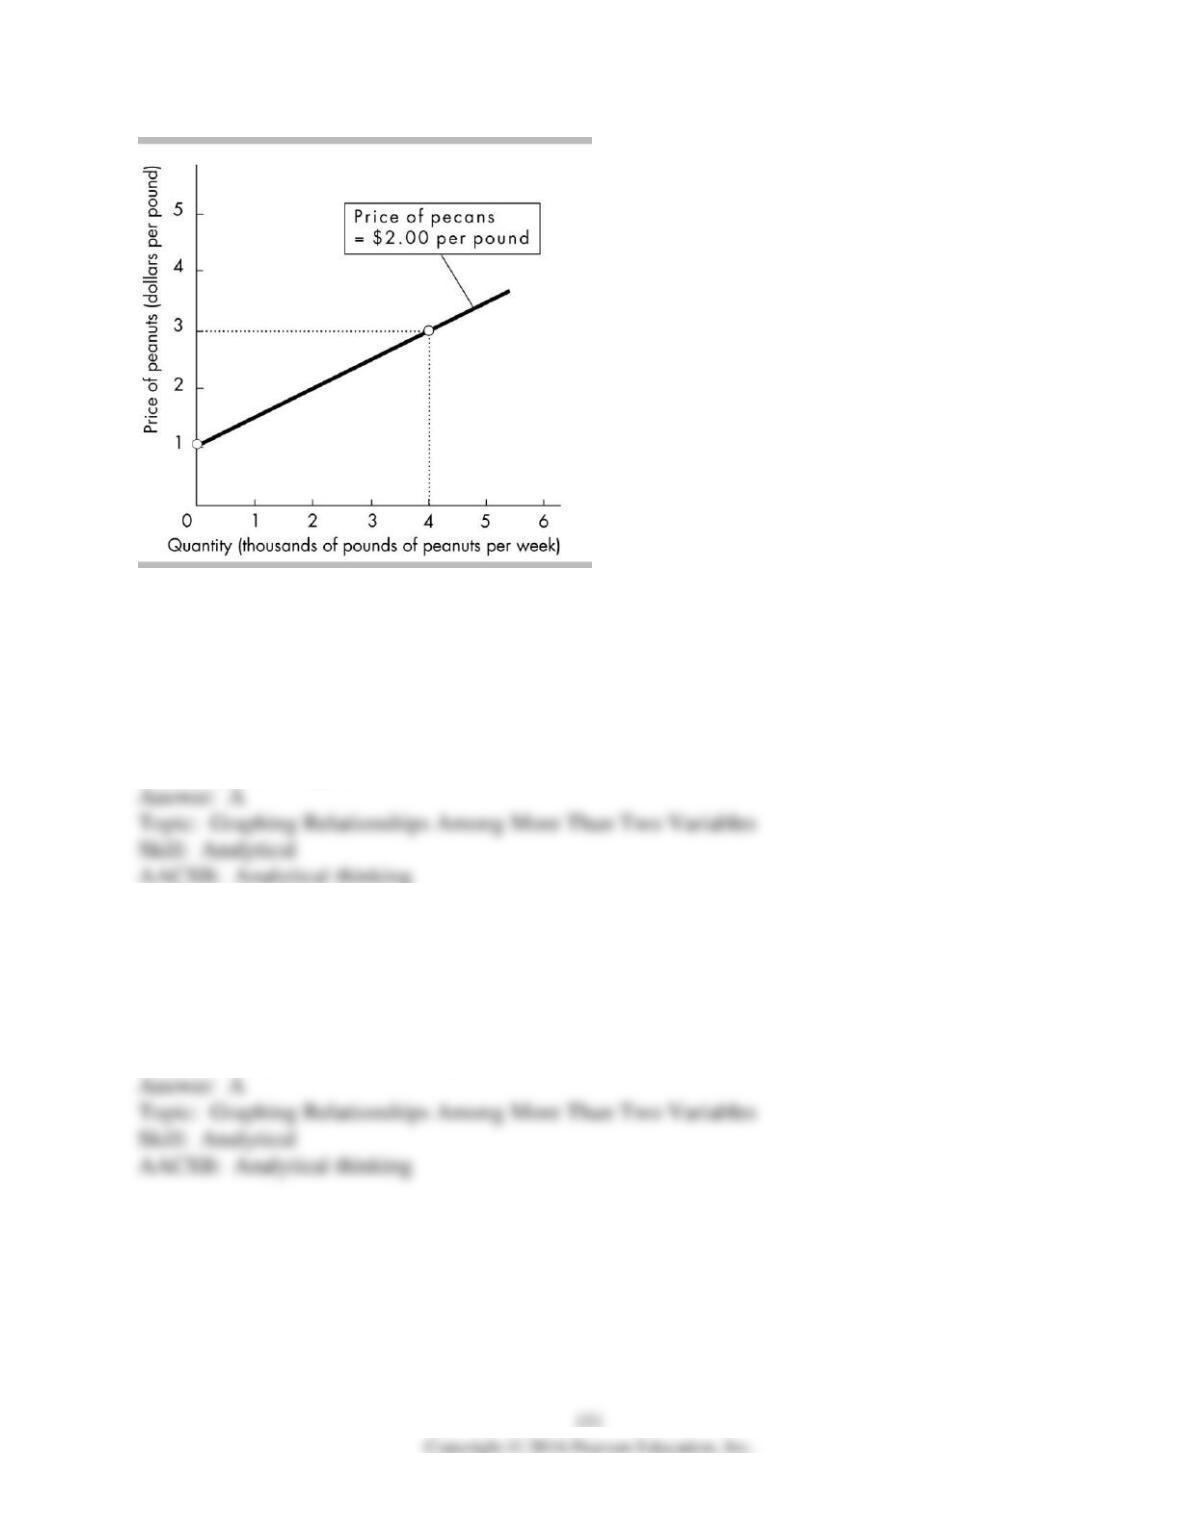
16) In the above figure, x is
A) positively related to y and negatively related to z.
B) positively related to both y and z.
C) negatively related to y and positively related to z.
D) negatively related to both y and z.
17) In the figure above, ceteris paribus, an increase in x is associated with
A) an increase in y.
B) a decrease in y.
C) a decrease in z.
D) None of the above answers is correct.
18) In the figure above, an increase in z leads to a
A) movement up along one of the lines showing the relationship between x and y.
B) movement down along one of the lines showing the relationship between x and y.
C) rightward shift of the line showing the relationship between x and y.
D) leftward shift of the line showing the relationship between x and y.
1) Why do economists use graphs?
2) What are the two different types of relationships that variables can have? Explain each. What
do these relationships look like when they are graphed?
3) What is the difference between a positive and a negative relationship?
4) A graph of two variables is a vertical line. What is the interpretation of this result?
5) What does the slope of a straight line equal? How is the slope of a curved line calculated at a
point on the curve?
6) “It is impossible to represent a three variable relationship in a two-dimensional graph.” Is this
statement true or false? Explain your answer.
15 Appendix: Numeric and Graphing Questions
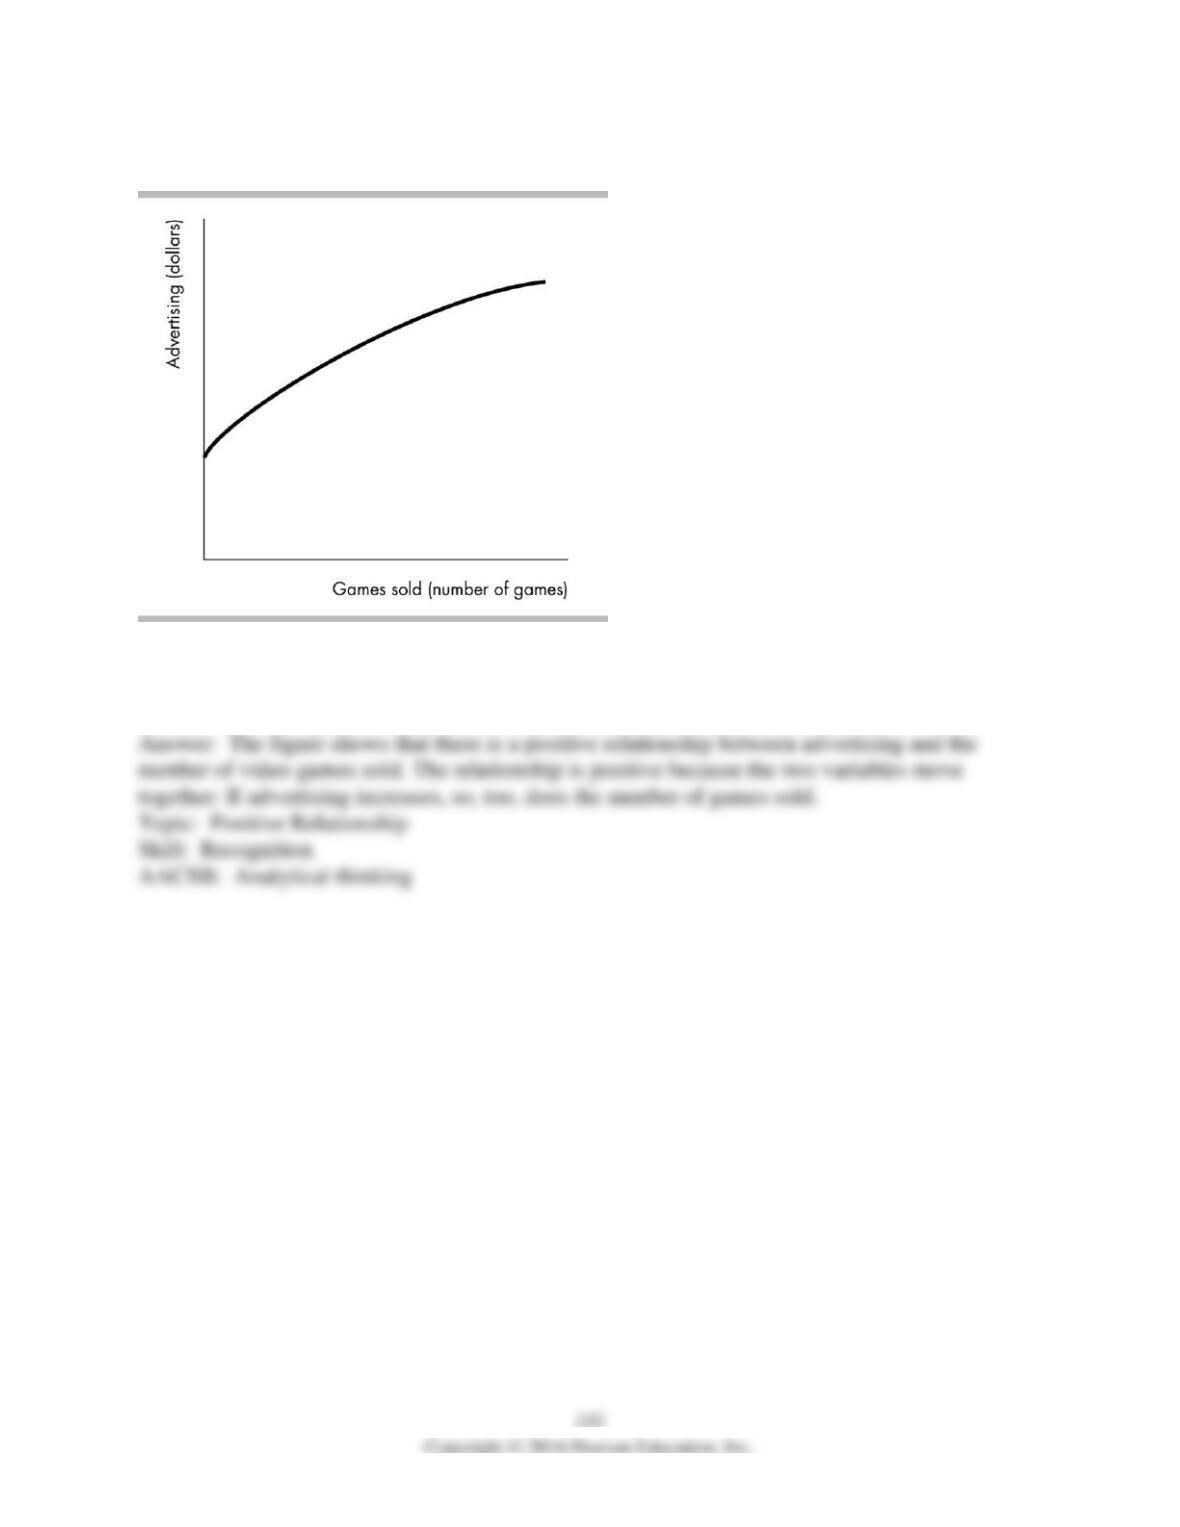
1) The figure above shows how the sales of the video game “Tomb Raider—Lara Retires”
change when the advertising spent on the game changes. Is the relationship between advertising
and the number of games sold positive, negative, or neither? Explain your answer.
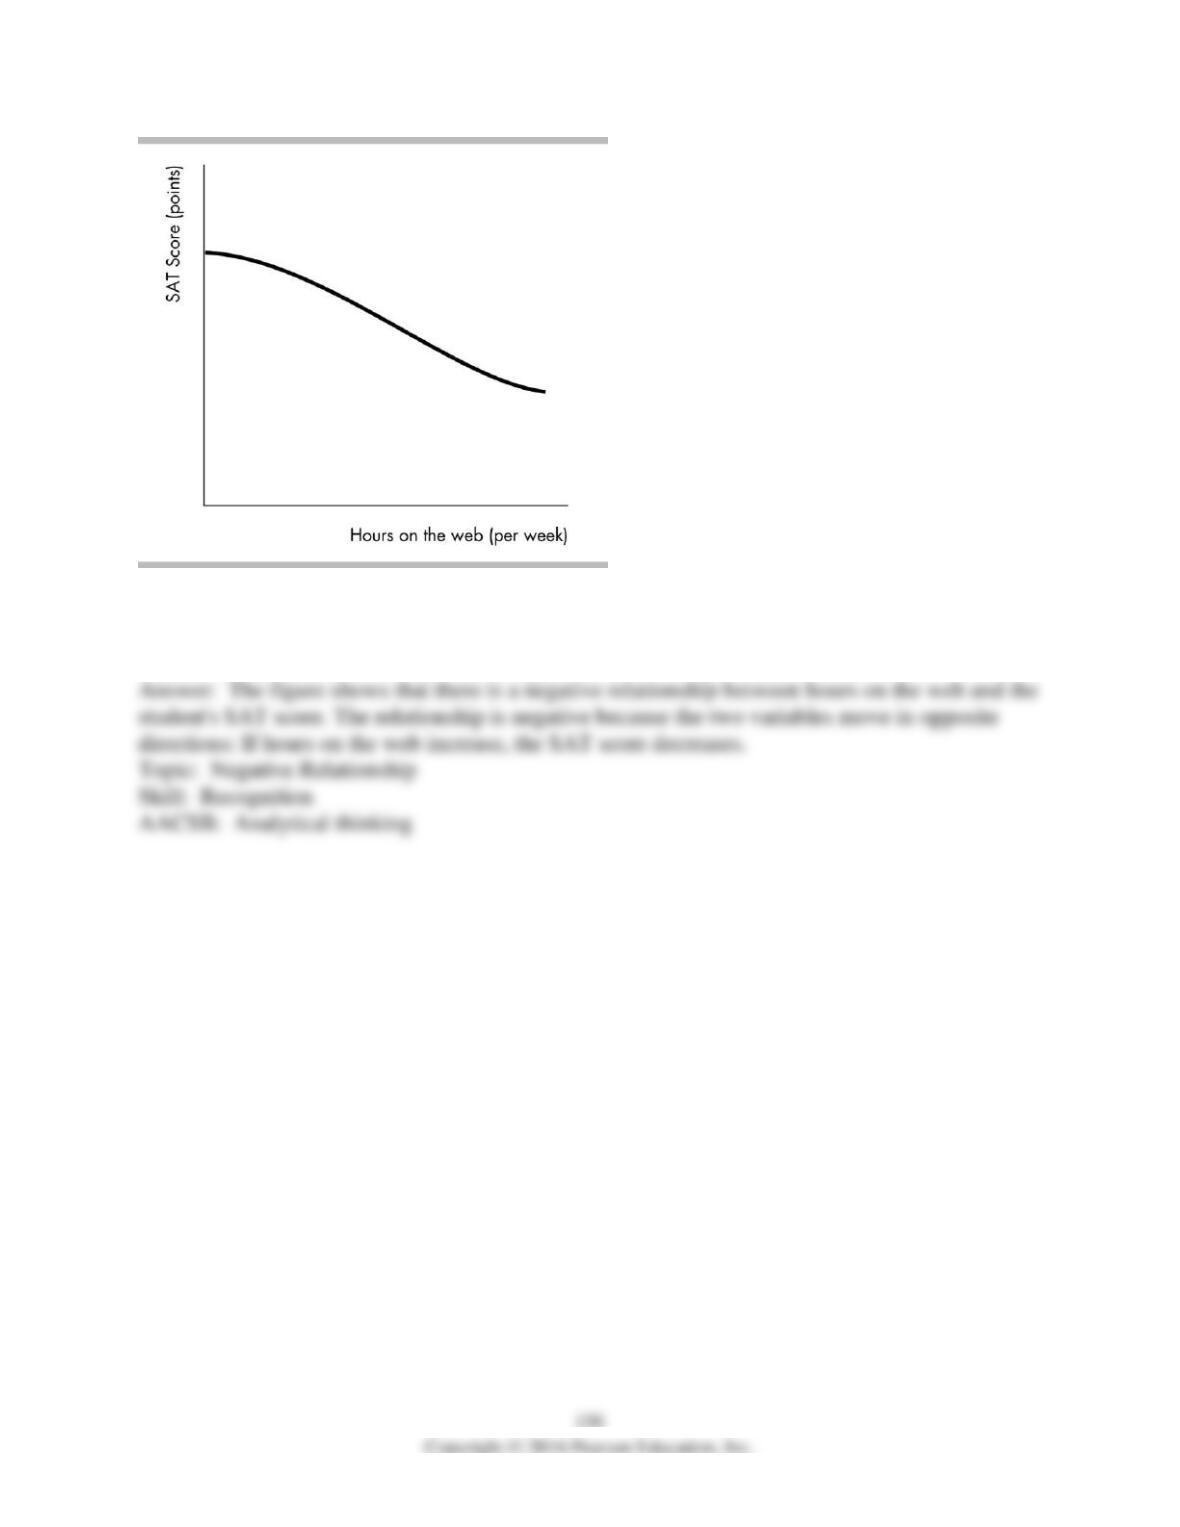
2) The figure above shows how the relationship between the number of hours per week a high
school student spends on the web and the student’s SAT score. Is the relationship between hours
on the web and the SAT score positive, negative, neither? Explain your answer.