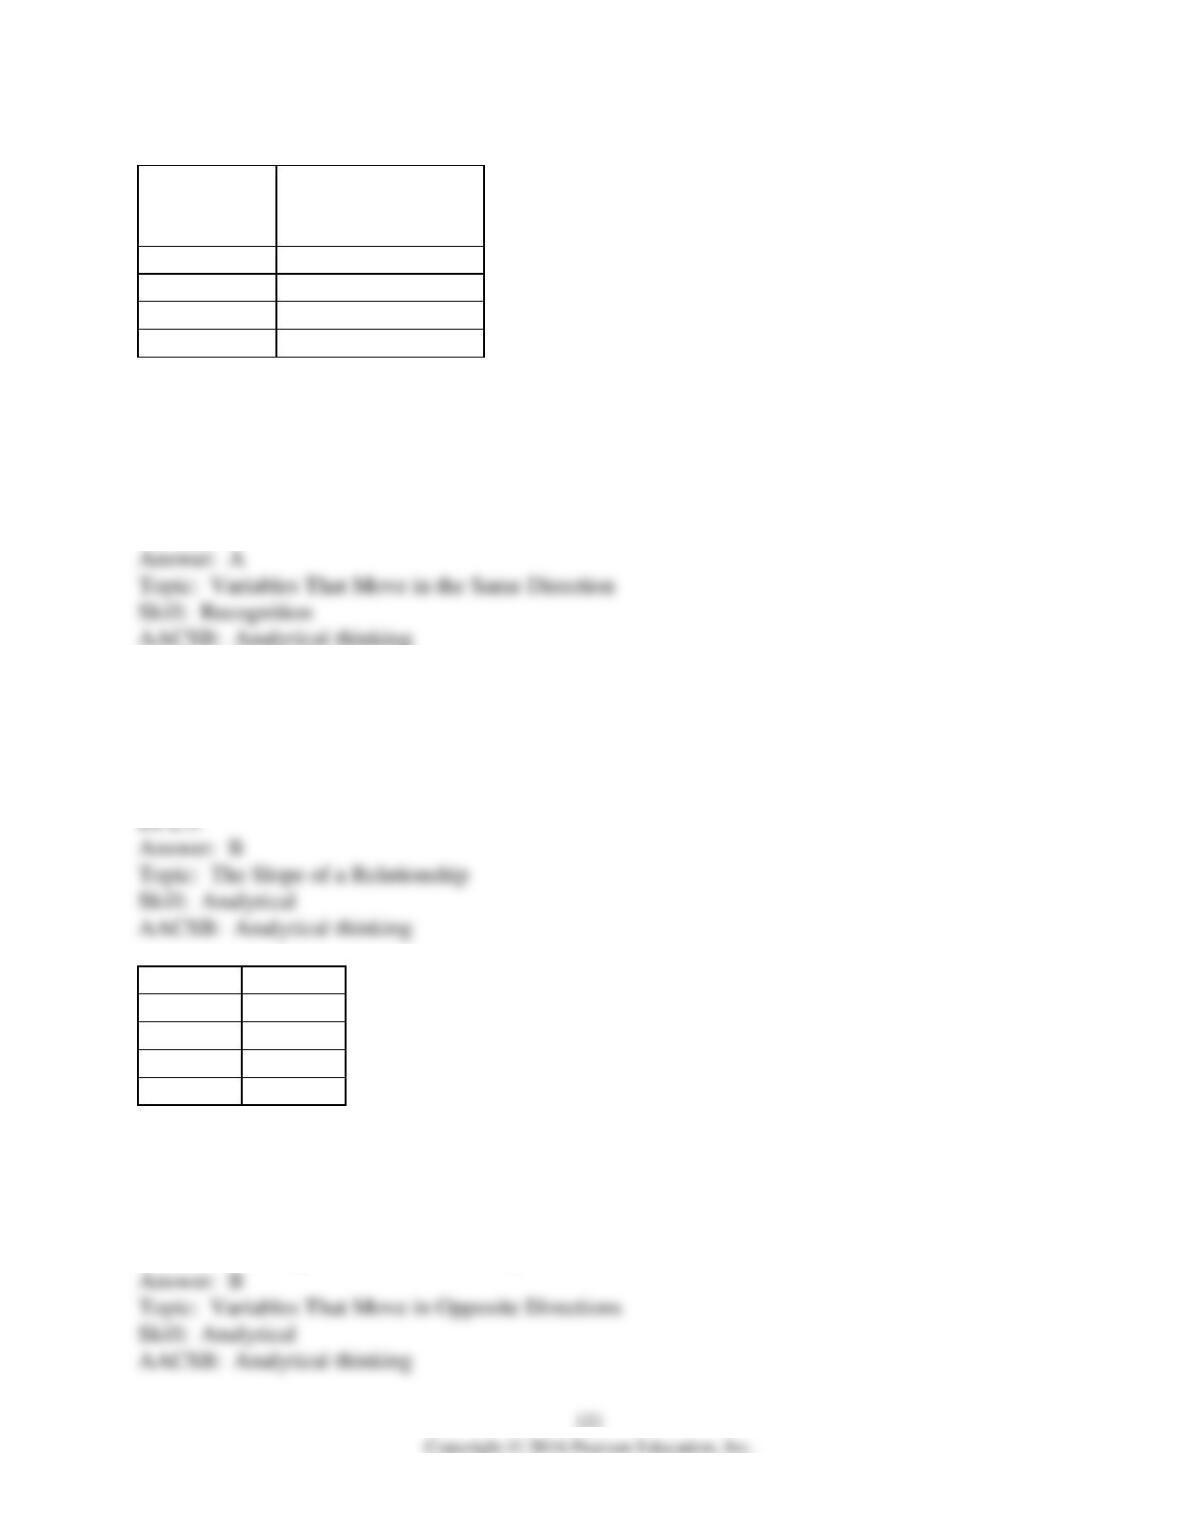
Income
(dollars per
month)
Amount spent on
restaurant meals
(dollars per month)
50
20
100
40
150
60
200
80
35) Using the data in the above table, if income is on the x-axis and the amount spent on
restaurant meals is on the y-axis, the graph of the two variables would be
A) upward sloping.
B) downward sloping.
C) vertical.
D) horizontal.
36) Using the data in the above table, if income is on the x-axis and the amount spent on
restaurant meals is on the y-axis, the slope of the straight line graph equals
A) 0.2.
B) 0.4.
C) 0.5.
x
y
100
500
200
300
300
100
400
-100
37) Based on the information in the table above, what is the relationship between x and y?
A) direct
B) inverse
C) positive
D) No relationship exists between x and y.
38) Using the information in the table above, what does the slope of the line between x and y
equal?
A) 5
B) -0.5
C) 2
D) -2
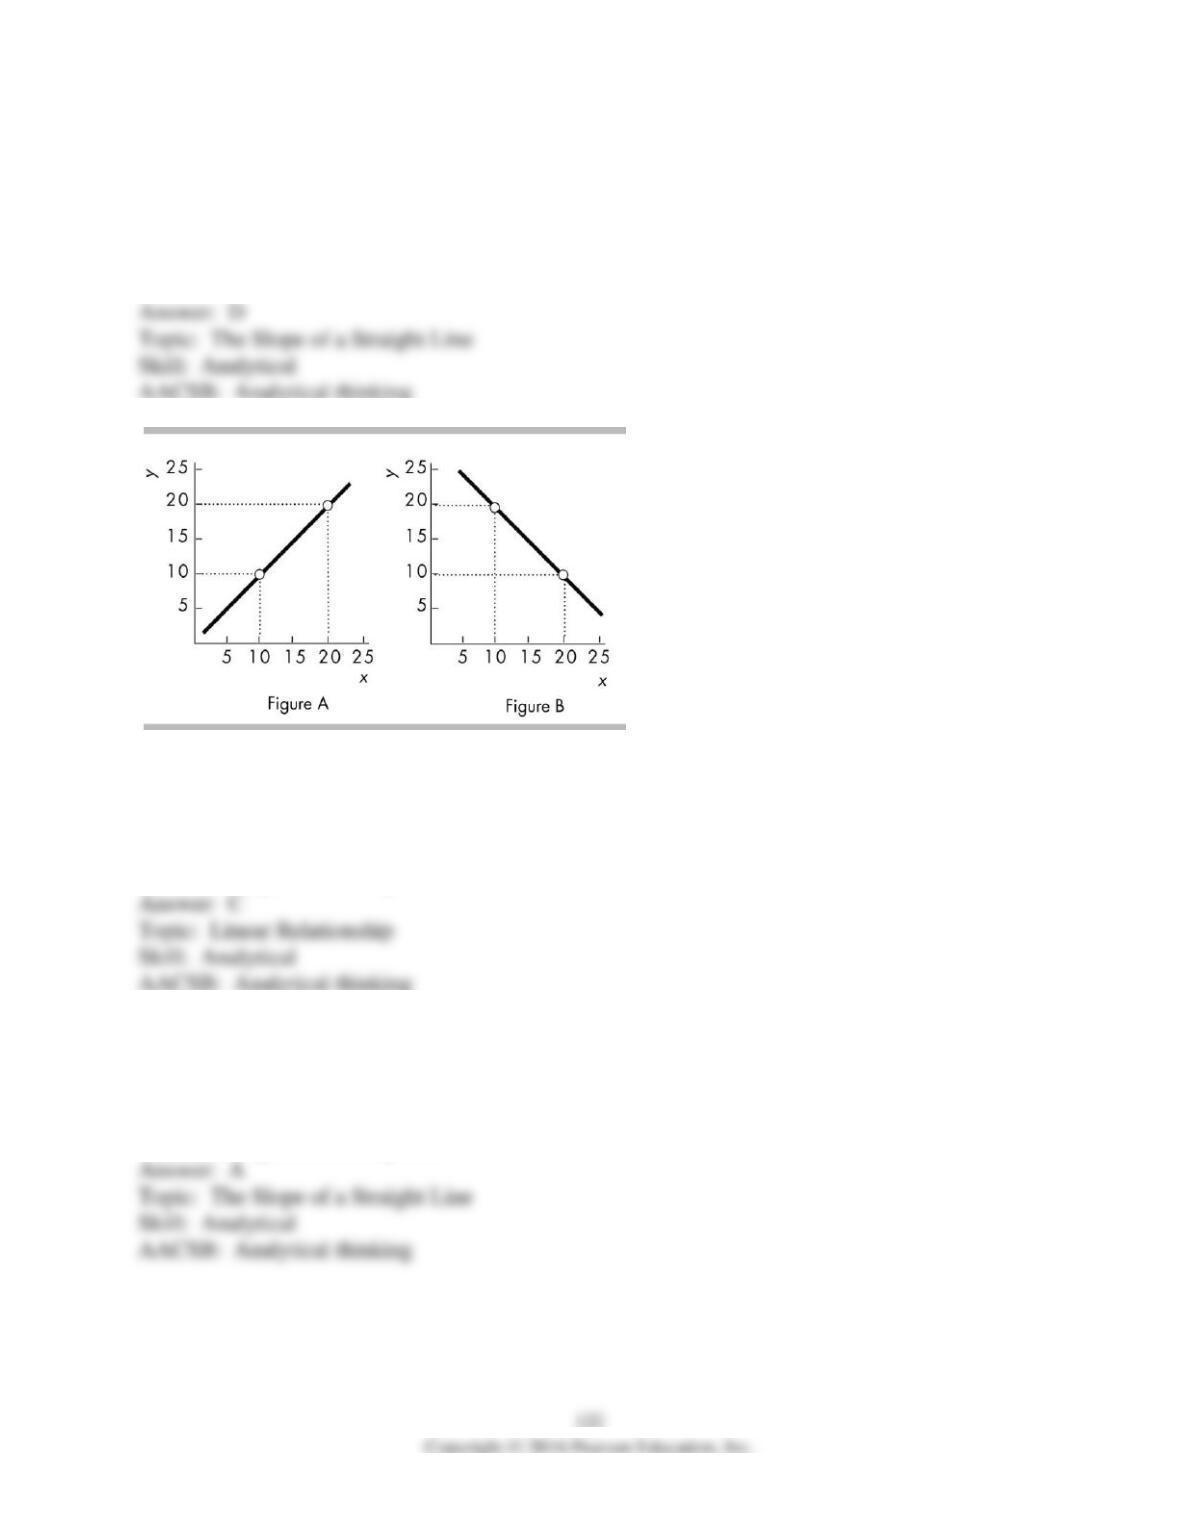
39) In the above, which figure shows a linear relationship?
A) Figure A
B) Figure B
C) both Figure A and Figure B
D) neither Figure A nor Figure B
40) In the above, which figure shows a line with a slope of 1.0?
A) Figure A
B) Figure B
C) both Figure A and Figure B
D) neither Figure A nor Figure B
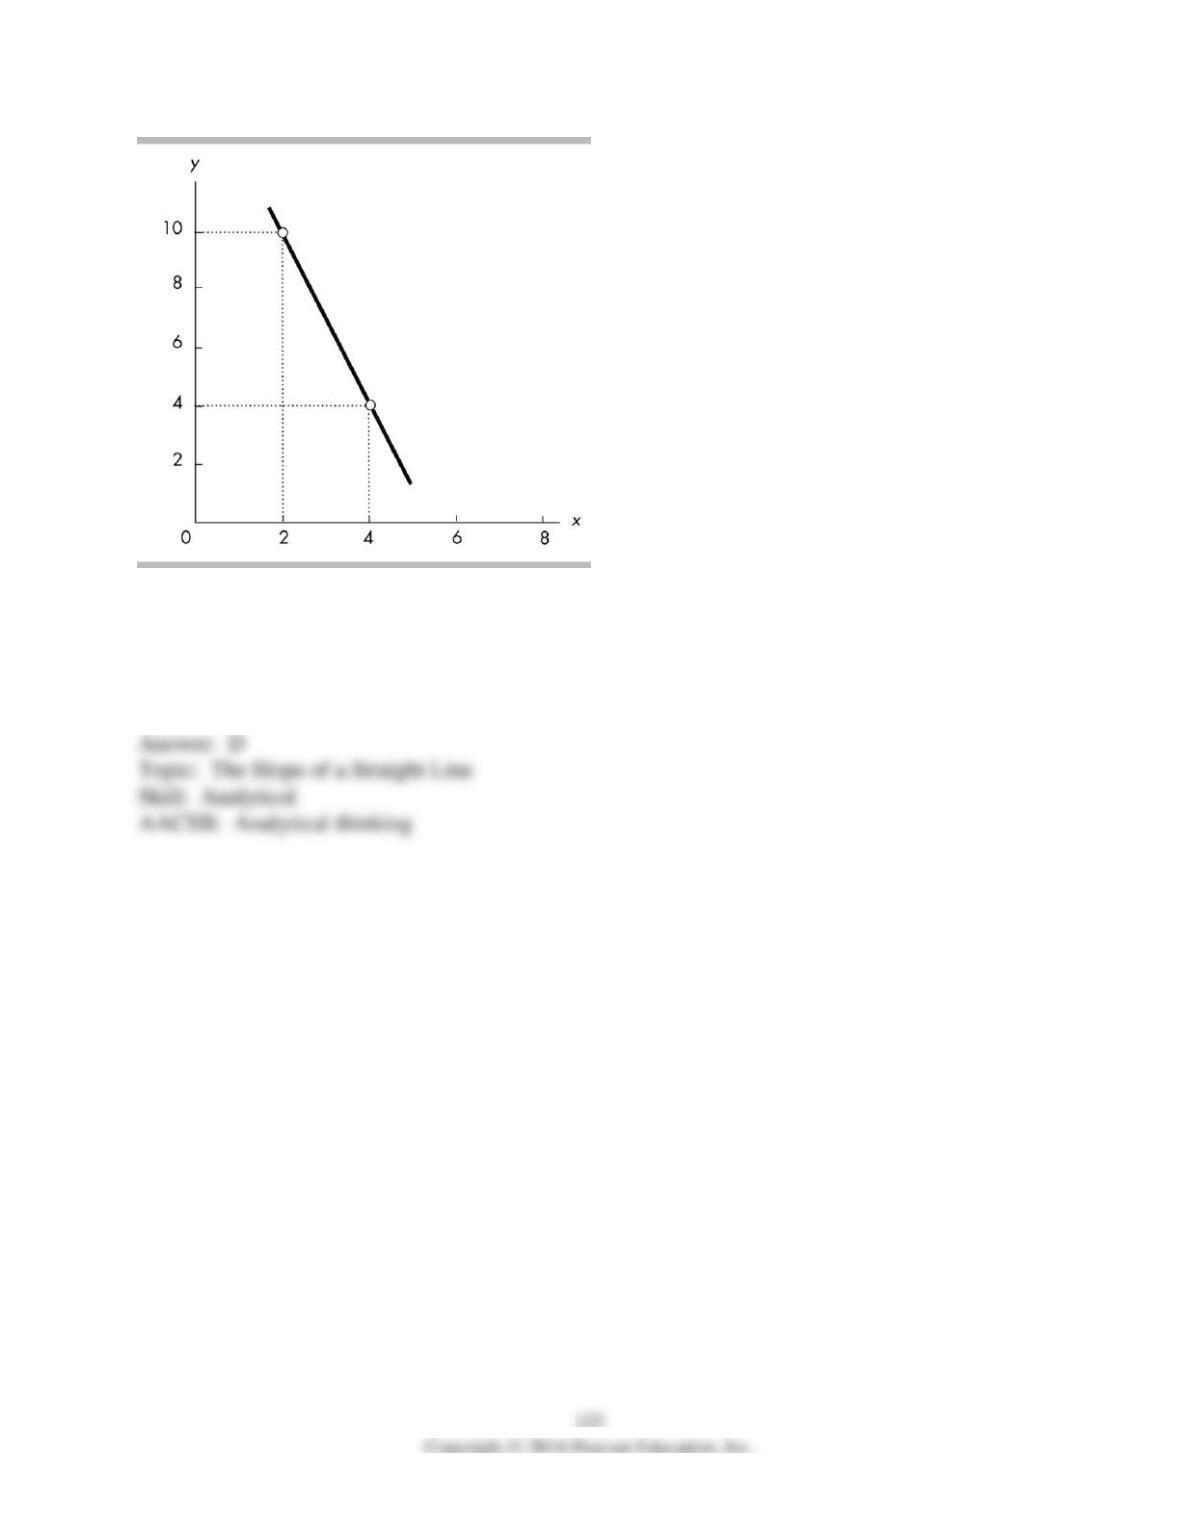
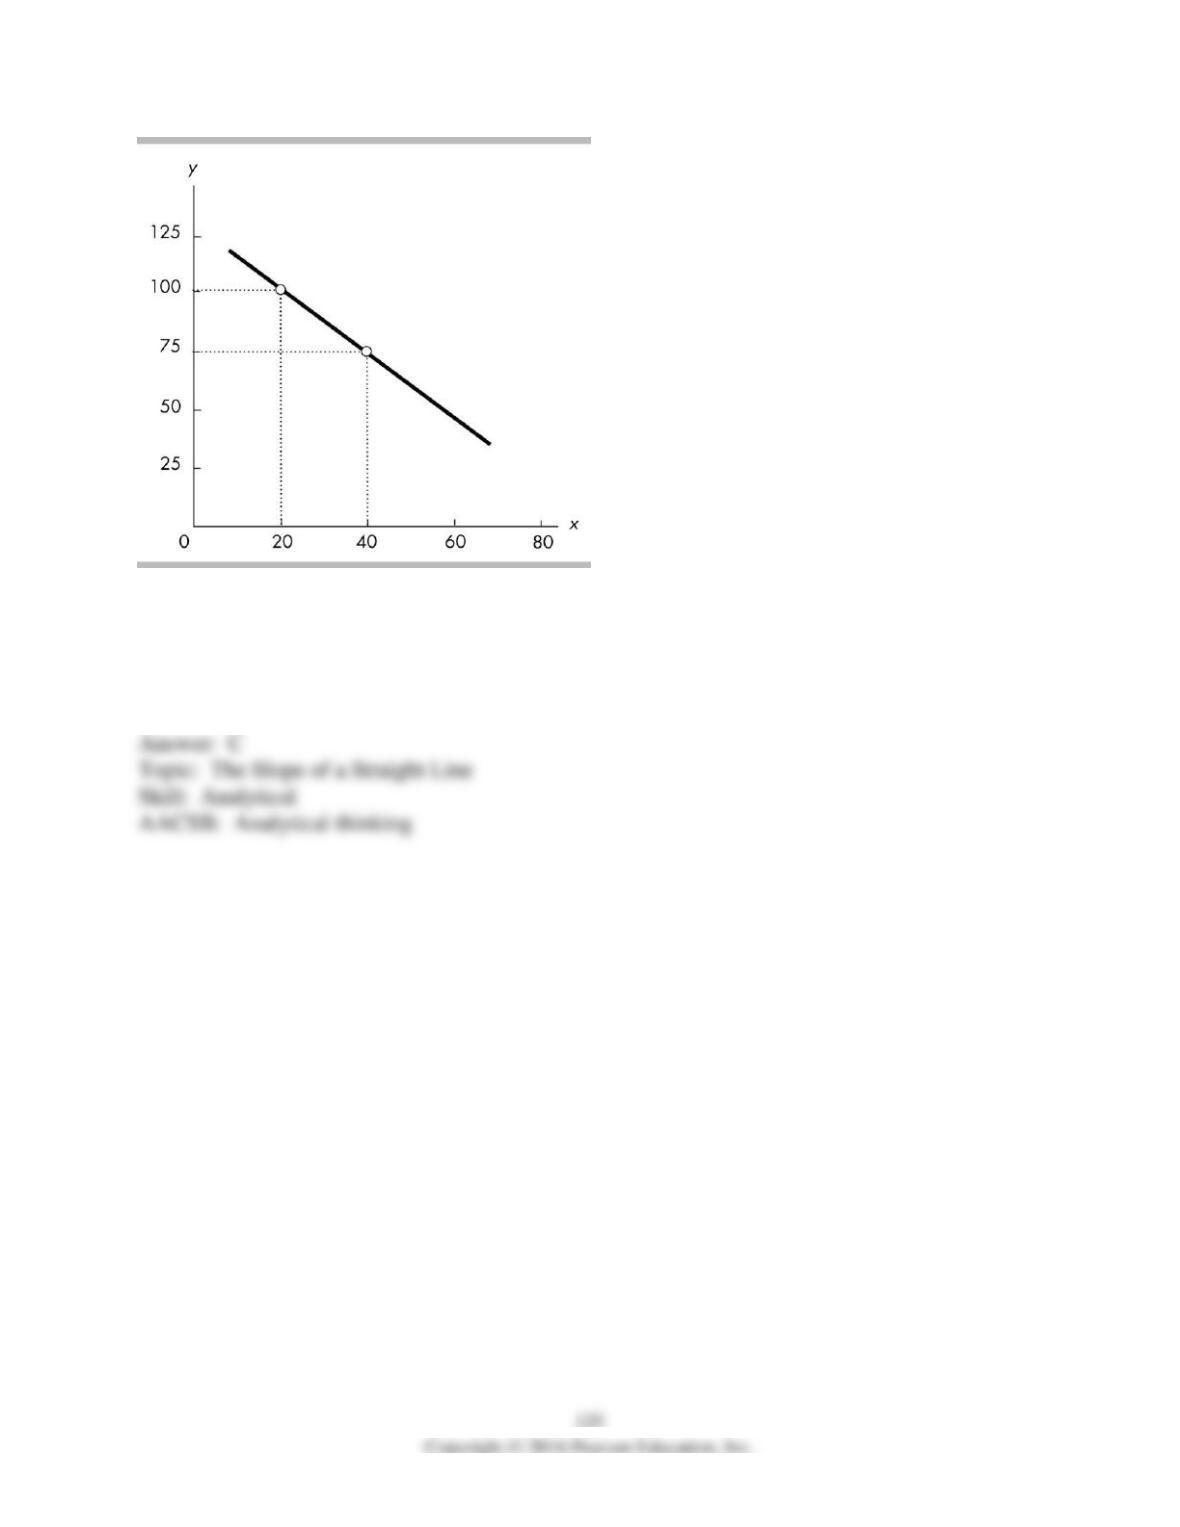
41) The slope of the line shown in the above figure is
A) -1/3.
B) -5.
C) -1.
D) -3.
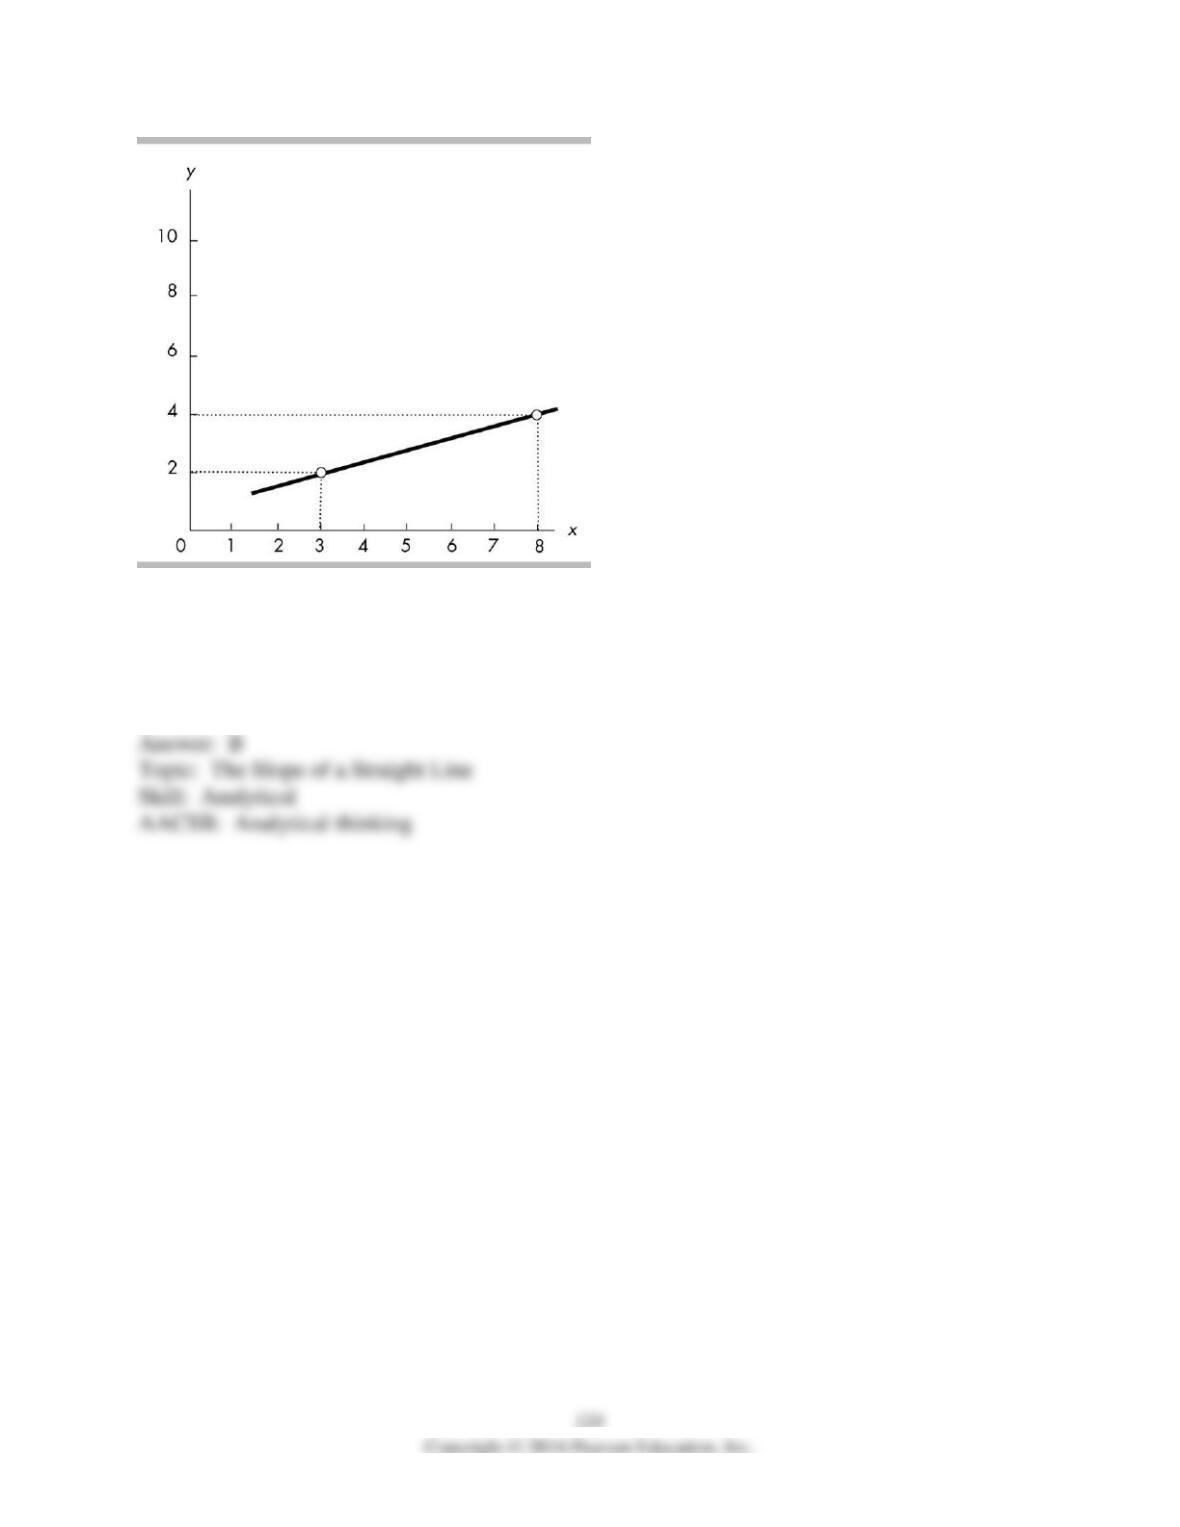
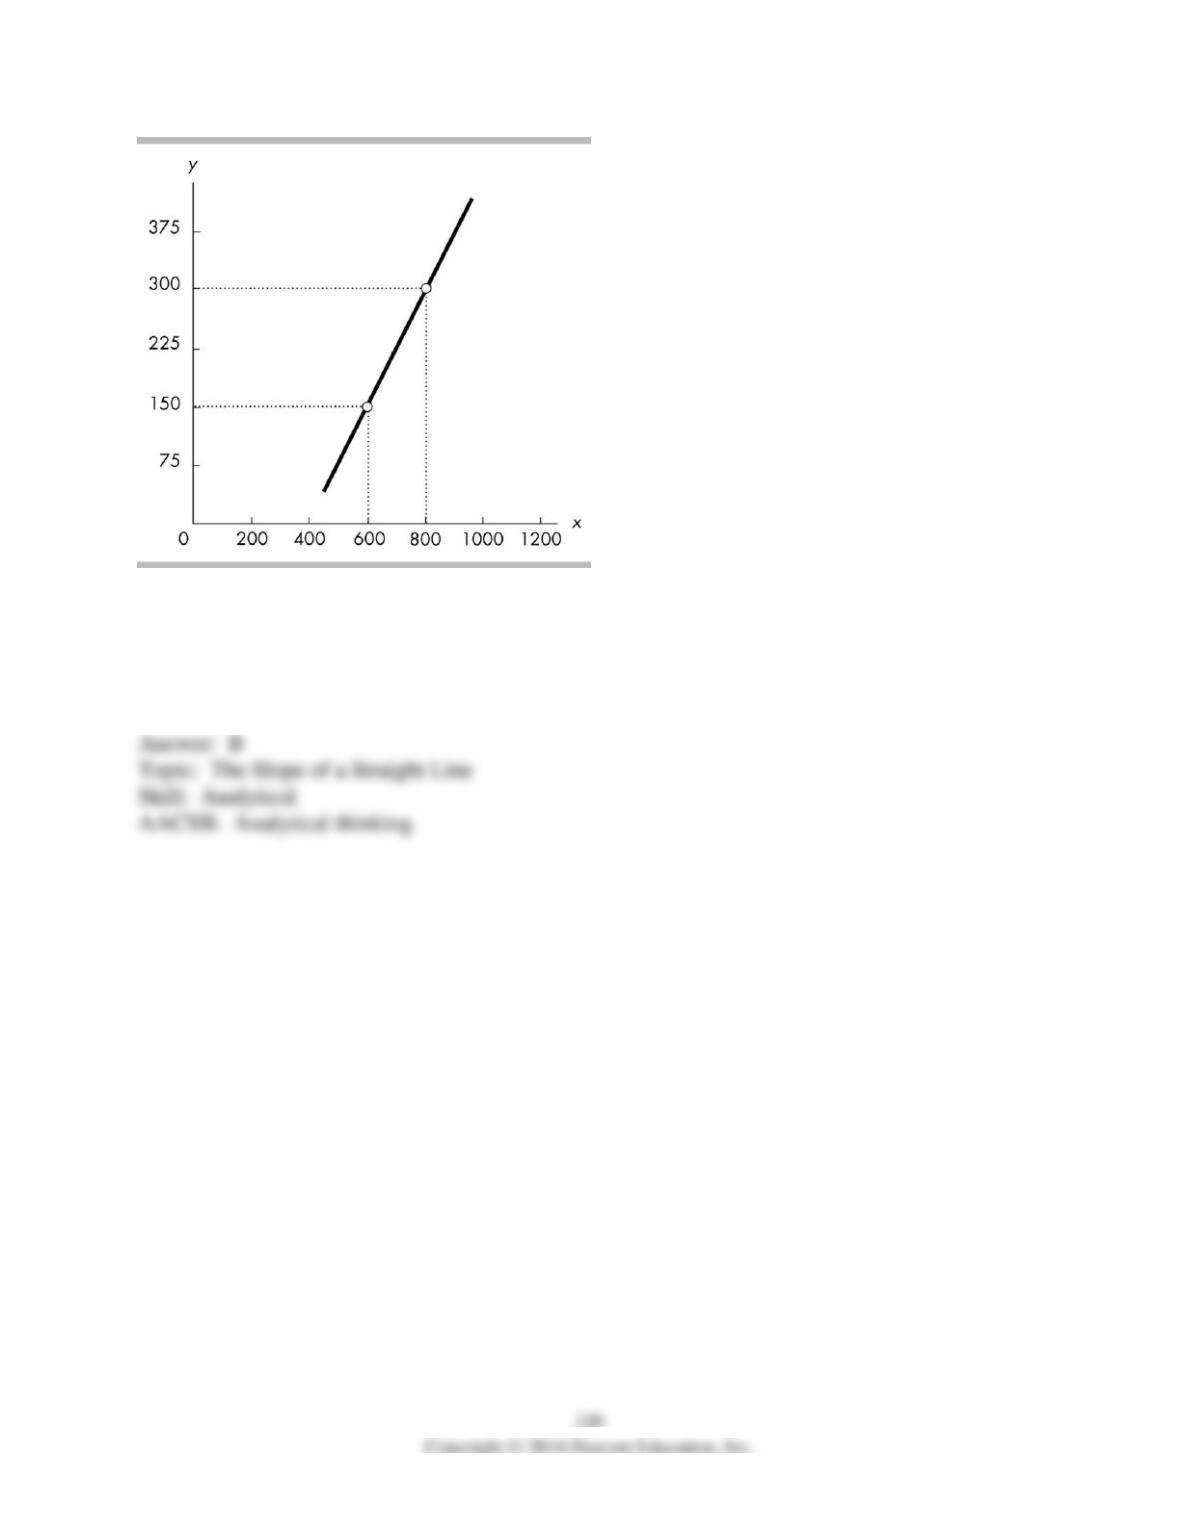
42) The slope of the line shown in the above figure is
A) 5.
B) 2/5.
C) 2/3.
D) 5/2.
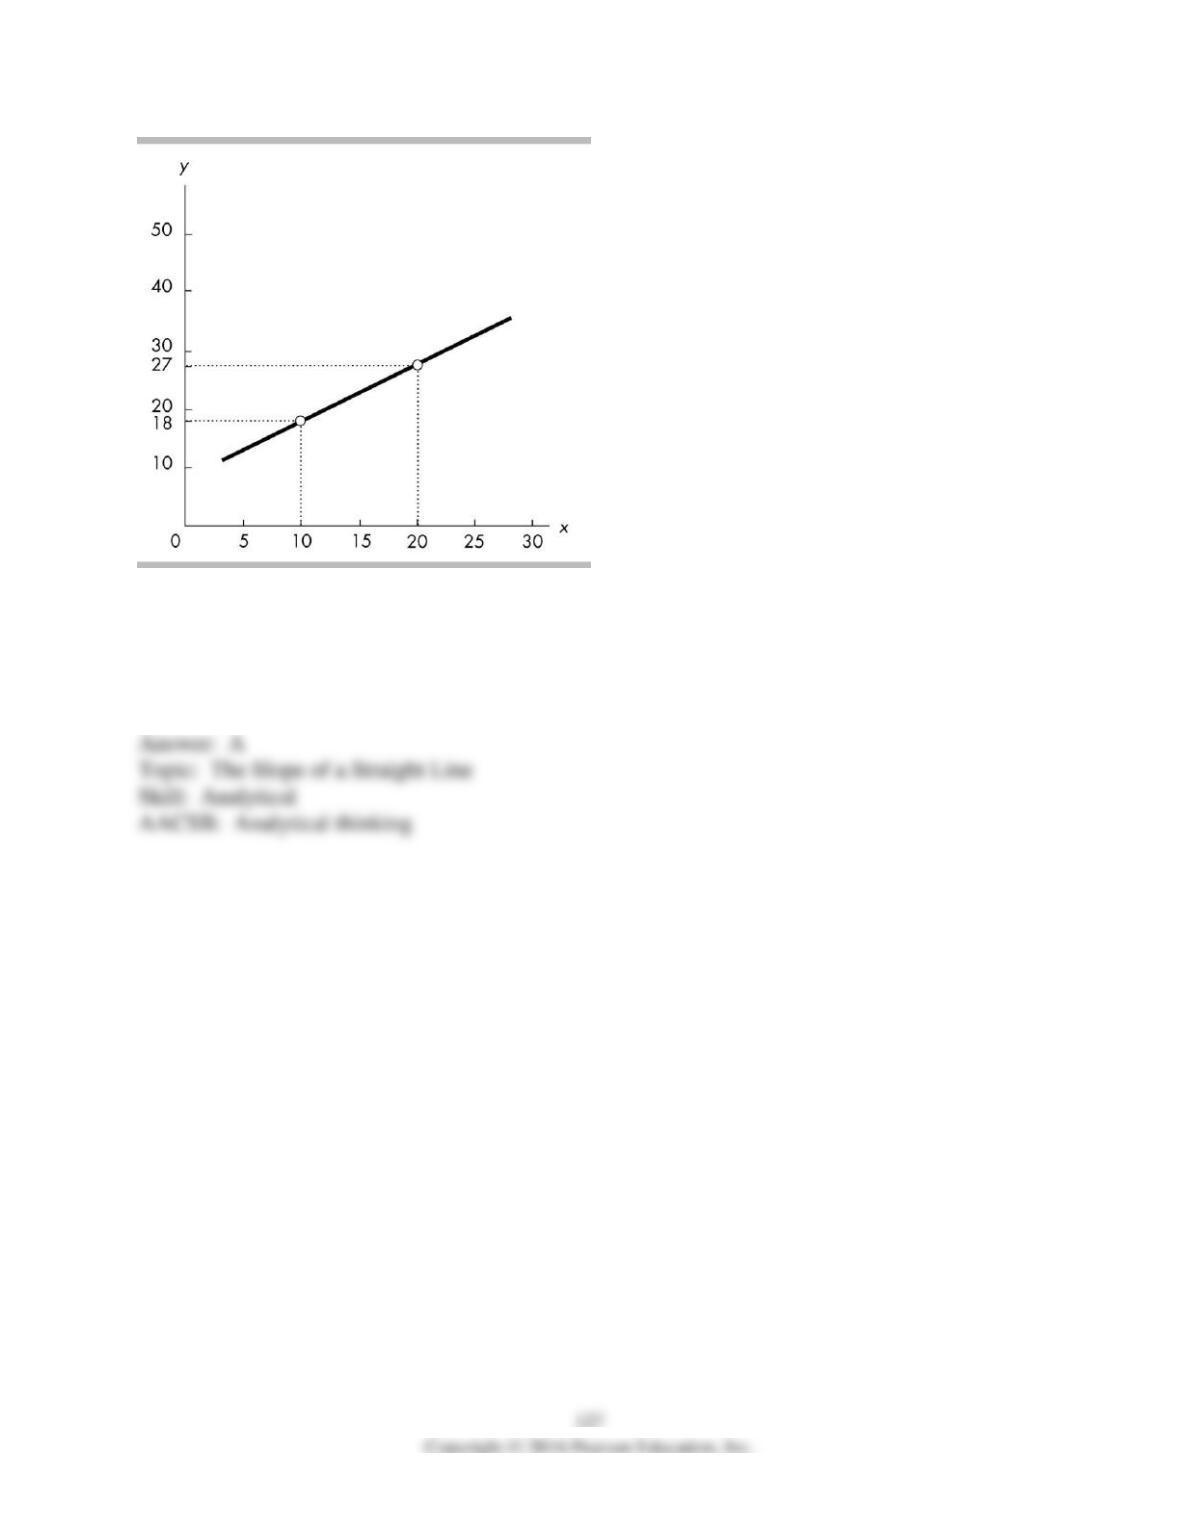
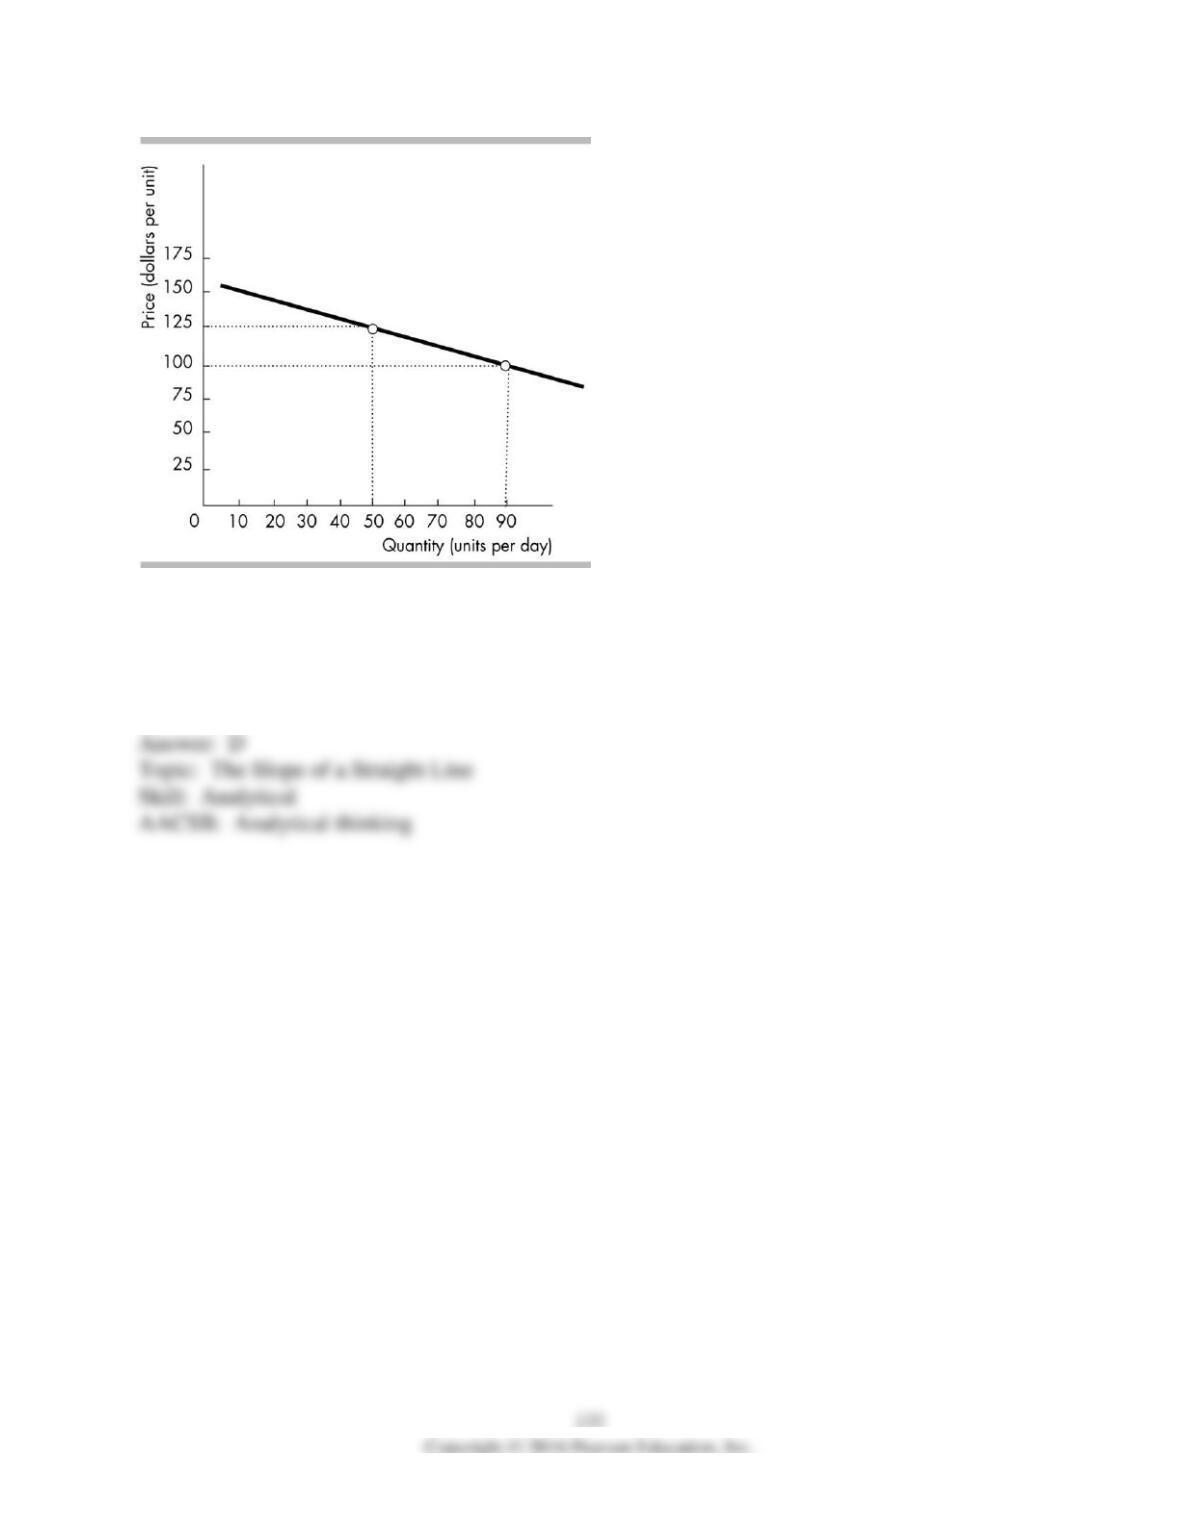
43) The slope of the line shown in the above figure is
A) -1 1/3.
B) -1 2/3.
C) -1.25.
D) -0.80.
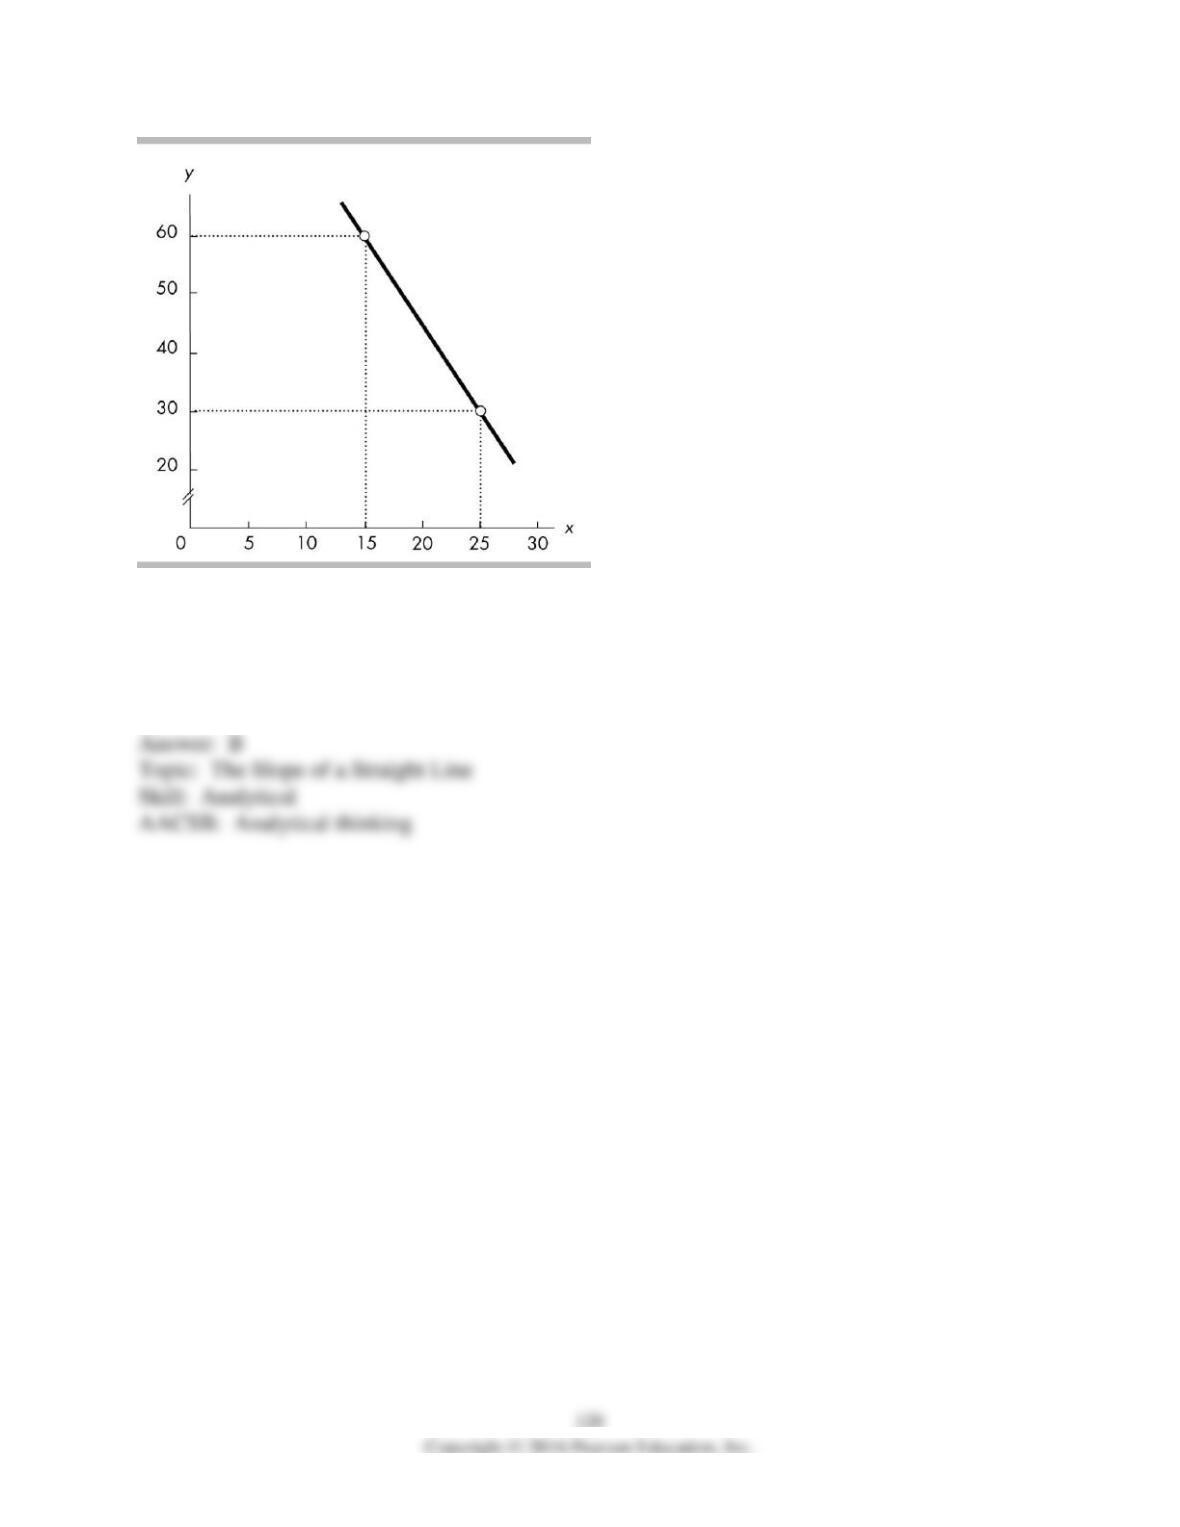
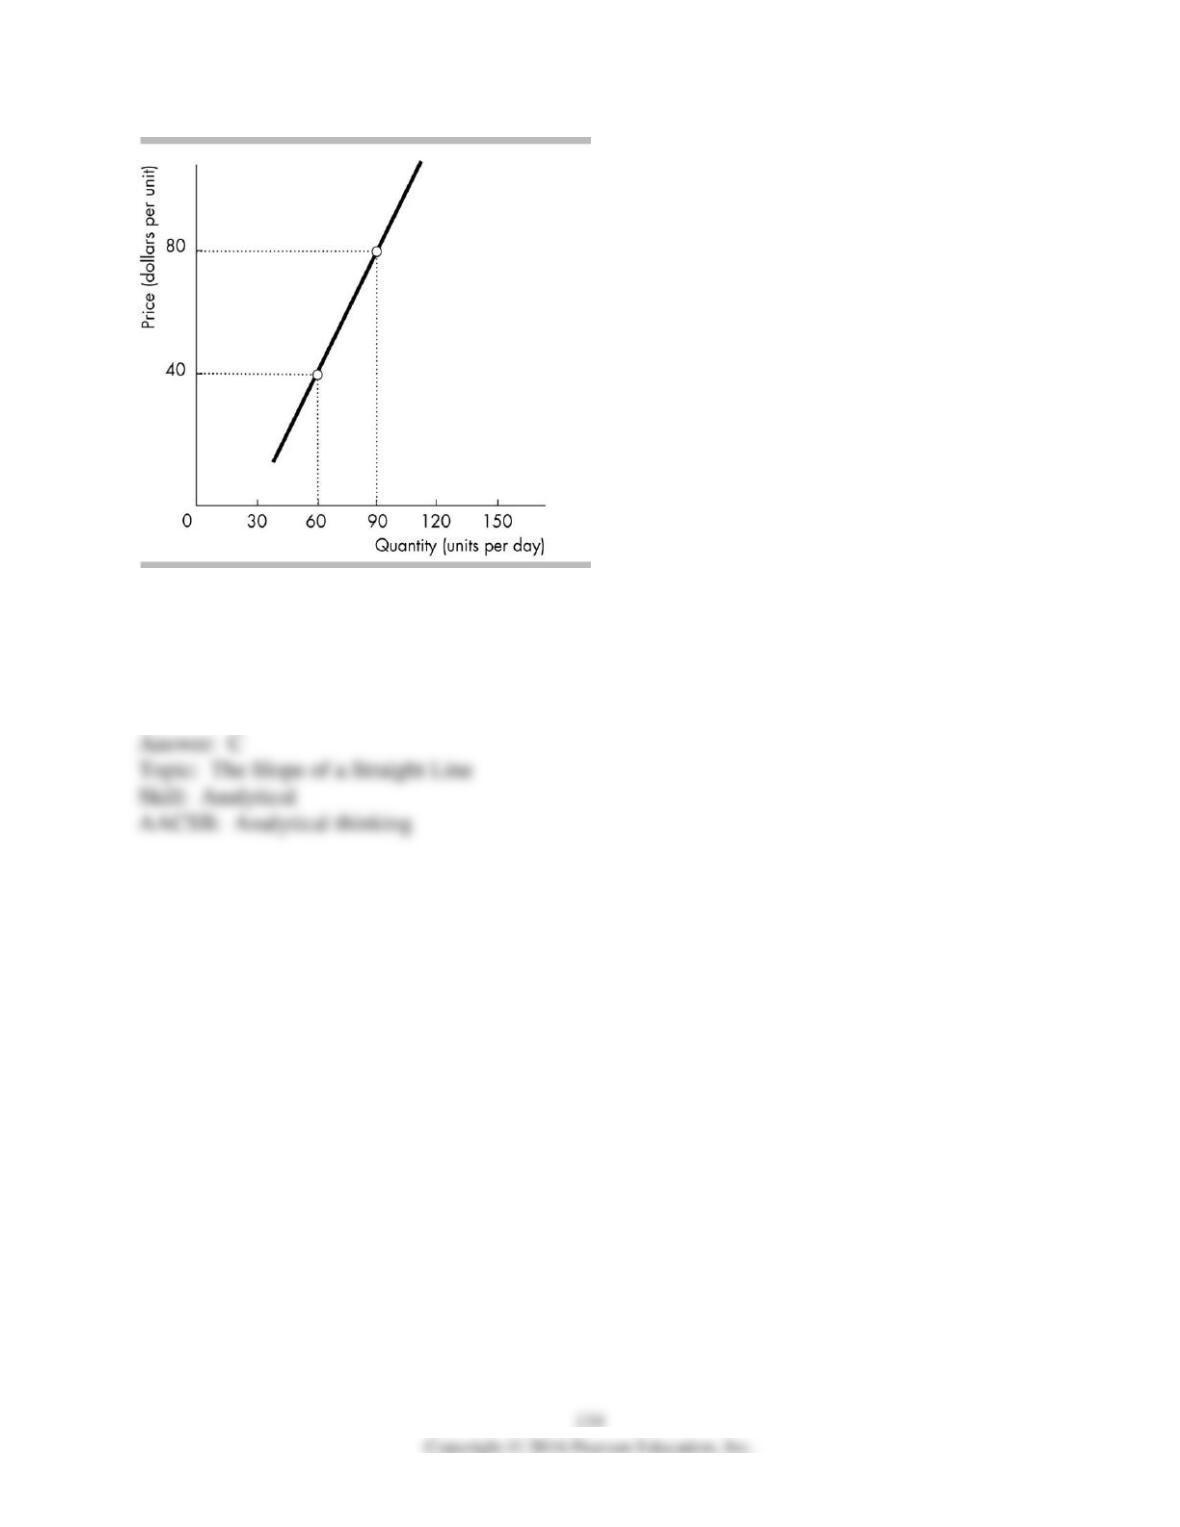
44) The slope of the line shown in the above figure is
A) 2.
B) 0.75.
C) 0.25.
D) 1 1/3.
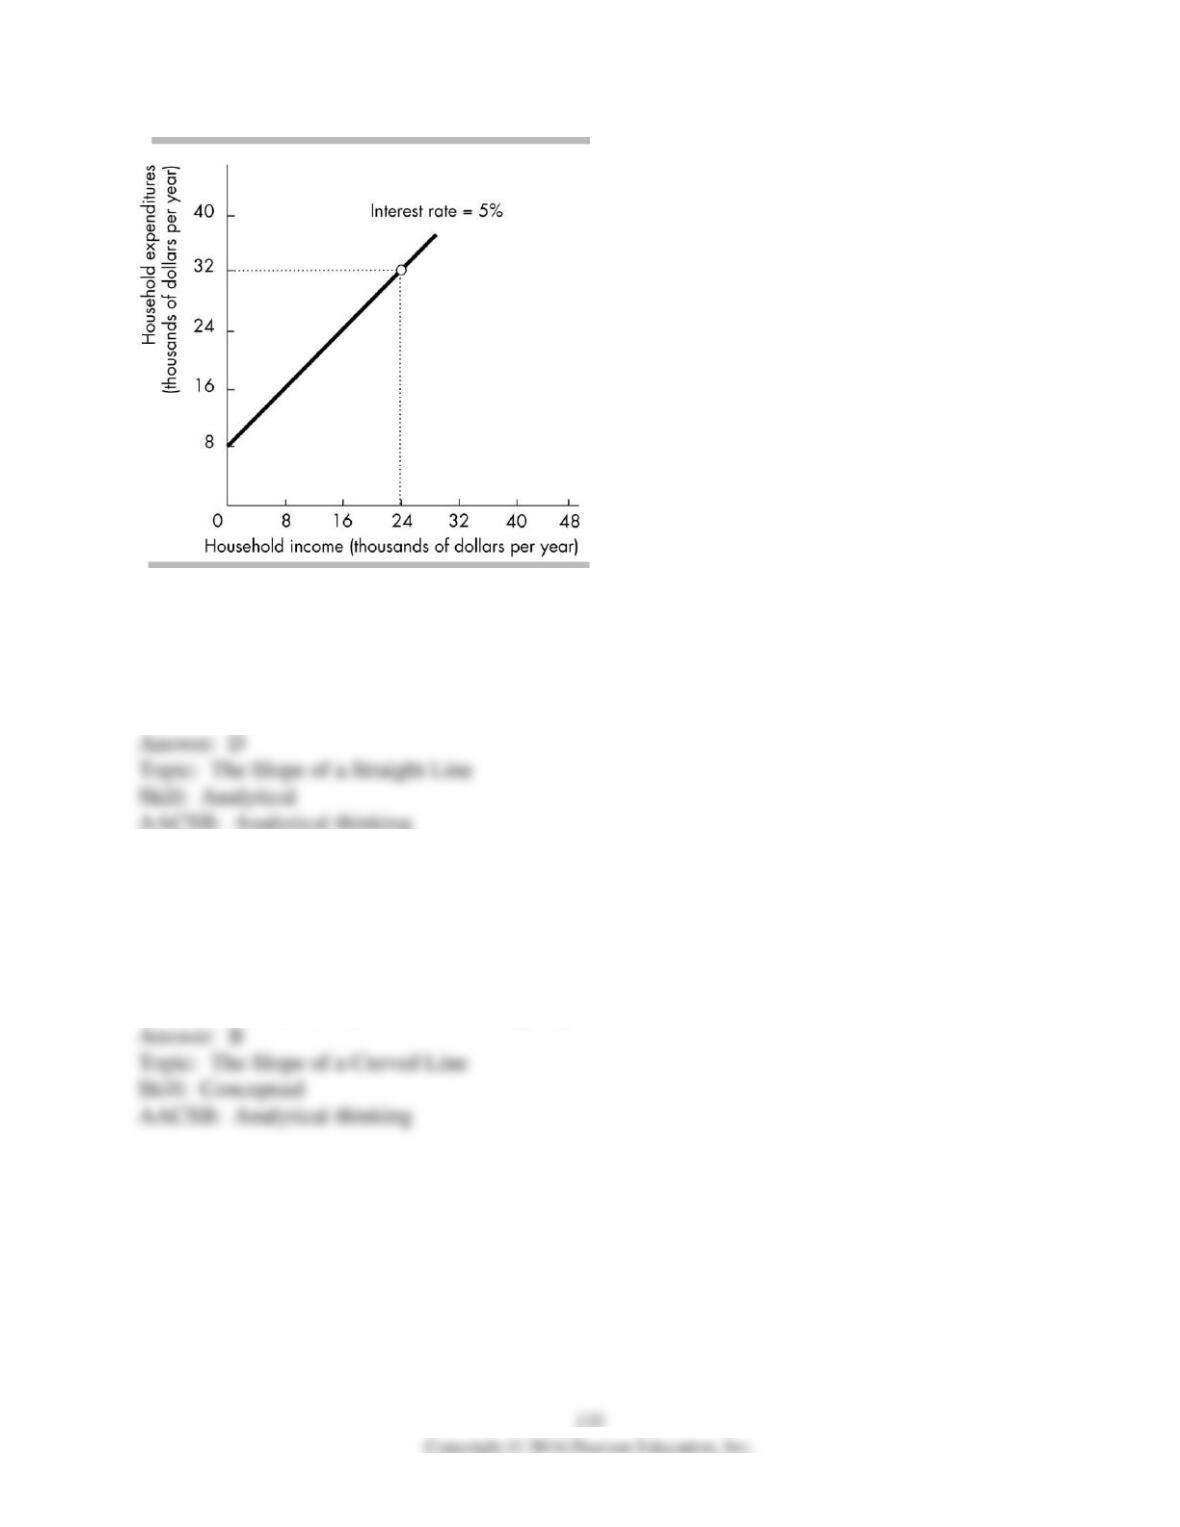
45) The slope of the line shown in the above figure is
A) 0.90.
B) 1.5.
C) 1.11.
D) 2.
46) The slope of the line in the above figure is
A) -1/2.
B) -3.
C) -4.
D) -1/3.
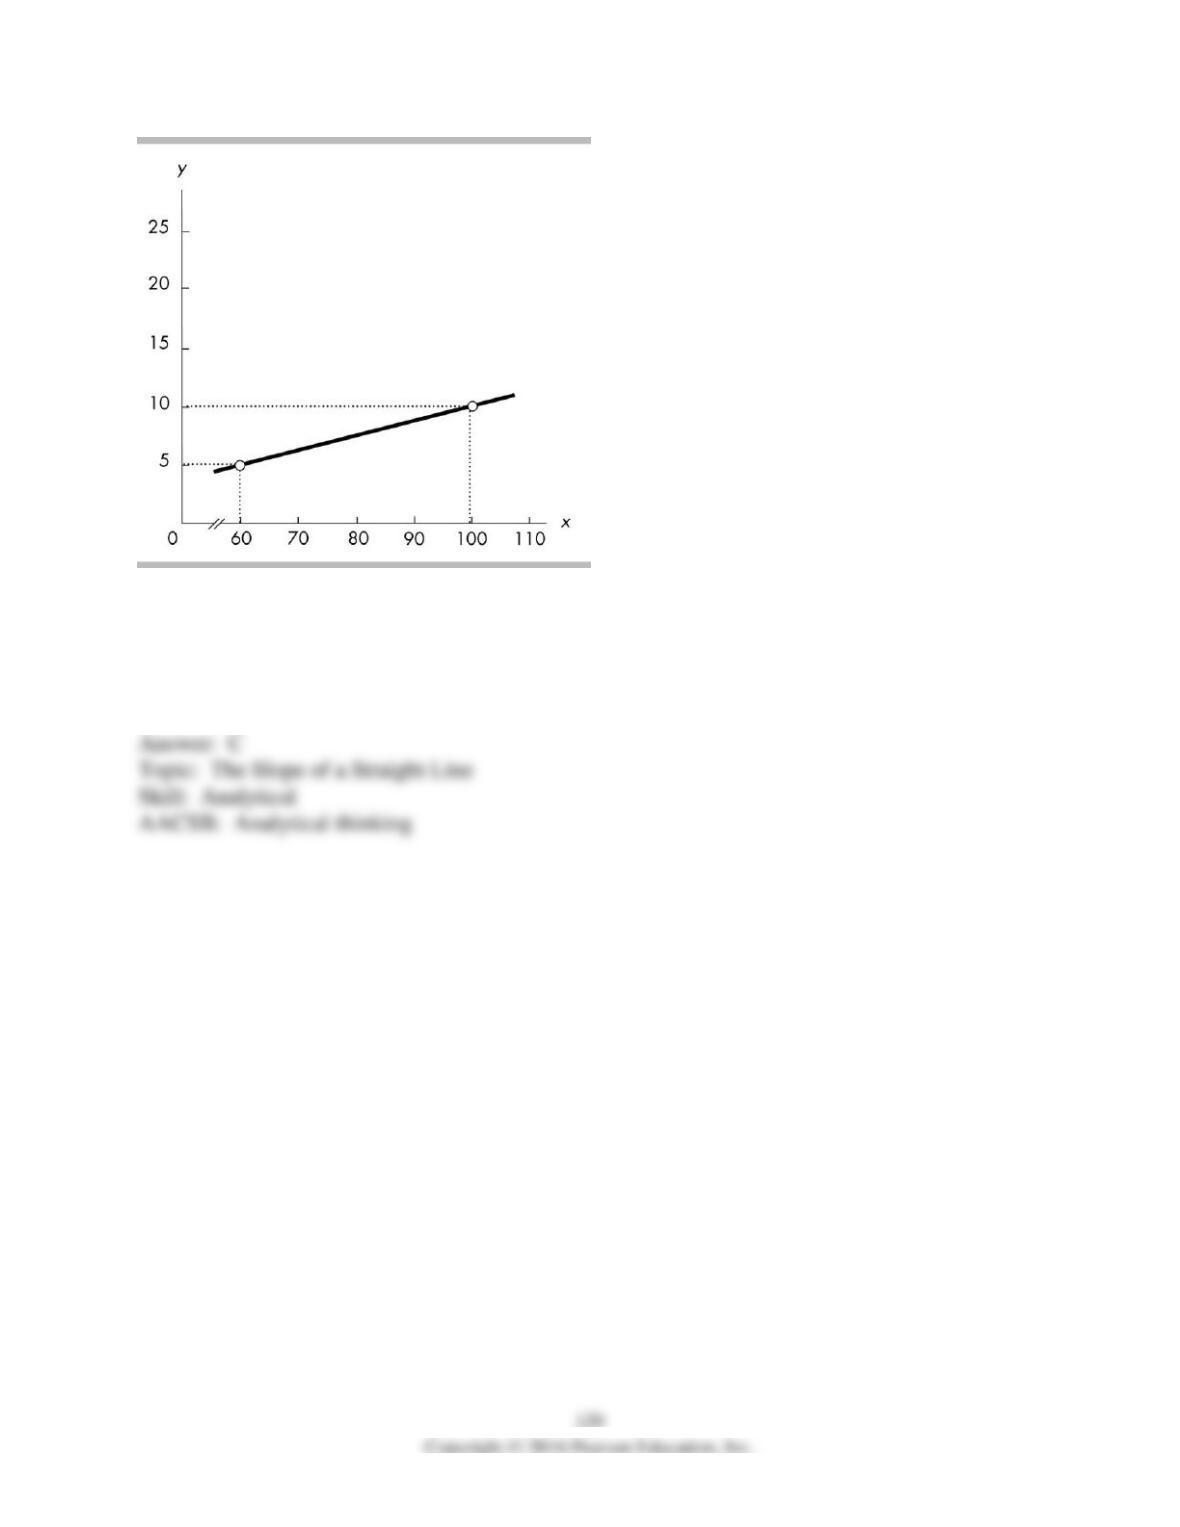
47) The slope of the line in the above figure is
A) 8.
B) 0.05.
C) 0.125.
D) 0.10.
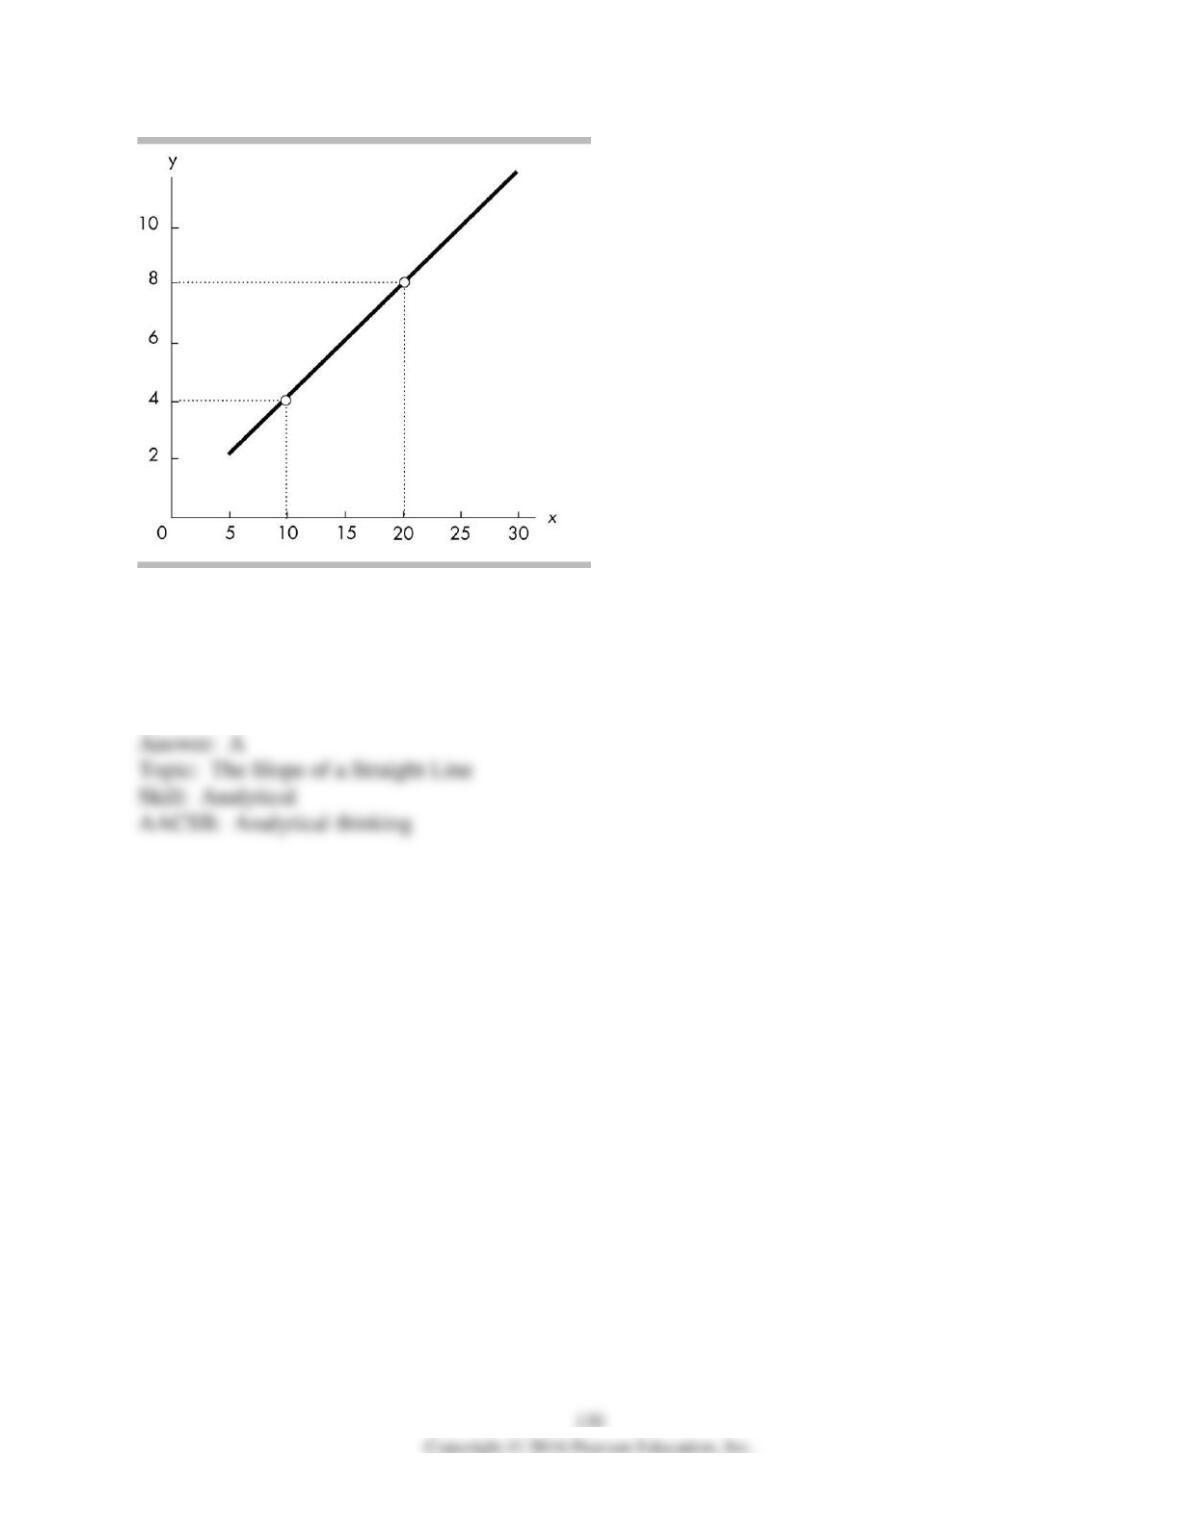
48) The slope of the line in the above figure is
A) 2/5 = 0.4.
B) 5/2 = 2.5.
C) -2/5 = -0.4.
D) -5/2 = -2.5.
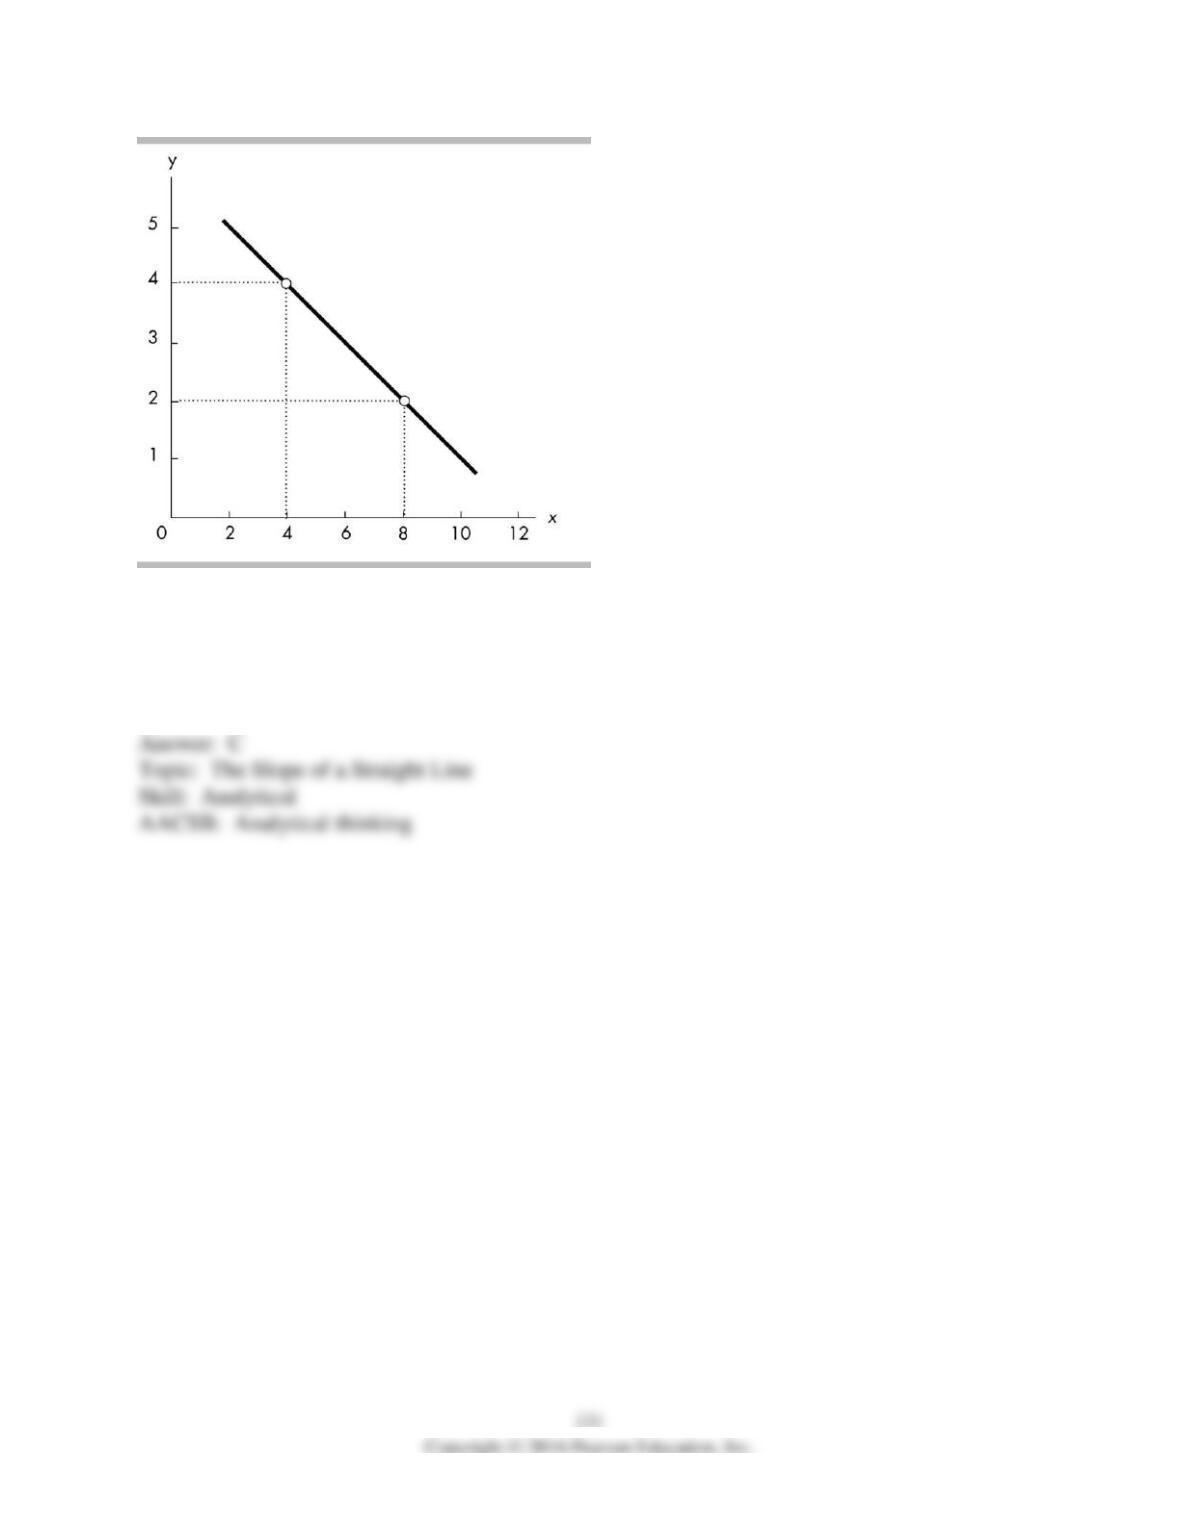
49) The slope of the line in the above figure is
A) 1/2 = 0.5.
B) 2.
C) -1/2 = -0.5.
D) -2.
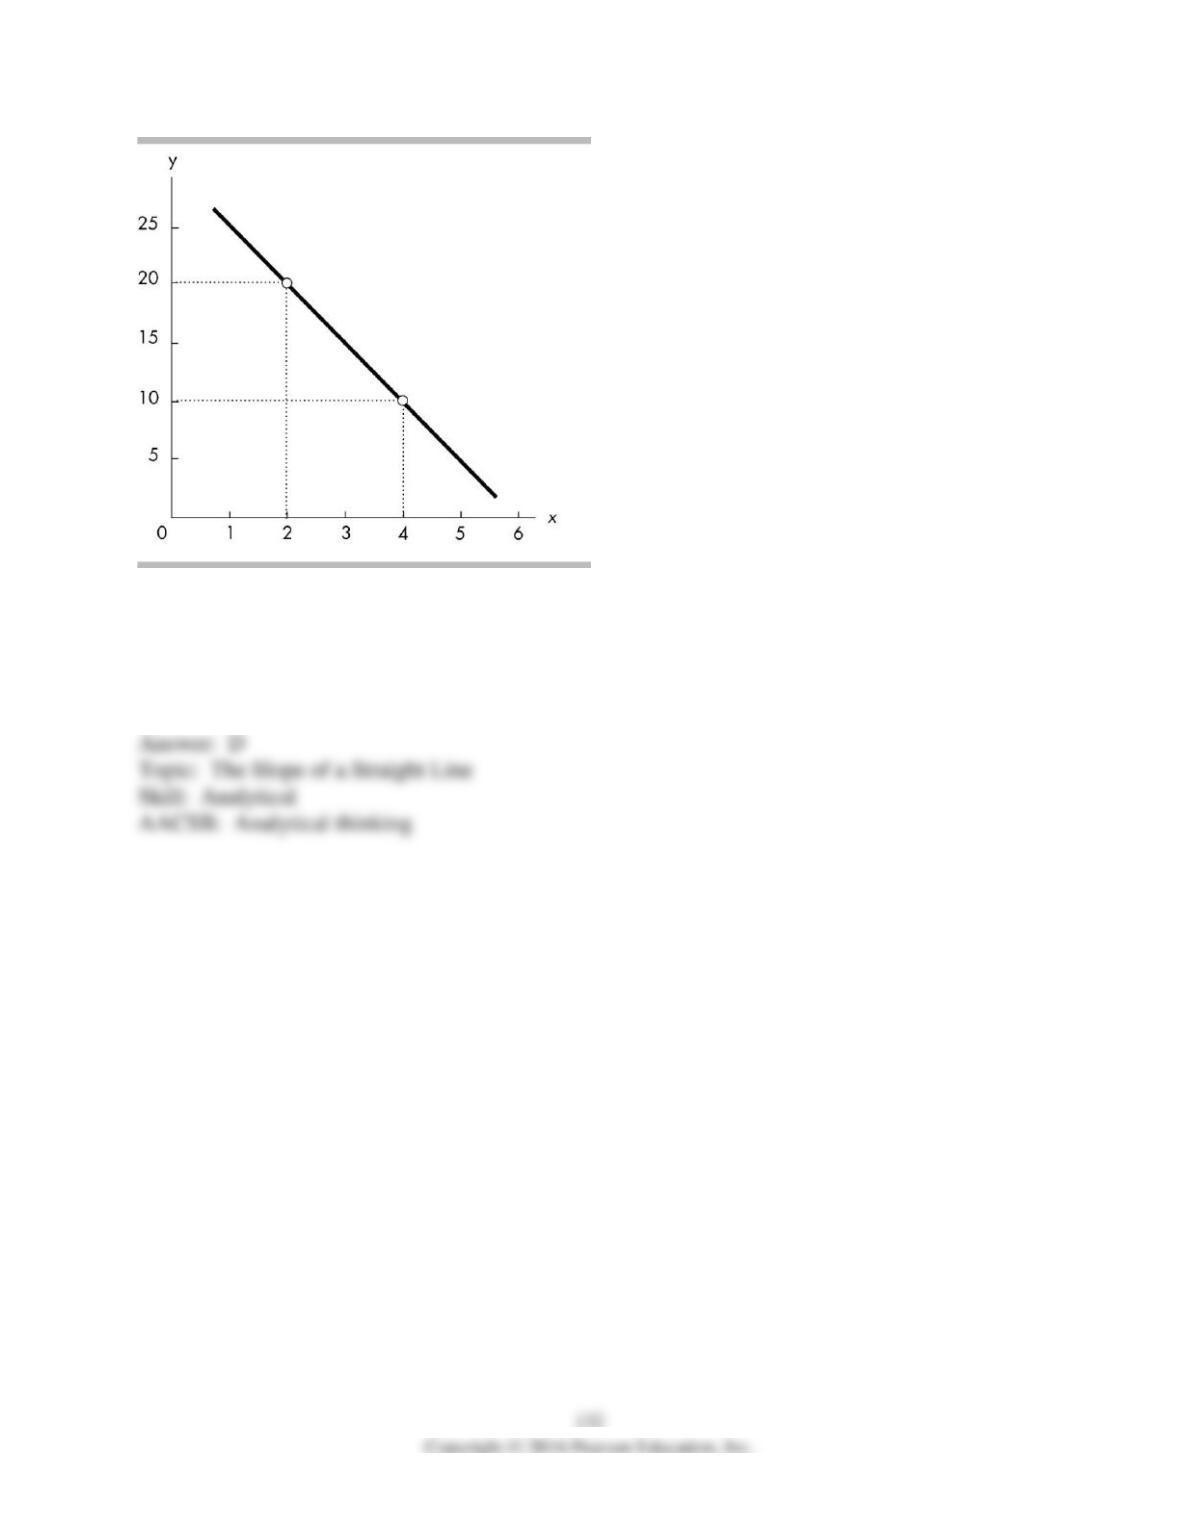
50) The slope of the line in the above figure is
A) -10.
B) 10.
C) 5.
D) -5.
51) The slope of the line shown in the above figure is
A) -1 3/8.
B) -1 2/3.
C) 5/8.
D) -0.625.
52) The slope of the line shown in the above figure is
A) 3/4.
B) 2/3.
C) 1 1/3.
D) 1 3/4.
53) The slope of the line in the above figure is
A) -4.
B) -2.5.
C) -1.0.
D) 1.0.
54) On a graph, an upward-sloping curve that is flatter as you move away from the origin
indicates a
A) positive relationship with an increasing slope.
B) positive relationship with a decreasing slope.
C) negative relationship with an increasing slope.
D) negative relationship with a decreasing slope.
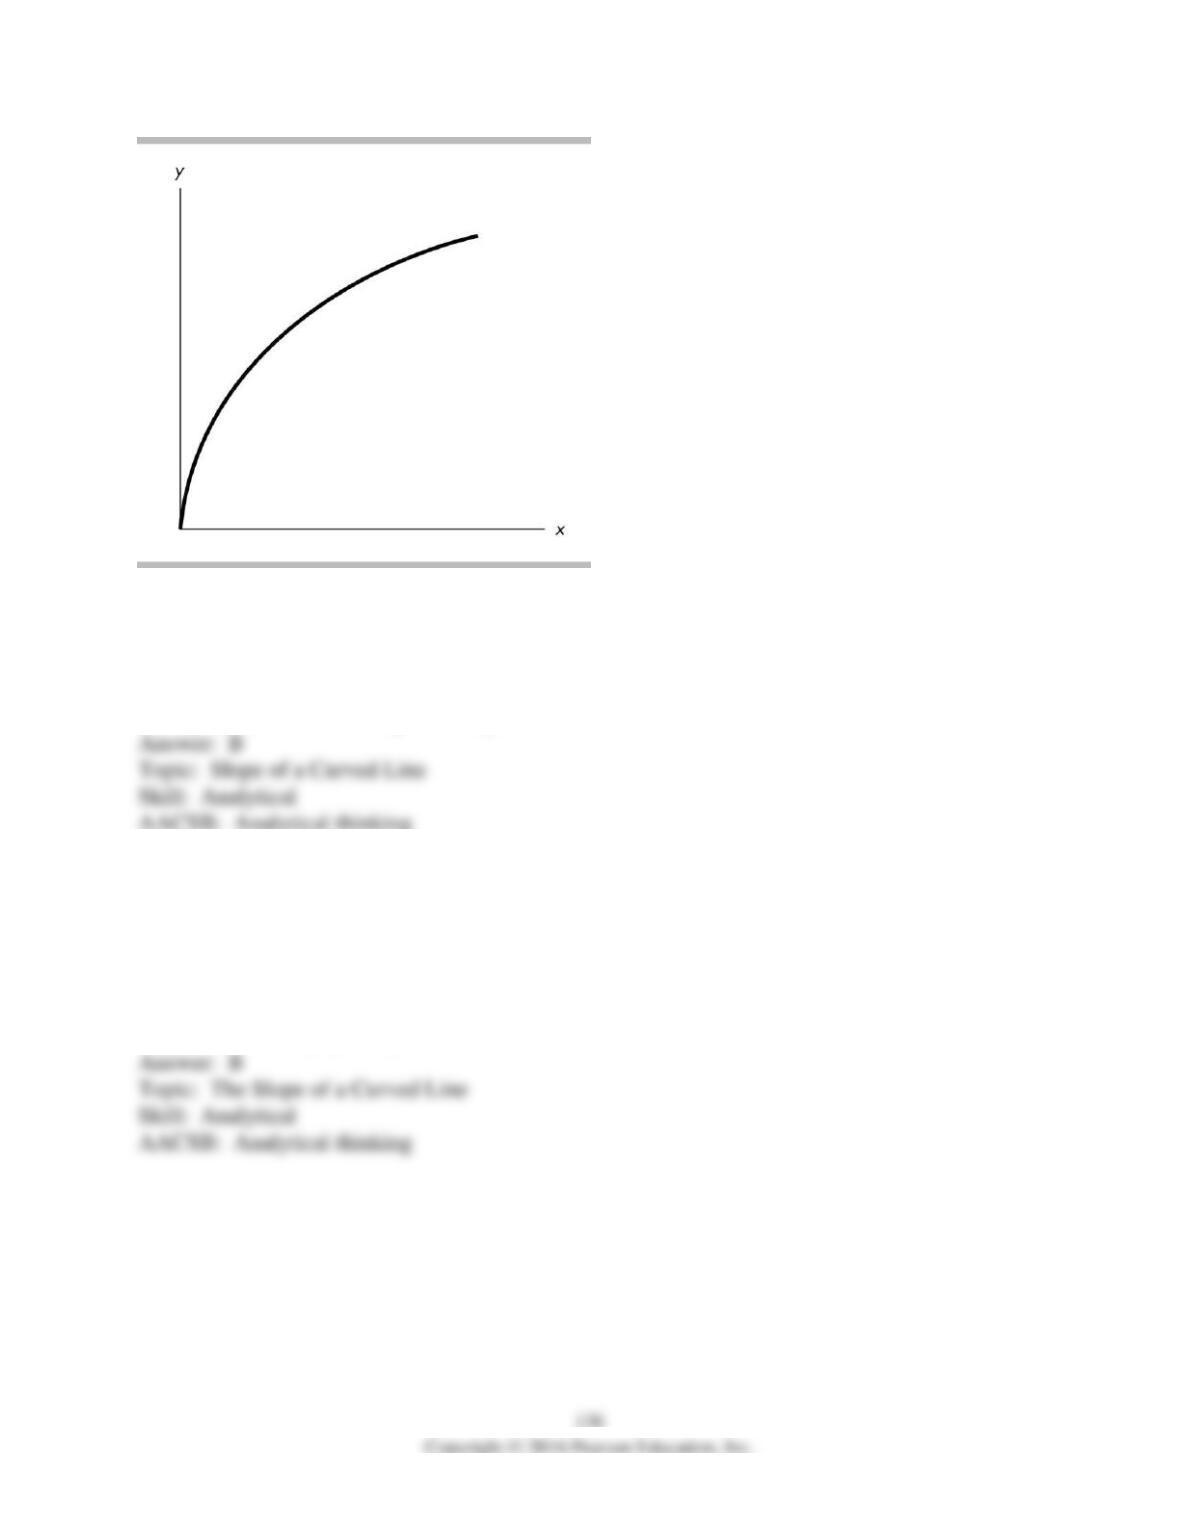
55) In the above figure, the curve’s slope is
A) positive and is becoming steeper.
B) positive and is becoming less steep.
C) negative and is becoming steeper.
D) negative and is becoming less steep.
56) If the price of apples is on the vertical axis and the quantity of apples demanded is on the
horizontal axis, the slope between two points on the line describing the relationship between
price and quantity is
A) the change in price multiplied by the change in quantity.
B) the change in price divided by the change in quantity.
C) the change in quantity divided by the change in price.
D) price divided by quantity.
57) The formula for the slope across an arc is used to approximate the slope for
A) linear relationships only.
B) a curved line.
C) a positive relationship only.
D) a negative relationship only.
58) The slope of a curved line can be approximated by
A) the average of the variable measured along the y-axis divided by the average of the variable
measured along the x-axis.
B) the inverse of the straight-line method.
C) the average of the variable measured along the x-axis divided by the average of the variable
measured along the y-axis.
D) the slope across an arc from one point on the curve to another point on the curve.
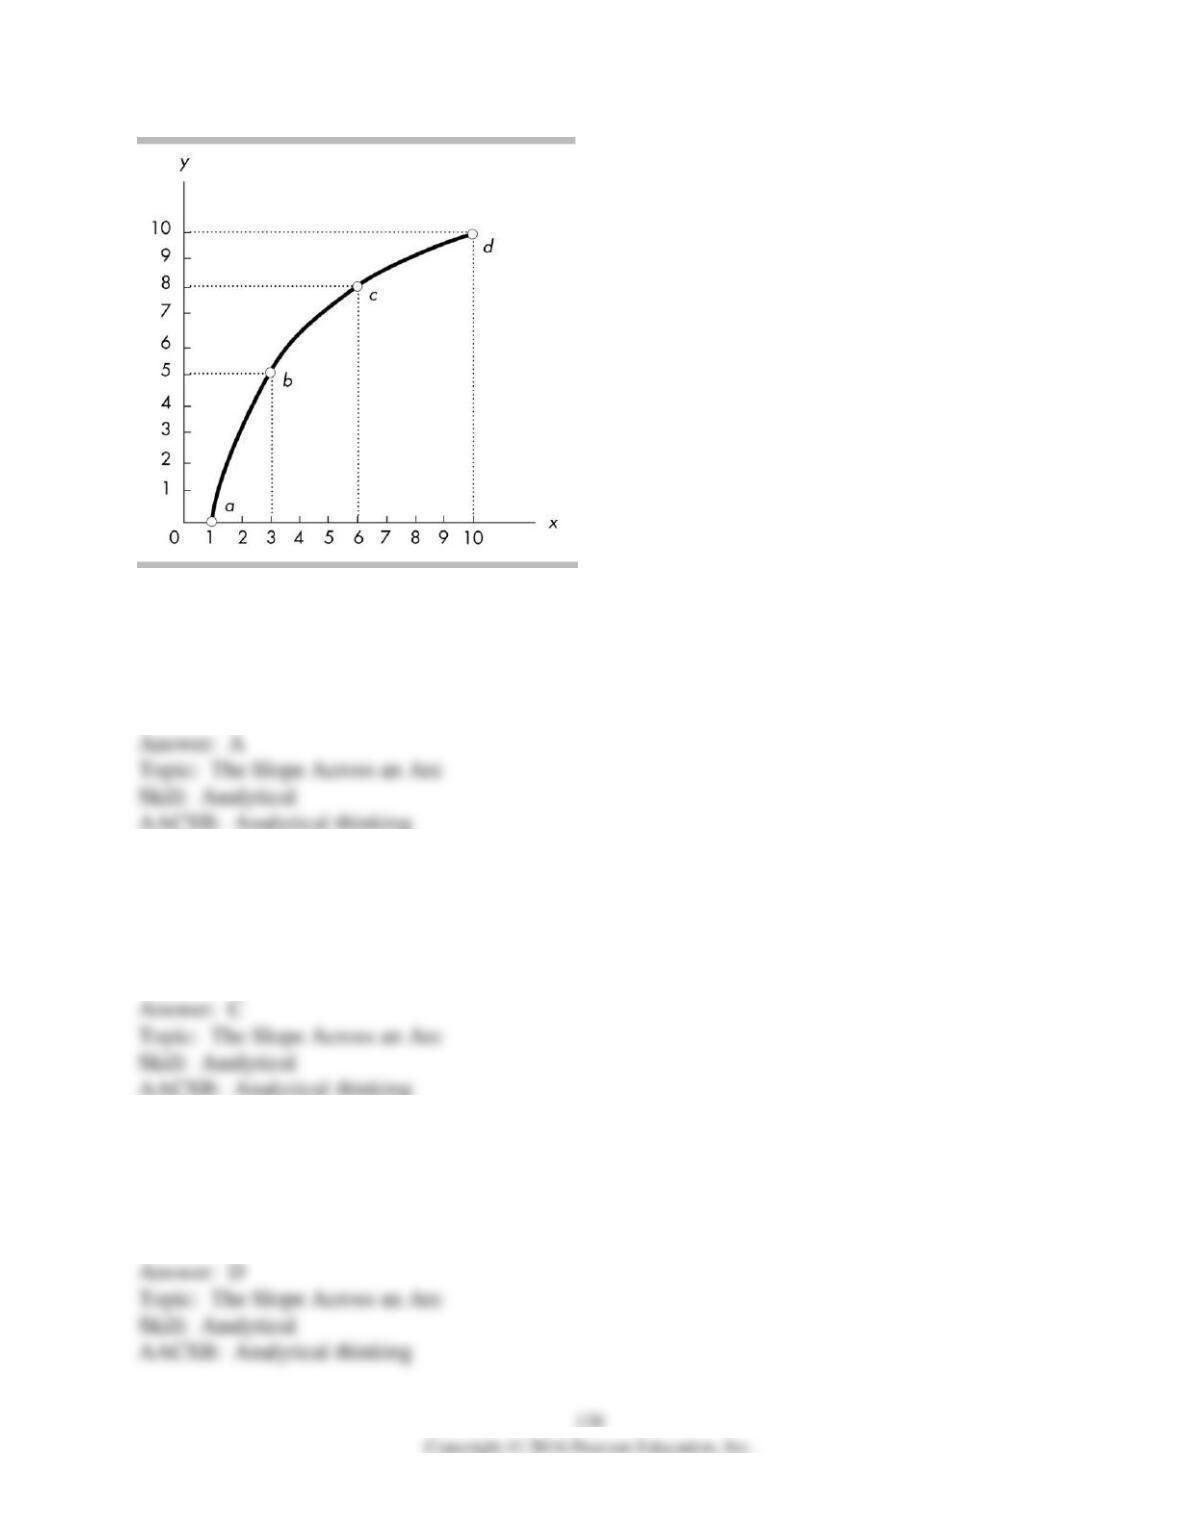
59) In the above figure, the slope across the arc between c and d is
A) 1/2.
B) 1.
C) 4/3.
D) 2.
60) In the above figure, the slope across the arc between b and c is
A) 1/2.
B) 2/3.
C) 1.
D) 2.
61) In the above figure, the slope across the arc between a and b is
A) 2/5.
B) 1.
C) 3/2.
D) 5/2.
62) In the above figure, the slope at point b is
A) 1.
B) 5/2.
C) between 1 and 5/2.
D) greater than 5/2.
63) In the above figure, the relationship between x and y is
A) positive, with slope decreasing as x increases.
B) negative, with slope decreasing as x increases.
C) negative, with slope increasing as x increases.
D) positive, with slope increasing as x increases.
64) The slope in the above figure is
A) negative and increasing.
B) negative and decreasing.
C) positive and increasing.
D) positive and decreasing.
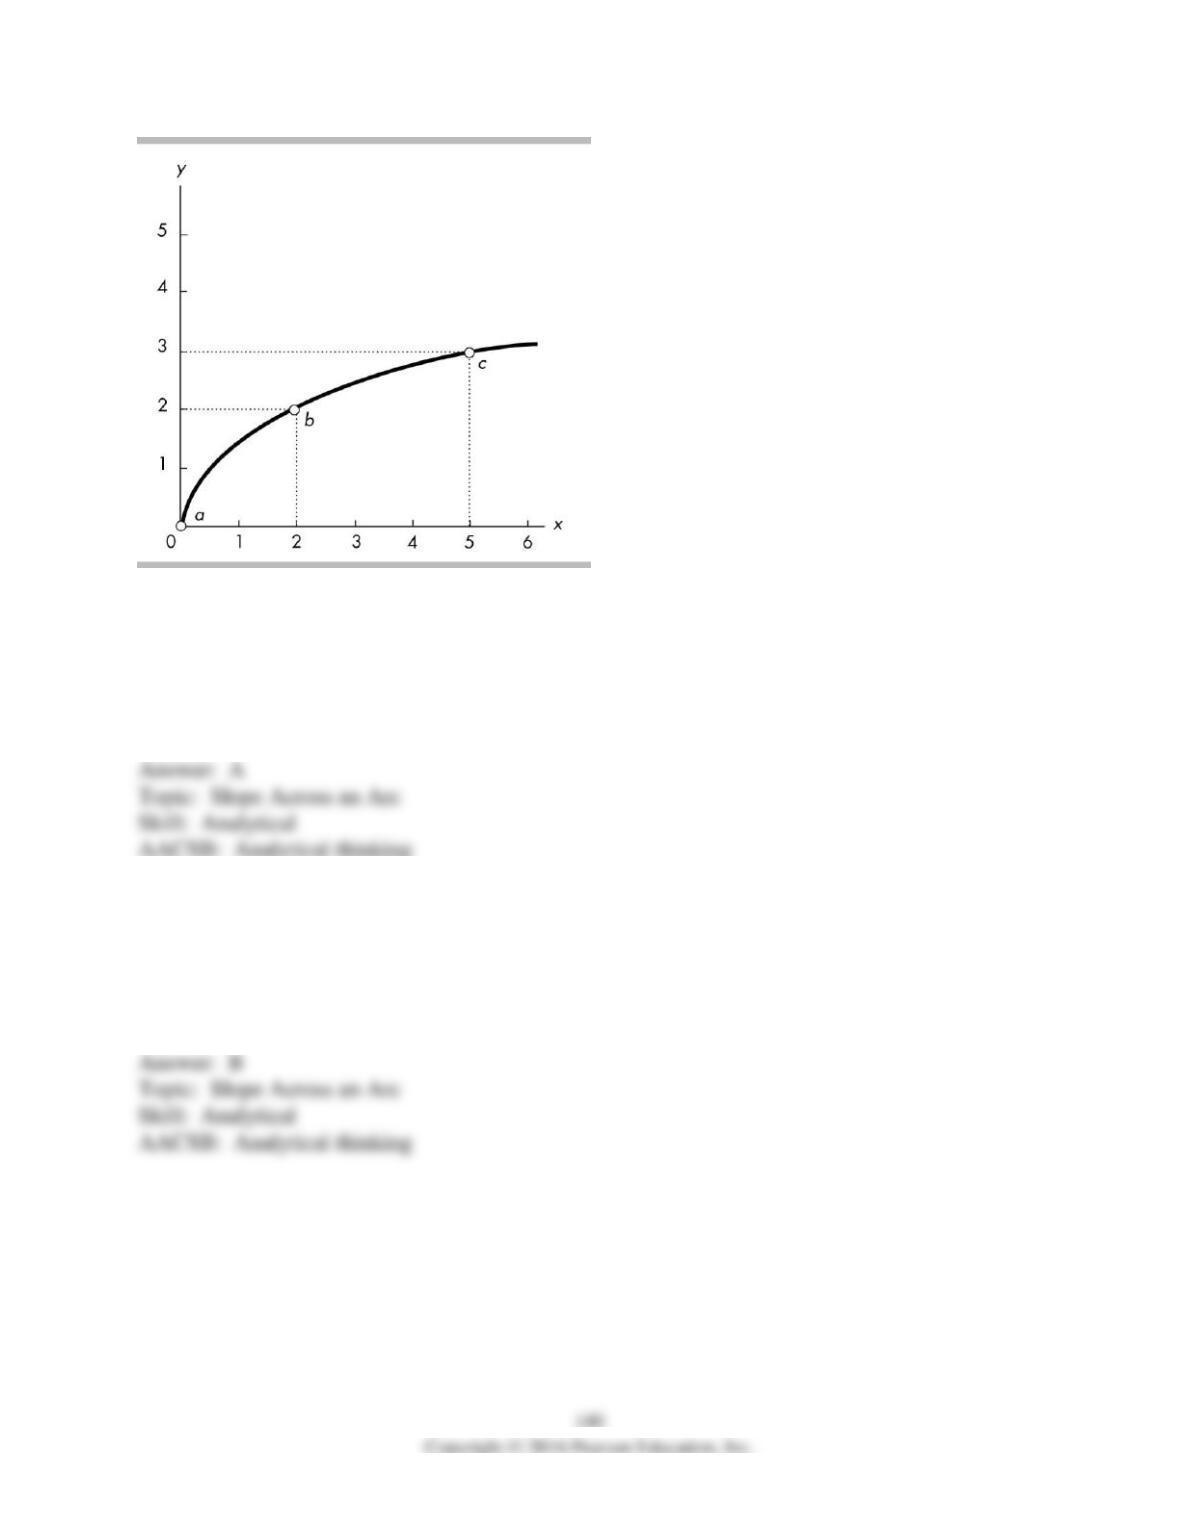
65) In the above figure, using the slope across an arc, the slope of the curve between points b and
c is
A) 1/3.
B) -1/3.
C) 3.
D) -3.
66) In the above figure, using the slope across an arc, the slope of the curve between points a and
c is
A) -3/5.
B) 3/5.
C) 5/3.
D) -5/3.