59) A diagram shows the quantity of tomatoes on the horizontal axis and the quantity of coffee
on the vertical axis. The quantity of tomatoes remains constant as the quantity of coffee
increases. The graph of these data is
A) a horizontal line.
B) a vertical line.
C) a positively sloped line.
D) a negatively sloped line
60) A graph shows the price of a pound of cucumbers on the vertical axis and the quantity of
new cars sold by GM on the horizontal axis. The price of a pound of cucumbers remains constant
as the quantity of new cars sold increases. The graph of these data is
A) a horizontal line.
B) a vertical line.
C) a curve with a maximum.
D) a positively-sloped line.
61) If two variables are unrelated, a scatter diagram of those variables will
A) be a vertical line.
B) be a horizontal line.
C) be either a vertical or horizontal line.
D) have a constant positive slope.
62) Which of the following CORRECTLY describes the above figure?
I) There is no relationship between the price of an avocado and a student’s grade in economics.
II) The value of variable measured on the y-axis is constant as the variable measured on the x–
axis increases.
III) As a student’s grade in economics increases, the price of an avocado increases.
A) I
B) I and II
C) II and III
D) I, II, and III
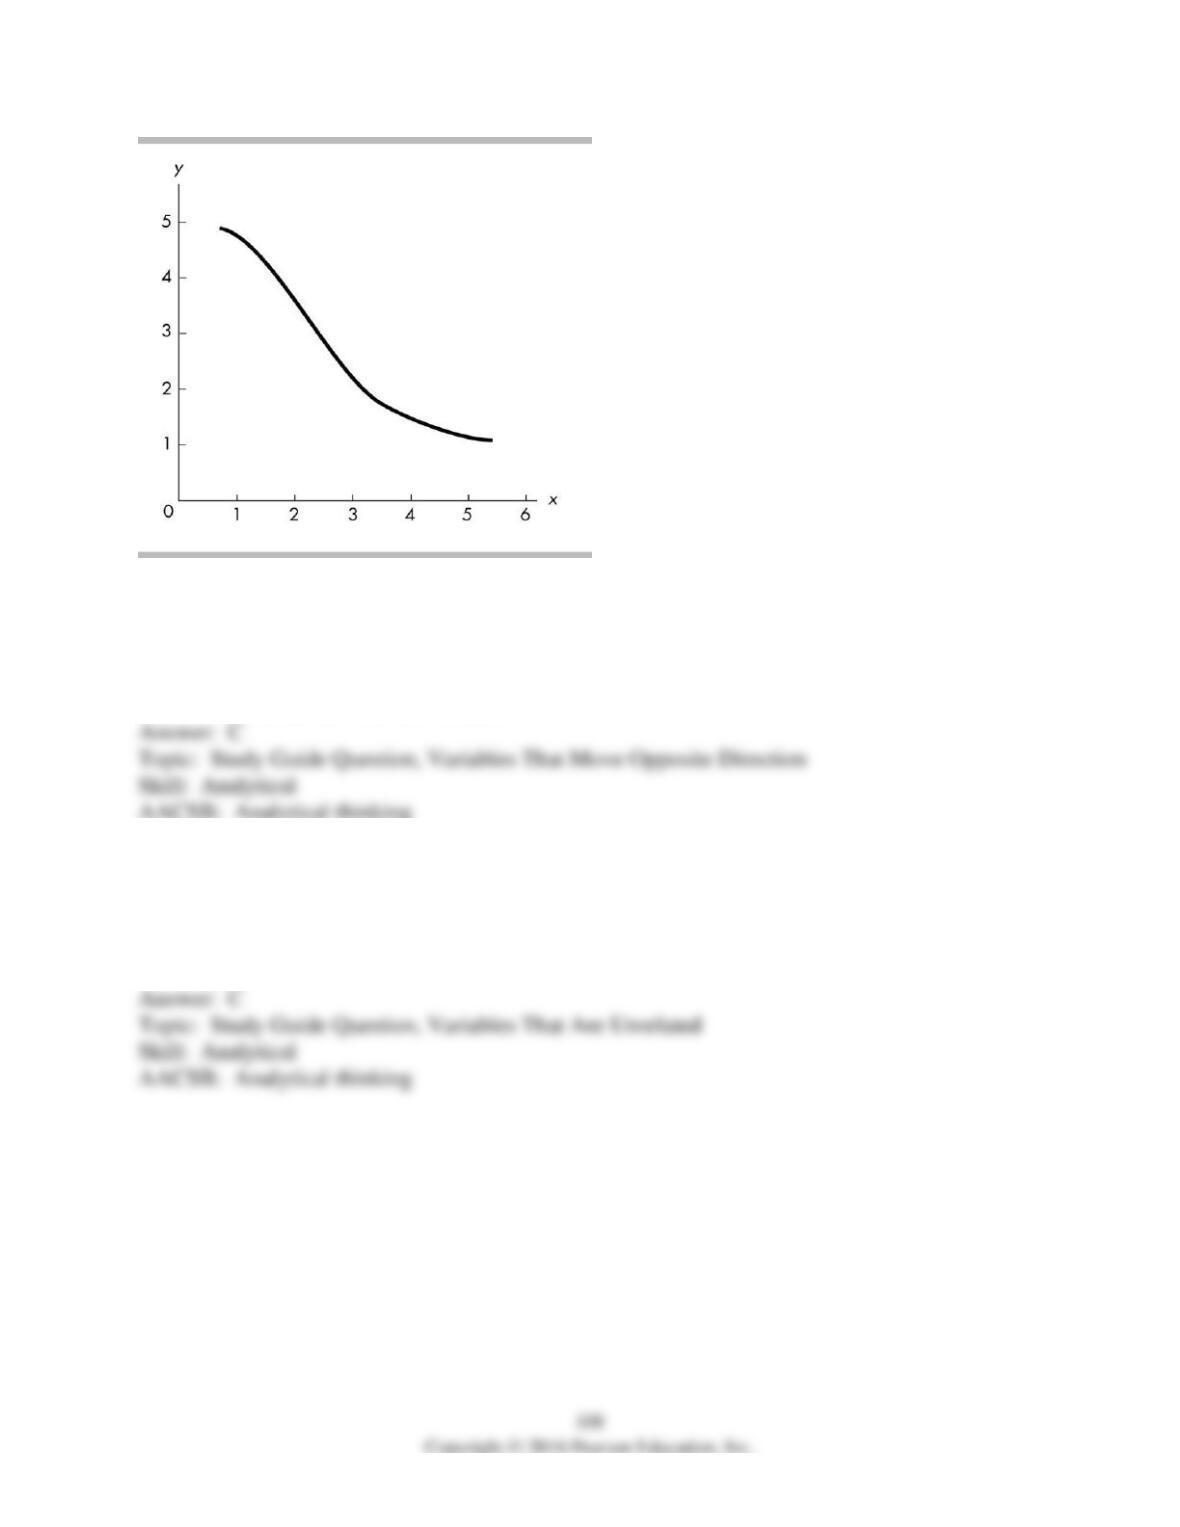
63) In the above, as the y variable increases
A) the x variable is constant.
B) the x variable increases.
C) the x variable decreases.
D) the x variable at first increases but then decreases.
64) Which of the following CORRECTLY describes the above figure?
A) There is no relationship between x and y.
B) There is a positive relationship between x and y.
C) There is a negative relationship between x and y.
D) None of the above answers are correct.
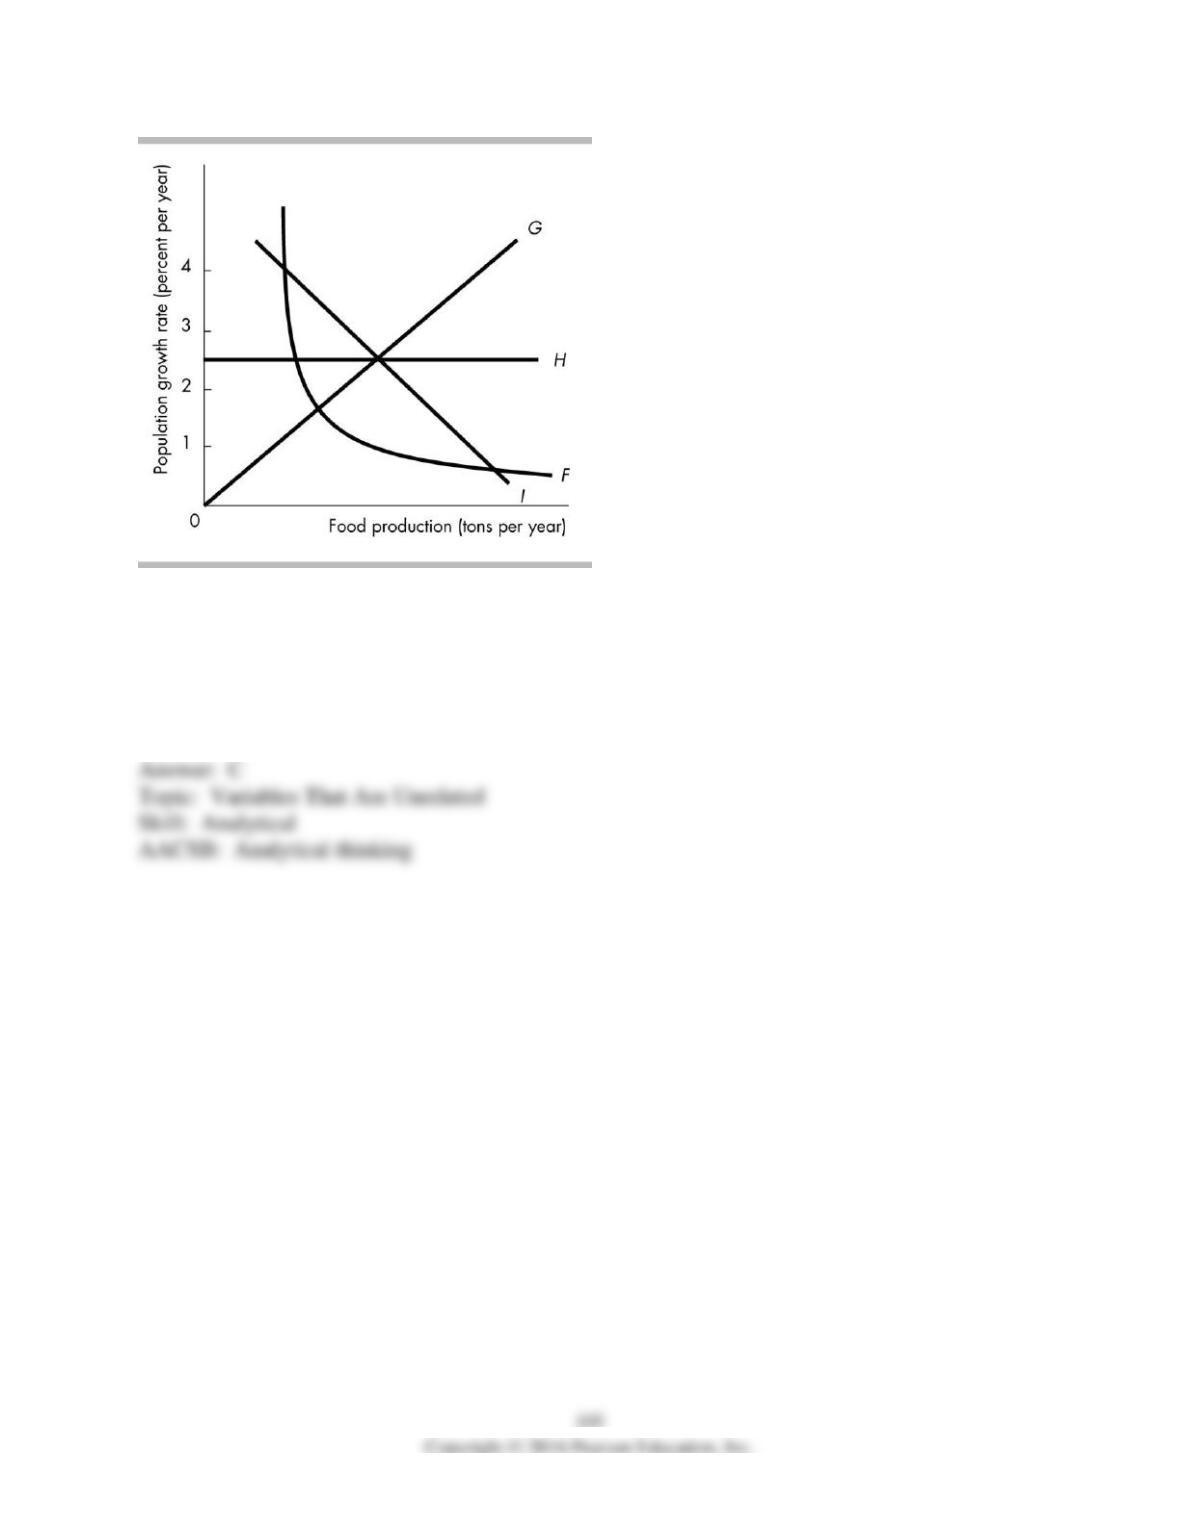
65) In the above figure, which curve indicates that the level of food production does not affect
the population growth rate?
A) F
B) G
C) H
D) I
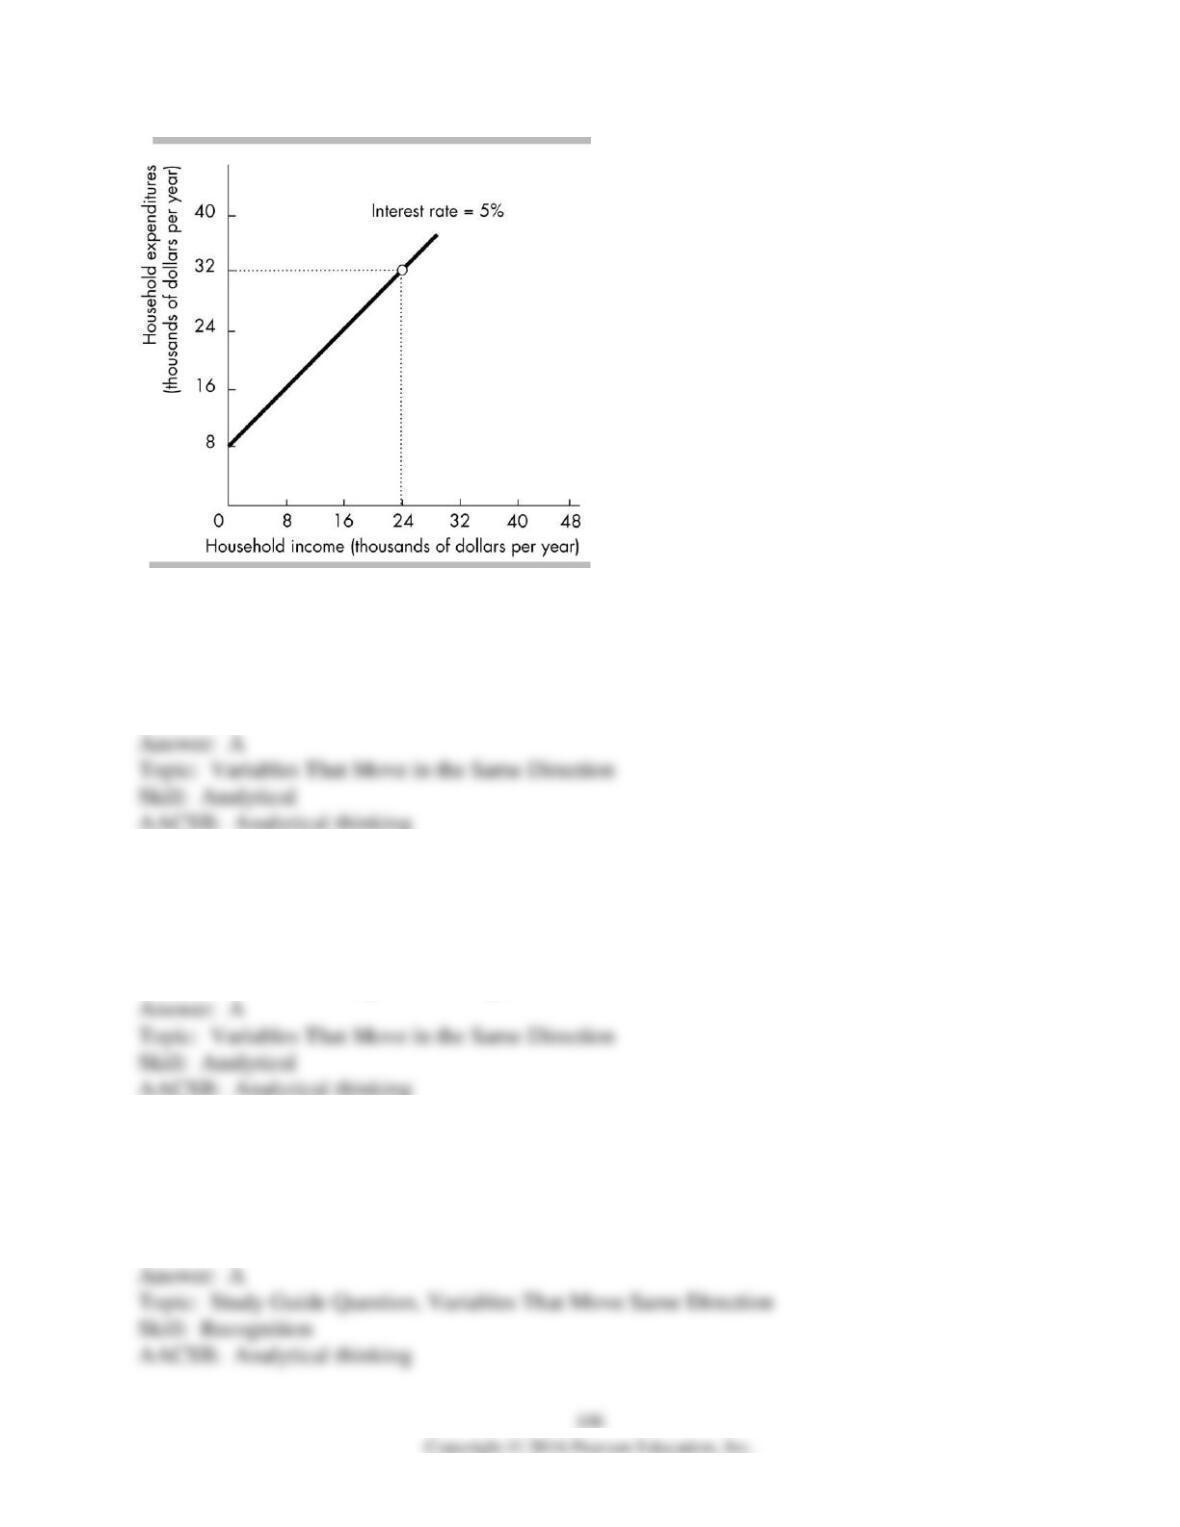
66) In the above figure, the relationship between income and expenditures is
A) positive.
B) negative.
C) independent.
D) random.
67) The relationship in the above figure suggests that when the interest rate is 5 percent
A) a decrease in income will be associated with a decrease in expenditures.
B) a decrease in income will be associated with an increase in expenditures.
C) an increase in income will be associated with a decrease in expenditures.
D) there is no relationship between expenditures and income.
68) If variables x and y move up and down together, they are
A) positively related.
B) negative related.
C) unrelated.
D) trend related.
69) The term “direct relationship” means the same as
A) correlation.
B) trend.
C) positive relationship.
D) negative relationship.
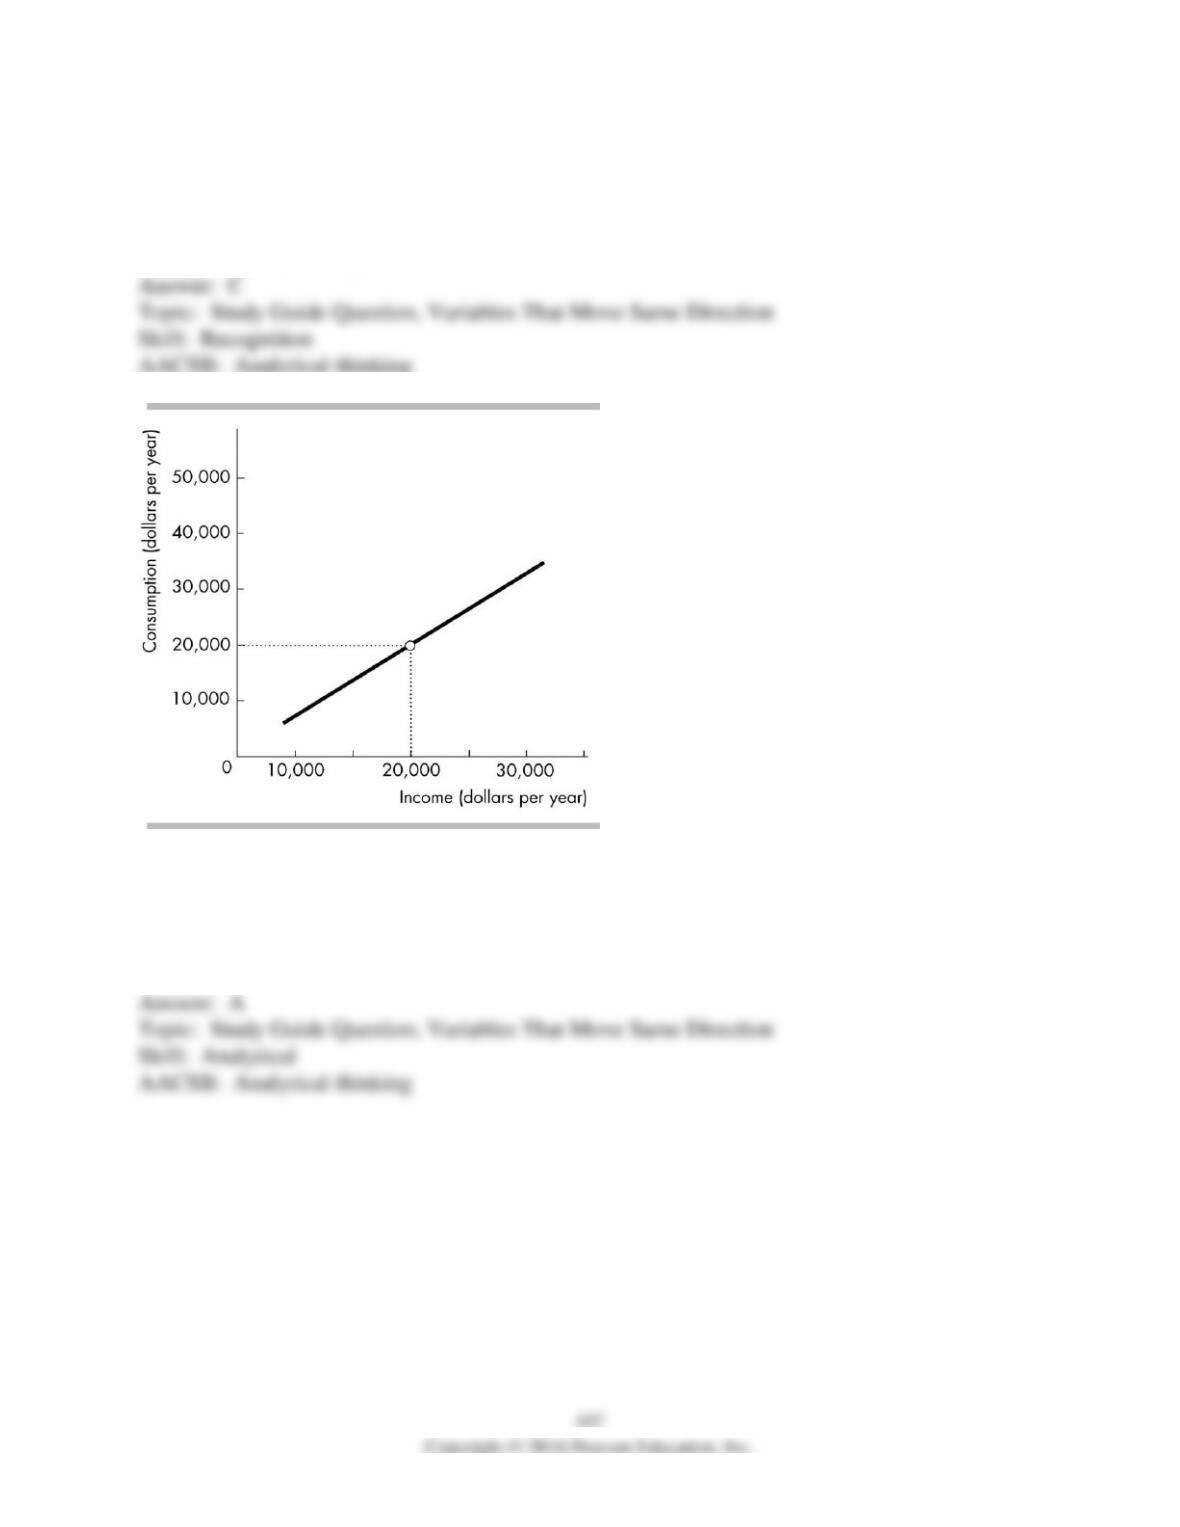
70) The relationship between income and consumption illustrated in the figure above is
A) positive and linear.
B) positive and nonlinear.
C) negative and linear.
D) negative and nonlinear.
71) The figure above shows
A) a positive relationship.
B) a direct relationship.
C) a negative relationship.
D) no relationship between the variables.
72) The relationship between two variables, x and y, is a vertical line. Thus x and y are
A) positively correlated.
B) negatively correlated.
C) not related.
D) falsely related.
12 Appendix: The Slope of a Relationship
1) The slope of a line equals the
A) change in the variable measured along the x-axis divided by the change in the variable
measured along the y-axis.
B) change in the variable measured along the y-axis divided by the change in the variable
measured along the x-axis.
C) change in the variable measured along the x-axis minus the change in the variable measured
along the y-axis.
D) change in the variable measured along the x-axis multiplied by the change in the variable
measured along the y-axis.
2) A curve is plotted with y measured on the vertical axis and x measured on the horizontal axis.
The slope of the curve equals
A) y divided by x.
B) the change in y divided by x.
C) the change in y divided by the change in x.
D) y divided by the change in x.
3) The slope of a line
A) can never equal zero.
B) is always a constant.
C) measures the ratio of the change in the value of the y-axis variable relative to the change in
the value of the x-axis variable.
D) measures the value of the y-axis variable relative to the value of the x-axis variable.
4) The slope of a positive relationship is
A) positive.
B) undefined.
C) positive to the right of the maximum point and negative to the left.
D) constant as long as the relationship is nonlinear.
5) In which of the following cases is the slope of a line positive?
A) As x increases, y increases.
B) As x increases, y decreases.
C) As x increases, y remains the same.
D) As x increases, y equals a positive number.
6) If a large change in the variable measured on the x-axis is associated with a small change of
the variable measured on the y-axis, the line is ________ and the slope is ________.
A) downward-sloping; large
B) downward-sloping; small
C) upward-sloping; small
D) either downward or upward-sloping; small
7) Suppose we are considering the relationship between two variables y and x. y is measured on
the y-axis and x is measured on the x-axis, and the relationship between then is a straight line.
Suppose that the slope of the line is positive and is less than 1. This slope means that a change in
x is associated with
A) a bigger change in y.
B) a smaller change in y.
C) no change in y.
D) an equal change in y.
8) Suppose we are considering the relationship between two variables y and x. y is measured on
the y-axis and x is measured on the x-axis, and the relationship between then is a straight line.
Suppose that the slope of the line is equal to 1. This slope means that
A) a change in x is associated with a bigger change in y.
B) a change in x is associated with a smaller change in y.
C) a change in x is associated with no change in y.
D) a change in x is associated with an equal change in y.
9) Suppose we are considering the relationship between two variables y and x. y is measured on
the y-axis and x is measured on the x-axis, and the relationship between then is a straight line.
Suppose that the slope of the line is greater than 1. This slope means that
A) a change in x is associated with a bigger change in y.
B) a change in x is associated with a smaller change in y.
C) a change in x is associated with no change in y.
D) a change in x is associated with an equal change in y.
10) In which of the following cases is the slope of a line positive and less than infinity?
A) As the variable measured on the x-axis decreases, the variable measured on the y-axis
decreases.
B) As the variable measured on the x-axis increases, the variable measured on the y-axis
decreases.
C) As the variable measured on the y-axis increases, the variable measured on the x-axis does not
change.
D) As the variable measured on the y-axis increases, the variable measured on the x-axis
decreases.
11) In a graph, a line has a negative slope if
A) the line is vertical.
B) the line is horizontal.
C) the line rises from right to left.
D) the line rises from left to right.
12) Suppose that for a curve, as the variable measured on the x-axis increases, the variable
measured on the y-axis decreases. The curve has a ________ slope.
A) tangent
B) positive
C) negative
D) hypothetical
13) If the slope of the relationship between savings and interest rates is 0.5, then
A) savings and interest rates have a positive relationship.
B) savings and interest rates have a negative relationship.
C) savings and interest rates have no relationship.
D) savings and interest rates have an inverse relationship.
14) If an increase in x (the variable on the horizontal axis) from 6 to 8 units causes a decrease in
y (the variable on the vertical axis) from 4 to 3 units, the slope equals
A) 2.
B) -2.
C) 1/2.
D) -1/2.
x
y
0
0
2
6
4
12
6
18
8
24
10
30
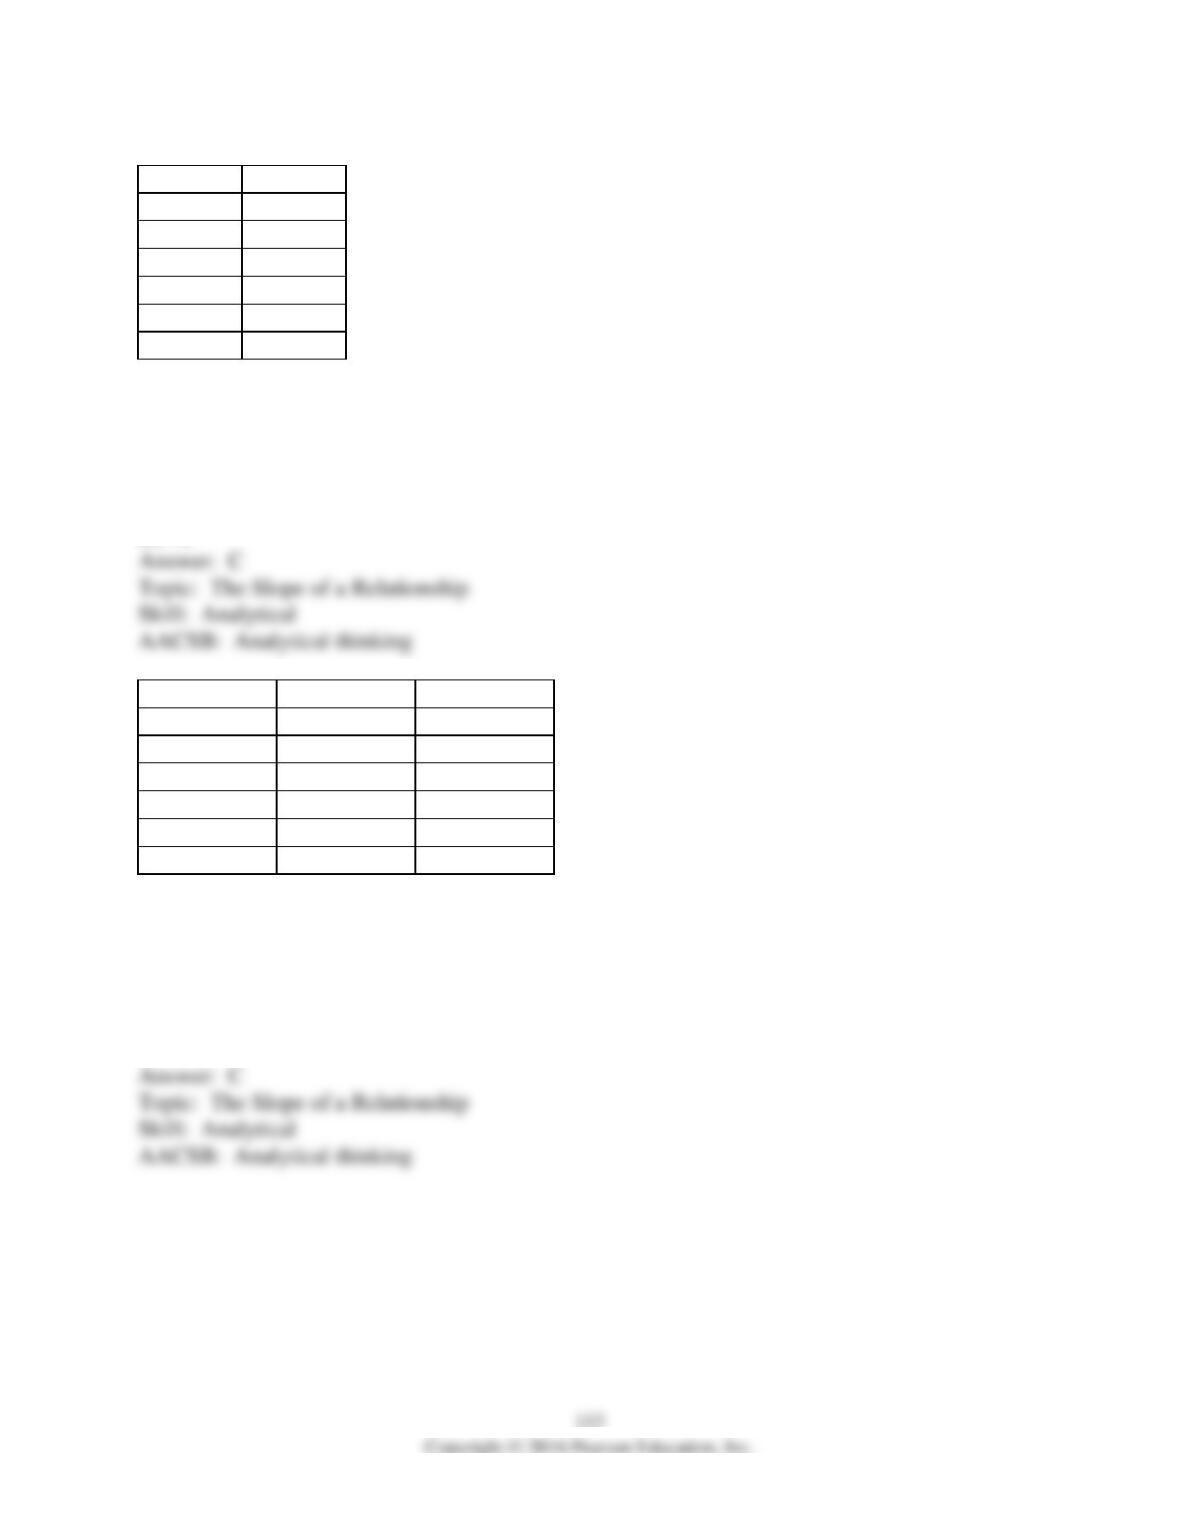
15) In the table above, y is measured along the y-axis and x along the x-axis. The slope of the
relationship between x = 0 and x = 2 is
A) -6.
B) 2.
C) 3.
D) 6.
x
y
10
50
9
70
8
100
7
130
6
170
5
220
16) In the table above, y is measured along the y-axis and x along the x-axis. What is the value of
the slope between the x = 8 and x = 6?
A) -0.057
B) -19.28
C) -35
D) 70
Point
X
Y
a
100
50
b
200
75
c
300
100
d
400
100
e
500
75
f
600
50
17) In the table above, Y is measured along the y-axis and X along the x-axis. The slope between
points a and b is
A) 25.
B) 4.
C) 0.25.
D) -0.25.
18) In the table above, Y is measured along the y-axis and X along the x-axis. The slope between
points c and d is
A) 100.
B) 0.
C) 0.25.
D) -4.
19) In the table above, Y is measured along the y-axis and X along the x-axis. The slope between
points e and f is
A) -25.
B) 4.
C) 0.25.
D) -0.25.
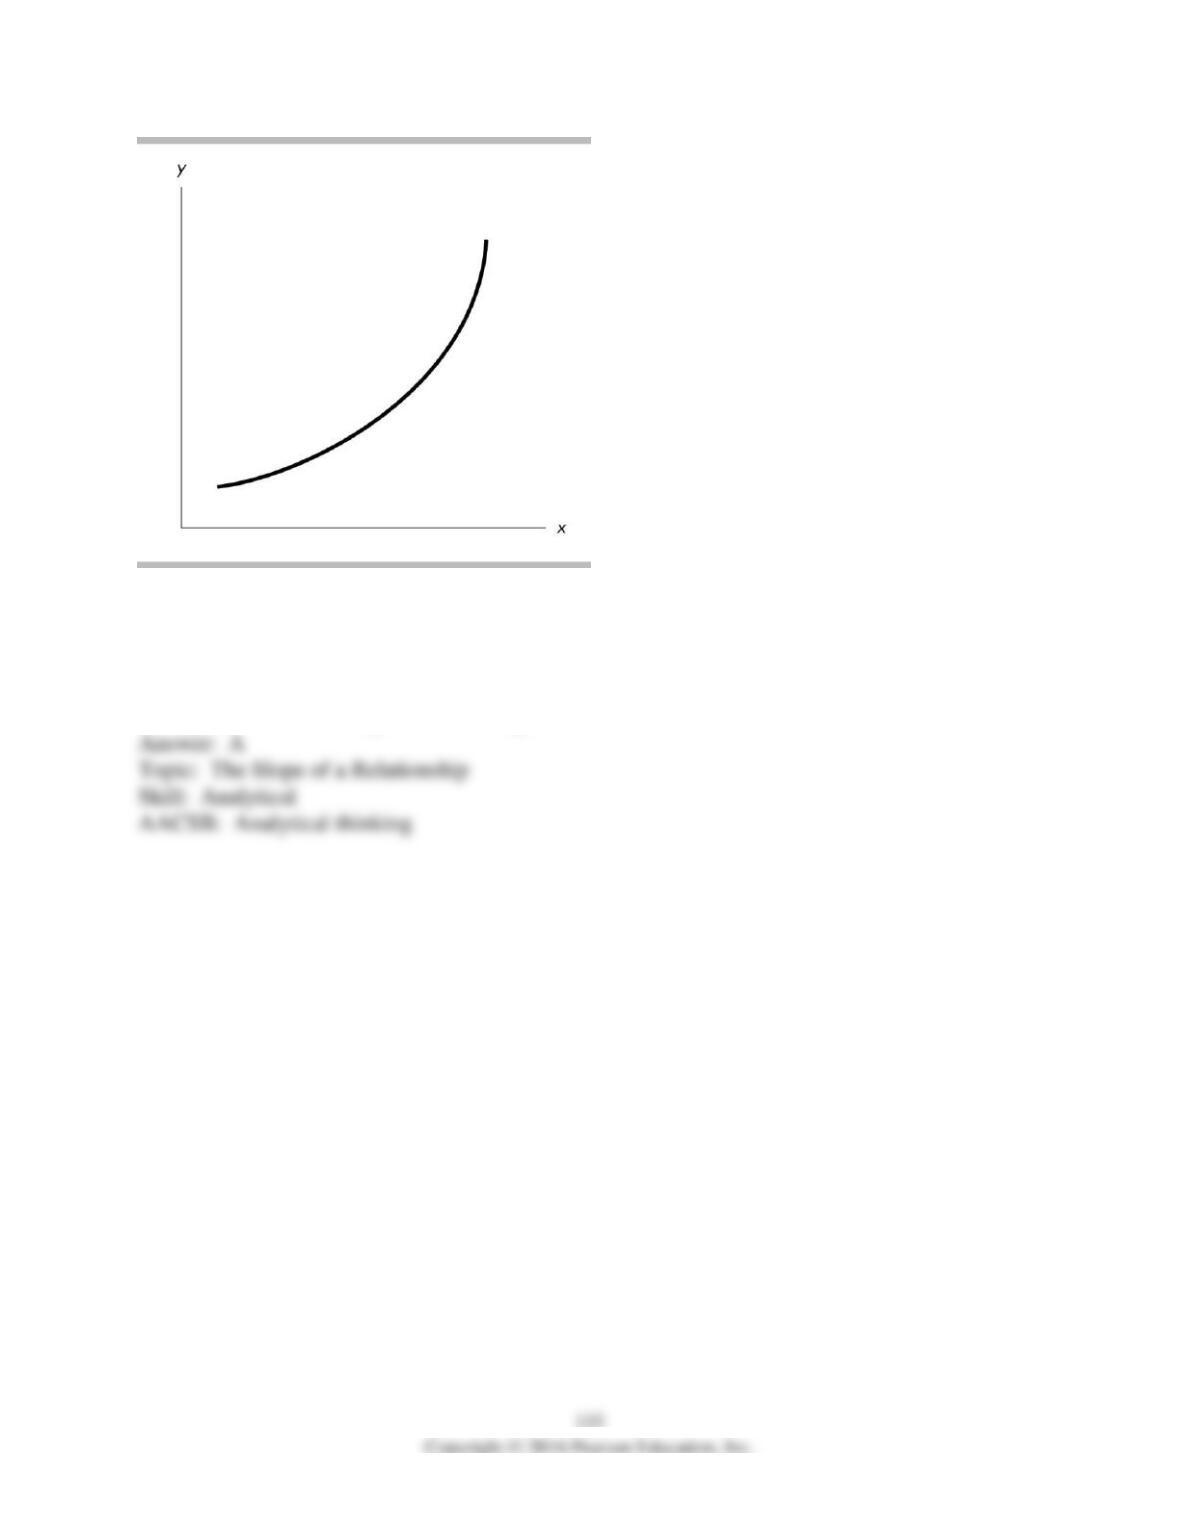
20) In the above figure, the curve has a slope that is ________.
A) positive and becoming larger in magnitude
B) positive and becoming smaller in magnitude
C) negative and becoming larger in magnitude
D) negative and becoming smaller in magnitude
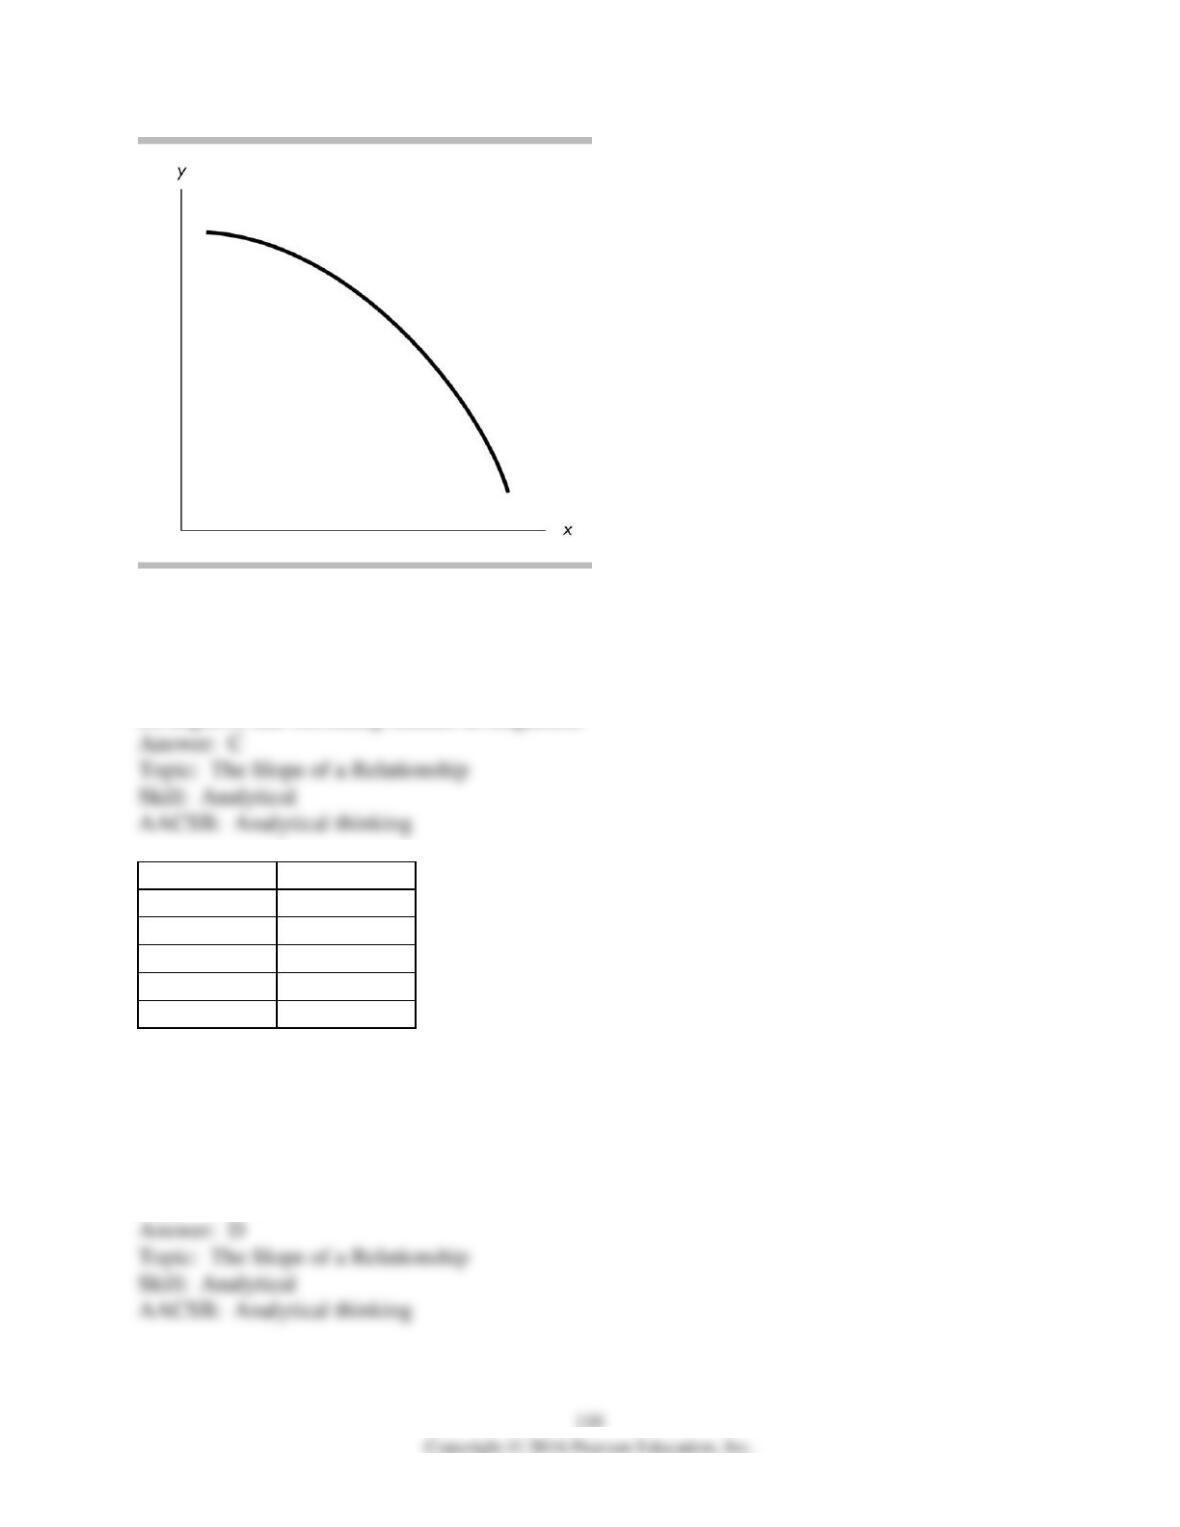
21) In the above figure, the curve has a slope that is ________.
A) positive and becoming larger in magnitude
B) positive and becoming smaller in magnitude
C) negative and becoming larger in magnitude
D) negative and becoming smaller in magnitude
x
y
0
4
1
5
2
8
3
13
4
20
22) In the above table, the relationship between x and y is ________ and, with y measured on the
vertical axis, the slope between y = 5 and y = 8 is equal to ________.
A) negative; 8
B) negative; 6
C) positive; 5
D) positive; 3
23) The slope of a straight line is
A) variable.
B) increasing.
C) decreasing.
D) constant.
24) The slope of a straight line is
A) always equal to zero.
B) calculated as y/x at any point.
C) constant.
D) always greater than zero.
25) With y measured on the vertical axis and x measured on the horizontal axis, the slope of a
straight line is defined as
A) y/x.
B) x/y.
C) (change in y)/ (change in x).
D) (change in x)/ (change in y).
26) Along a straight line, when x equals 90, then y equals 30. When x equals 120, then y equals
40. The slope of the straight line is
A) 1/3.
B) -1/3.
C) 3.
D) -3.
27) Along a straight line, the value of y is always equal to the value of x. The slope of the line is
A) -1.
B) 0.
C) 1.
D) infinite.
x
y
0
0
1
3
2
6
3
9
4
12
5
15
28) Using the data in the table above, with y measured on the vertical axis, the slope of the line
relating y to x is
A) 1/3.
B) 1.
C) 3.
D) 6.
x-variable
(on the horizontal
axis)
y-variable
(on the vertical axis)
10
28
15
31
20
34
29) The above table shows data on two variables. If these data were graphed, the slope of the line
would be
A) 3/5.
B) 3.
C) 5/3.
D) impossible to determine from the information given.
x-variable
(on the horizontal
axis)
y-variable
(on the vertical axis)
8
14
10
18
12
22
30) The above table gives data on two variables. If these data were graphed, the slope of the line
would be
A) 1.
B) -2.
C) 2.
D) -4.
31) The above table gives data on two variables. If these data were graphed, their relationship
would
A) be a straight line.
B) be a curved line.
C) show a negative relationship.
D) nonexistent.
x-variable
(on the horizontal
axis)
y-variable
(on the vertical axis)
100
50
200
125
300
200
32) The above table shows data on two variables. If these data were graphed, the slope of the line
would be
A) 1/2.
B) 4/3.
C) 2/3.
D) 3/4.
Quantity
Price
0
50
8
40
16
30
24
20
32
10
36
5
33) Using the data in the above table
A) the variables quantity and price are positively related.
B) the variables quantity and price are negatively related.
C) the variables quantity and price are neither positively nor negatively related.
D) an increase in price is likely to cause an increase in quantity.
34) If we use the numbers in the above table to draw a graph, with the price on the vertical axis
and the quantity on the horizontal axis, the line relating price and quantity has a slope of
A) 0.8.
B) -8.0.
C) -1.25.
D) 8.0.