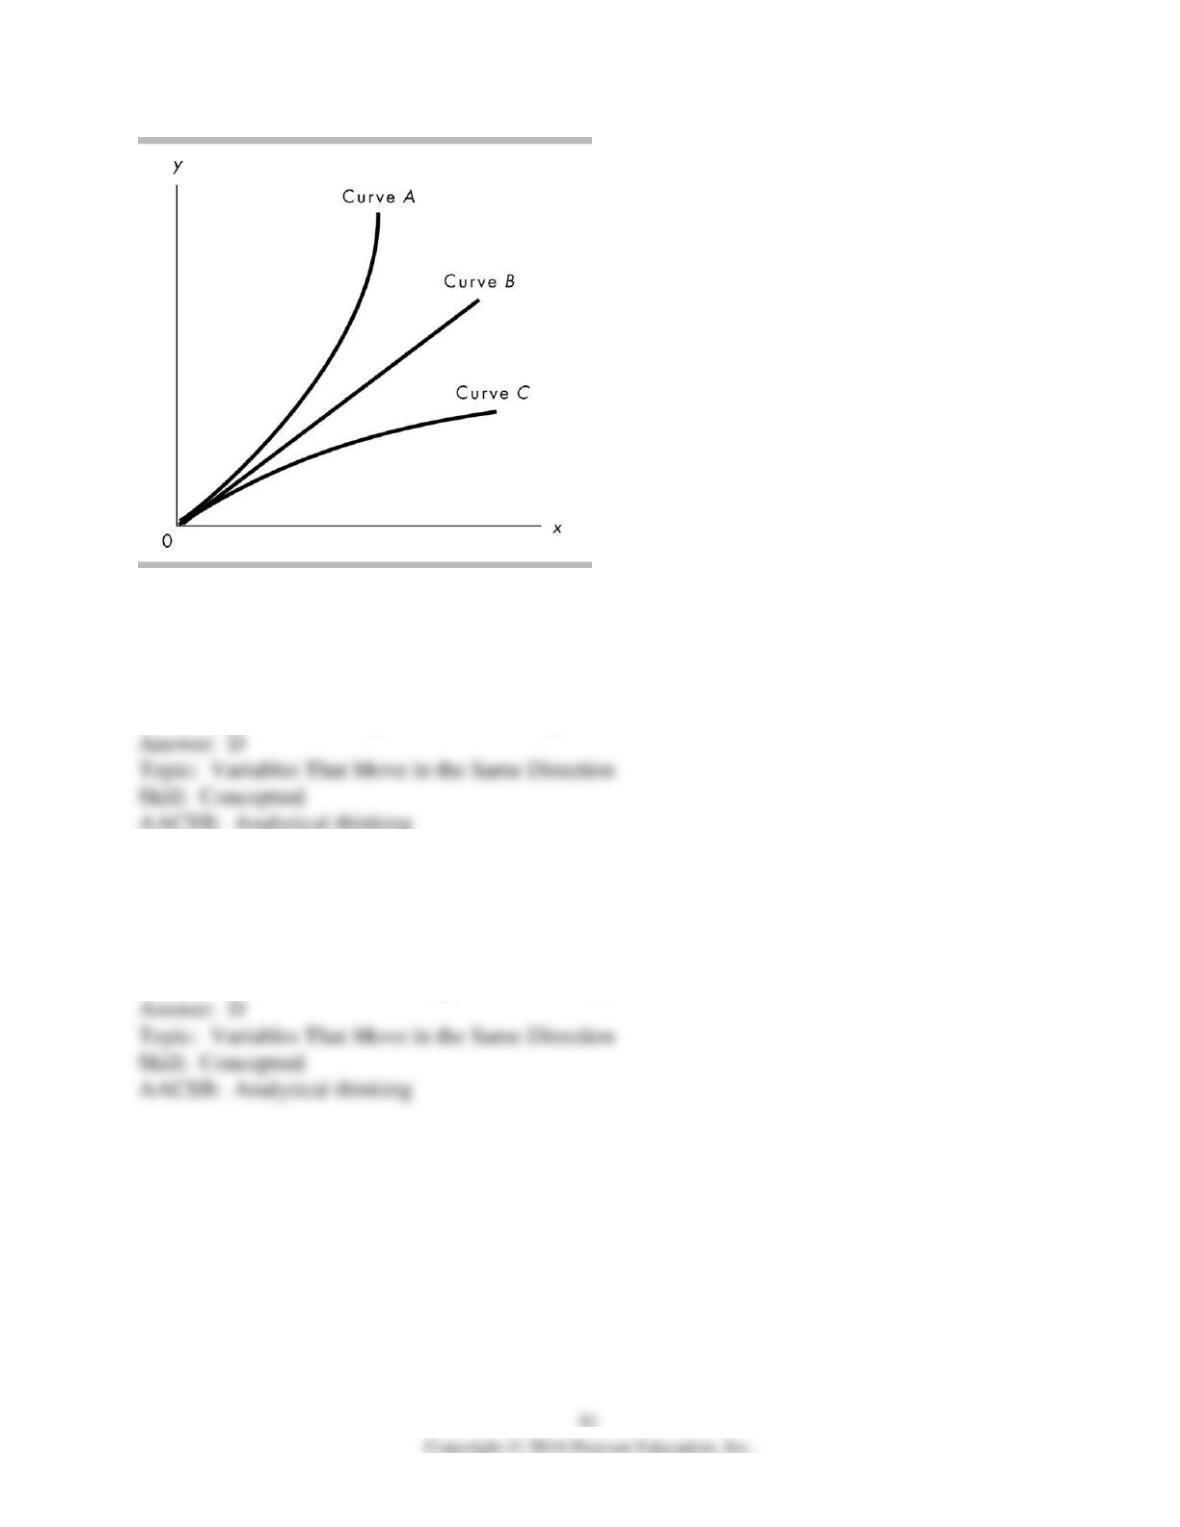
8) In the above figure, which curve shows a positive relationship between x and y?
A) only curve A
B) only curve B
C) only curve C
D) All the curves show a positive relationship.
9) In the above figure, which curve shows a negative relationship between x and y?
A) only curve A
B) only curve B
C) only curve C
D) None of the curves show a negative relationship.
10) A scatter diagram with the price of vacations to Mexico on the vertical axis and the price of
vacations to California on the horizontal axis shows a positive relationship. If the price of
vacations to Mexico were placed on the horizontal axis, and the price of vacations to California
on the vertical axis, the relationship would be
A) negative relationship, also called a direct relationship.
B) negative relationship, also called an inverse relationship.
C) positive relationship, also called a direct relationship.
D) positive relationship, also called an inverse relationship.
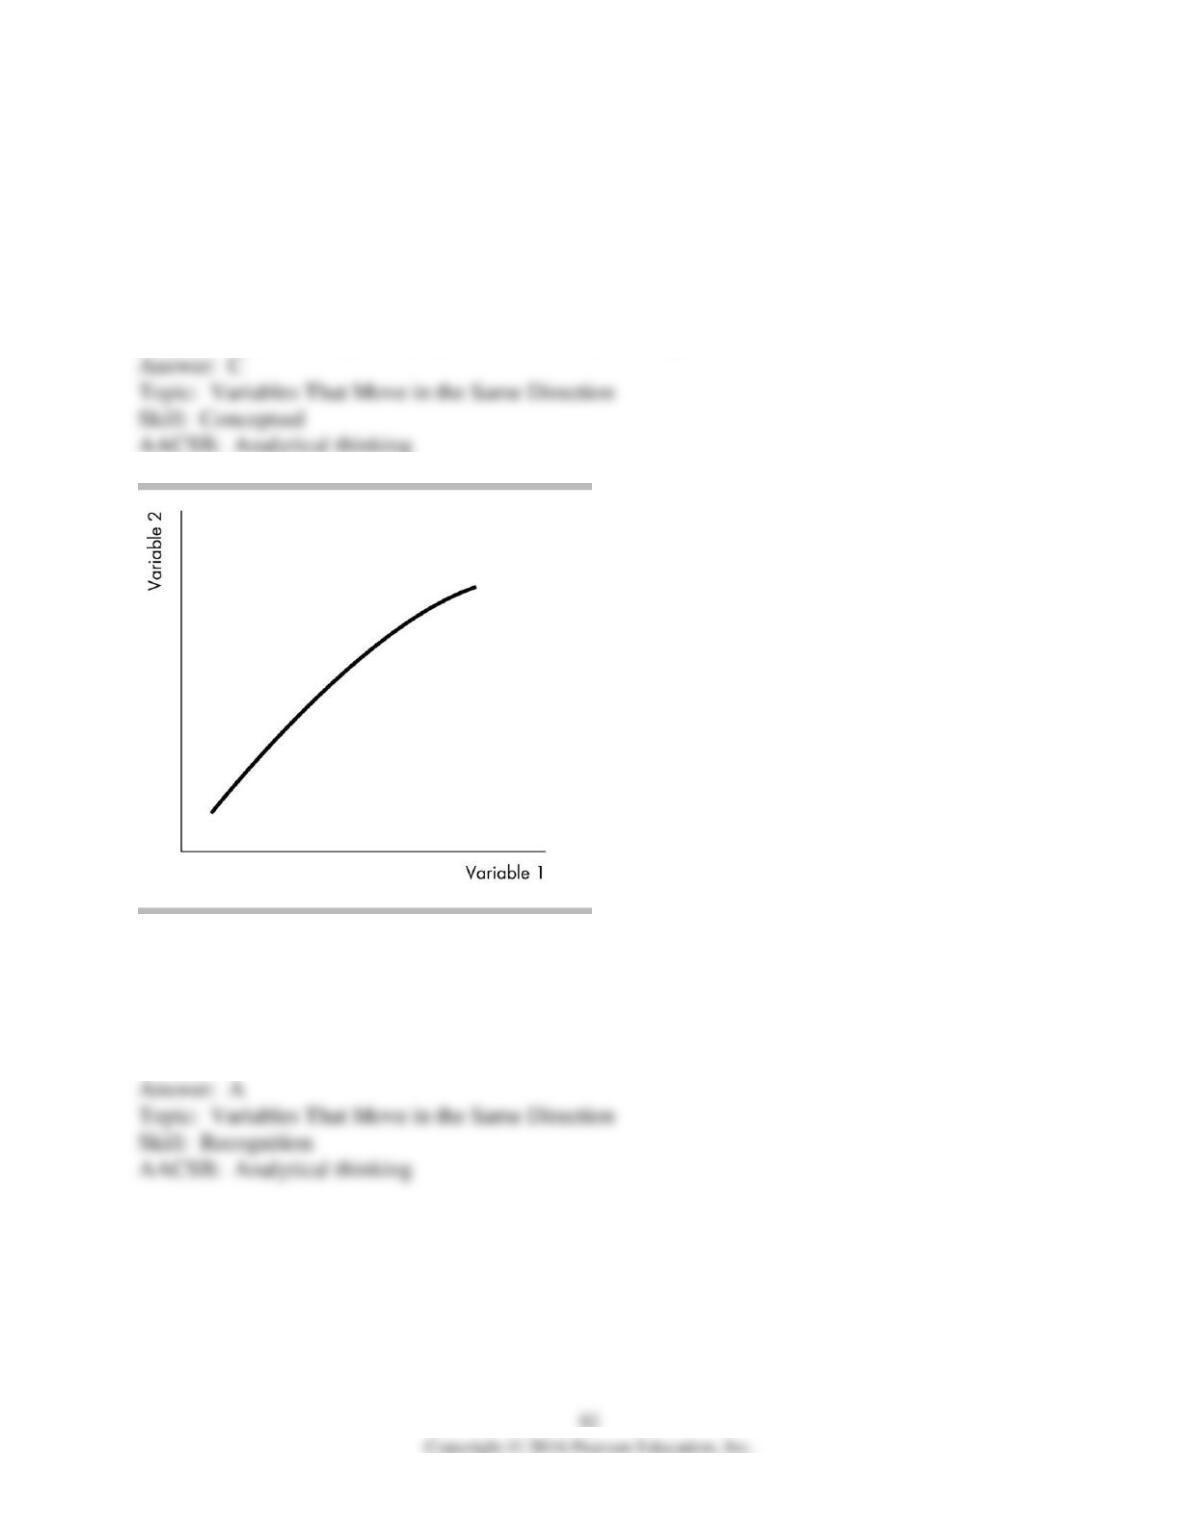
11) The figure above shows ________ relationship between the two variables.
A) a positive
B) a negative
C) no
D) an inverse
12) “As you devote more hours to studying, your GPA increases.” A graph of this relationship
would show
A) a positive relationship.
B) a direct relationship.
C) an inverse relationship.
D) Both answers A and B are correct.
13) “As interest rates rise, people save more money.” A graph displaying this relationship would
show
A) an inverse relationship.
B) a positive relationship.
C) a cross-section graph.
D) a positive then a negative relationship.
14) “If you hire 1 worker, the worker can produce 20 pizzas a day. If you hire a 2nd worker, that
worker can produce 10 more pizzas. If you hire a 3rd worker, that worker can produce 2 more
pizzas a day.” A graph displaying this relationship between the number of employees and total
pizza output per day would show
A) a positive linear relationship.
B) an upward-sloping curve that becomes less steep.
C) a negative linear relationship.
D) a negatively-sloped curve that becomes less steep.
15) If you study 3 hours for an exam, you can raise your score by 30 points. If you study for
another 3 hours your score increases by 10 points. And if you study for another 3 hours, your
score will increase by 5 more points. A graph displaying this relationship between the number of
hours studied and your total exam score would show
A) a positive linear relationship.
B) an upward-sloping curve that becomes less steep.
C) a negative linear relationship.
D) an upward-sloping curve that becomes more steep.
16) Suppose you produce 10 bikes a day for a total cost of $1000. Total costs increase to $1100
when you produce 15 bikes. Finally, total costs increase to $1300 if you make 20 bikes. A graph
showing the relationship between total costs and the number of bikes produced would be
A) a negatively-sloped line that becomes steeper.
B) a positively-sloped line that becomes steeper.
C) a negatively-sloped line that becomes flatter.
D) a positively-sloped line that becomes flatter.
Total household
income (dollars)
Total consumption
(dollars)
30,000
27,000
40,000
35,000
50,000
38,000
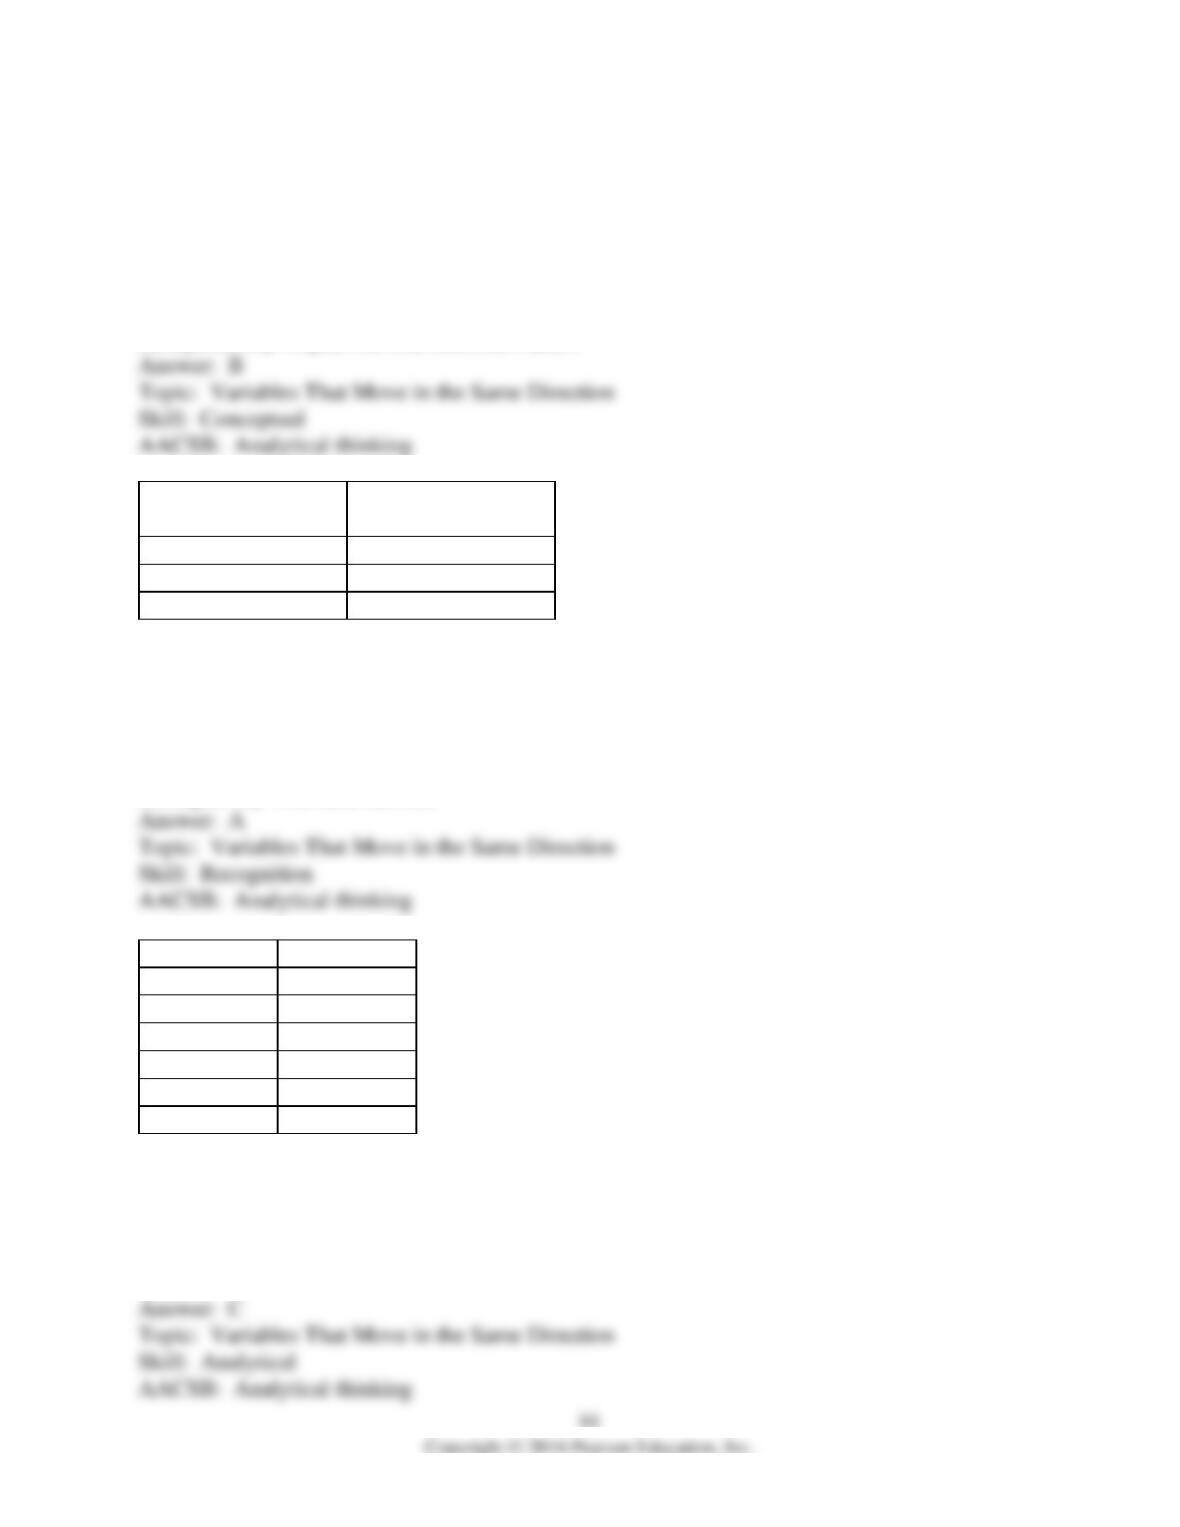
17) The data in the table above shows the relationship between the Joneses’ total consumption
and total household income. Based on these data, total consumption varies
A) directly with their total household income.
B) independently of their total household income.
C) inversely with their total household income.
D) negatively with their income.
x
y
0
0
2
6
4
12
6
18
8
24
10
30
18) In the above table, when x increases from 4 units to 6 units, y changes by ________ units.
A) 2
B) -2
C) 6
D) -6
19) The above table indicates that variables x and y are
A) positively related.
B) inversely related.
C) negatively related.
D) not related.
x
y
0
2
1
5
2
8
3
11
4
14
5
17
20) Given the information in the above table, the relationship between x and y is
A) positive, and the curve becomes flatter as x increases.
B) positive, and the curve becomes steeper as x increases.
C) positive and linear.
D) negative and linear.
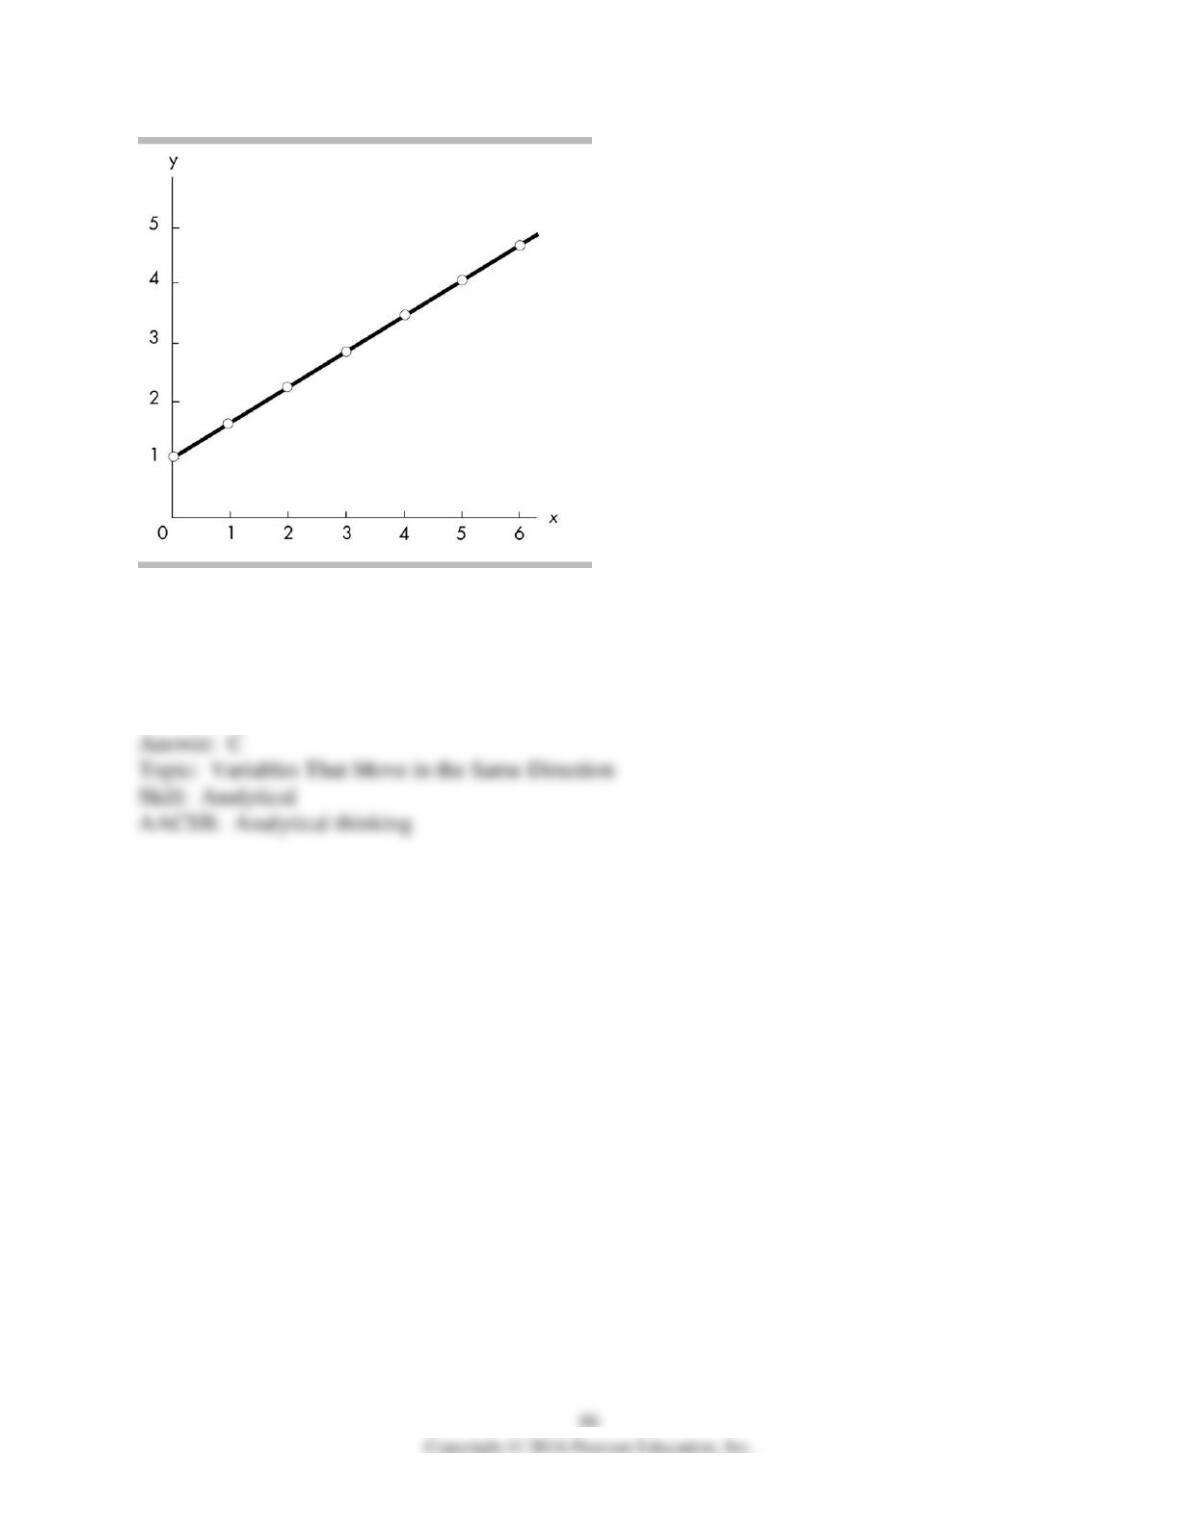
21) In the above figure, the relationship between x and y is
A) positive, and the curve becomes flatter as x increases.
B) positive, and the curve becomes steeper as x increases.
C) positive and linear.
D) negative and linear.
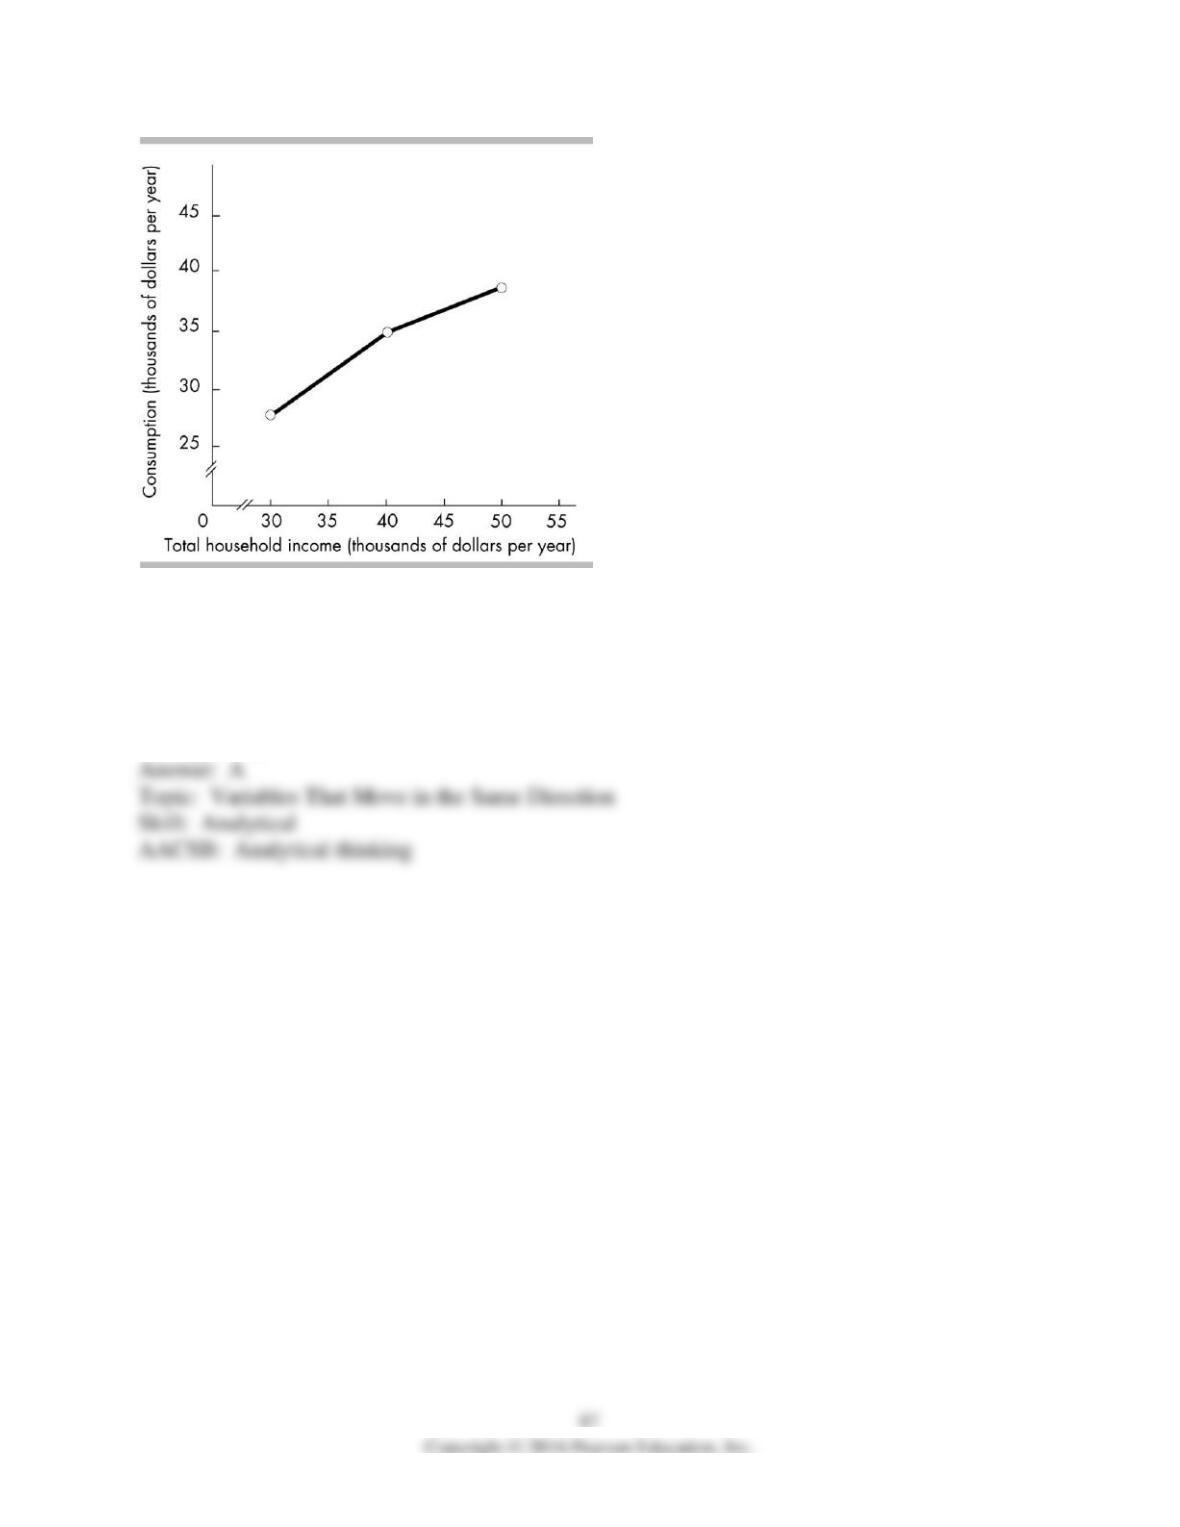
22) The above figure shows the relationship between the Joneses’ total consumption and total
household income. The figure illustrates that the Joneses’ total consumption varies
A) directly with their total household income.
B) independently of their total household income.
C) inversely with their total household income.
D) negatively with their income.
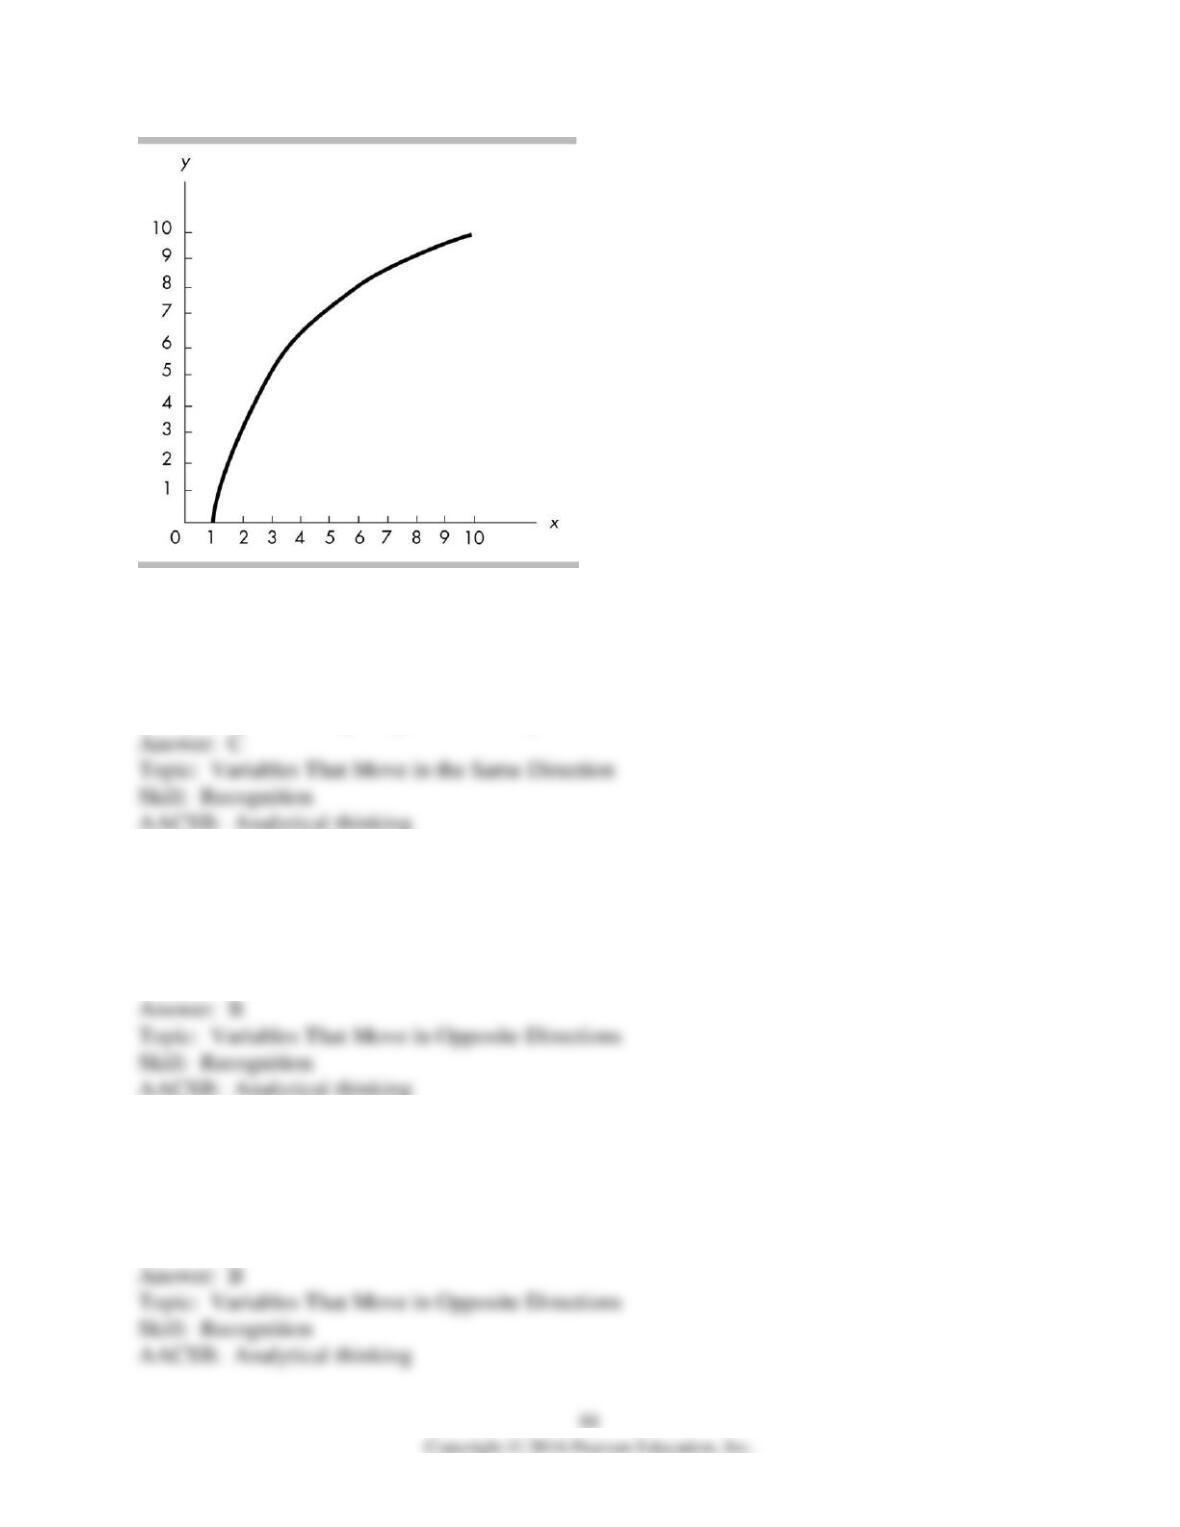
23) The relationship depicted in the above figure is
A) a negative linear relationship.
B) a positive linear relationship.
C) a positive becoming less steep relationship.
D) a positive becoming steeper relationship.
24) Whenever one variable increases, another variable decreases. The two variables are
A) definitely related through a third variable.
B) negatively related.
C) positively related.
D) unrelated to each other.
25) If variable x always increases when variable y decreases, x and y are said to be
A) positively related.
B) negatively related.
C) unrelated.
D) trend related.
26) If there is an inverse relationship between variable x and variable y, then an increase in the
value of variable x will be accompanied by
A) an increase in the value of variable y.
B) a decrease in the value of variable y.
C) no change in the value of variable y.
D) variable y reaching its maximum value.
27) If there is an inverse relationship between two variables, the graph of this relationship
A) will be a horizontal line.
B) will be downward-sloping.
C) might be horizontal.
D) will be upward-sloping.
28) A negative relationship exists between the variable measured along the y-axis and the
variable measured along the x-axis if
A) a reduction in the variable measured along the x-axis is associated with a reduction in the
variable measured along the y-axis.
B) an increase in the variable measured along the x-axis is associated with an increase in the
variable measured along the y-axis.
C) the variable measured along the x-axis and the variable measured along the y-axis move in the
opposite direction.
D) the variable measured along the x-axis and the variable measured along the y-axis move in the
same direction.
29) Along a curve, when one variable increases, the other variable decreases. The curve showing
this relationship
A) might be horizontal.
B) has a positive slope.
C) has a negative slope.
D) has an increasing then a decreasing slope.
30) “As the price of gasoline increases, fewer people buy cars that are gas guzzlers.” A graph
showing this relationship would have
A) a negative slope.
B) a positive relationship.
C) a direct relationship.
D) a horizontal line.
31) A graph shows that as fees to use ATM machines increase, people use them less frequently.
The graph of this relationship would show
A) an inverse relationship.
B) a negative relationship.
C) a direct relationship.
D) Both answers A and B are correct.
32) As the number of days without rain increases, the amount of wheat per acre grown declines.
A graph showing this relationship would have a curve
A) that is a horizontal line.
B) that is a vertical line.
C) showing a positive relationship.
D) None of the above answers are correct.
33) As a firm produces more and more DVDs, the average cost of producing each DVD falls. A
curve showing the behavior of the average cost of a DVD as more DVDs are produced
A) would be positively and then negatively sloped.
B) would be positively sloped.
C) would be horizontal.
D) would be negatively sloped.
34) Suppose that we find that student grades and time spent at parties move in opposite
directions. A graph of the relationship between these two variables would curve
A) upward and be linear.
B) upward and may be linear or nonlinear.
C) downward and be linear.
D) downward and may be linear or nonlinear.
35) The faster an automobile is driven (speed), the lower the miles per gallon (mpg) for that
automobile. Given this information, we say that an automobile’s speed and mpg have
A) a direct relationship.
B) an inverse relationship.
C) a linear relationship.
D) a maximum relationship.
36) If the quantity of wood purchased decreases when the price of wood rises, a graph
representing these variables would have
A) time on the vertical axis.
B) the slope on the vertical axis.
C) a negative slope.
D) a positive slope.
37) A scatter diagram with the price of peanut butter on the vertical axis and the price of jelly on
the horizontal axis shows a negative relationship. If the price of jelly was placed on the vertical
axis and the price of peanut butter was placed on the horizontal axis, the relationship would be a
A) negative relationship, also called a direct relationship.
B) negative relationship, also called an inverse relationship.
C) positive relationship, also called a direct relationship.
D) positive relationship, also called an inverse relationship.
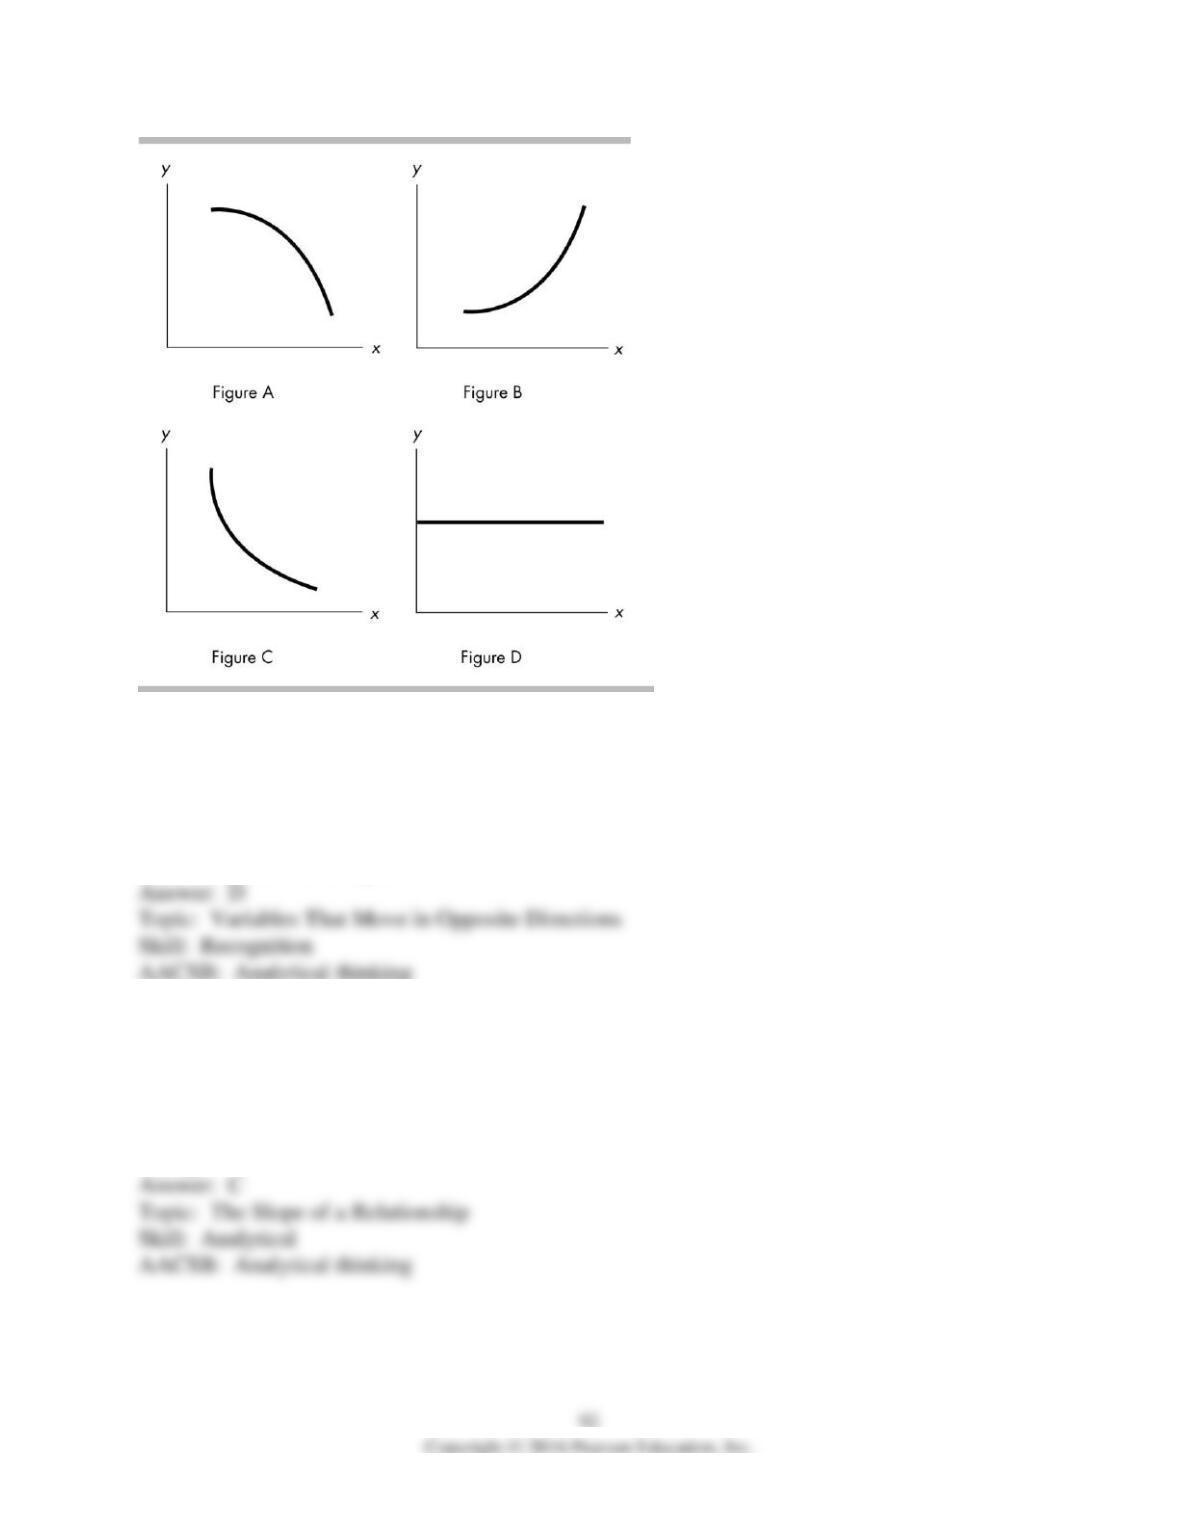
38) In the above figure, if there is a negative relationship between the variables x and y, which of
the graphs above can be used to indicate this?
A) Figure A
B) Figure B
C) Figure C
D) both Figure A and Figure C
39) In the above figure, which of the graphs demonstrates a curve with a decreasing slope, that
is, a slope getting smaller in magnitude as x increases?
A) Figure A
B) Figure B
C) Figure C
D) Figure D
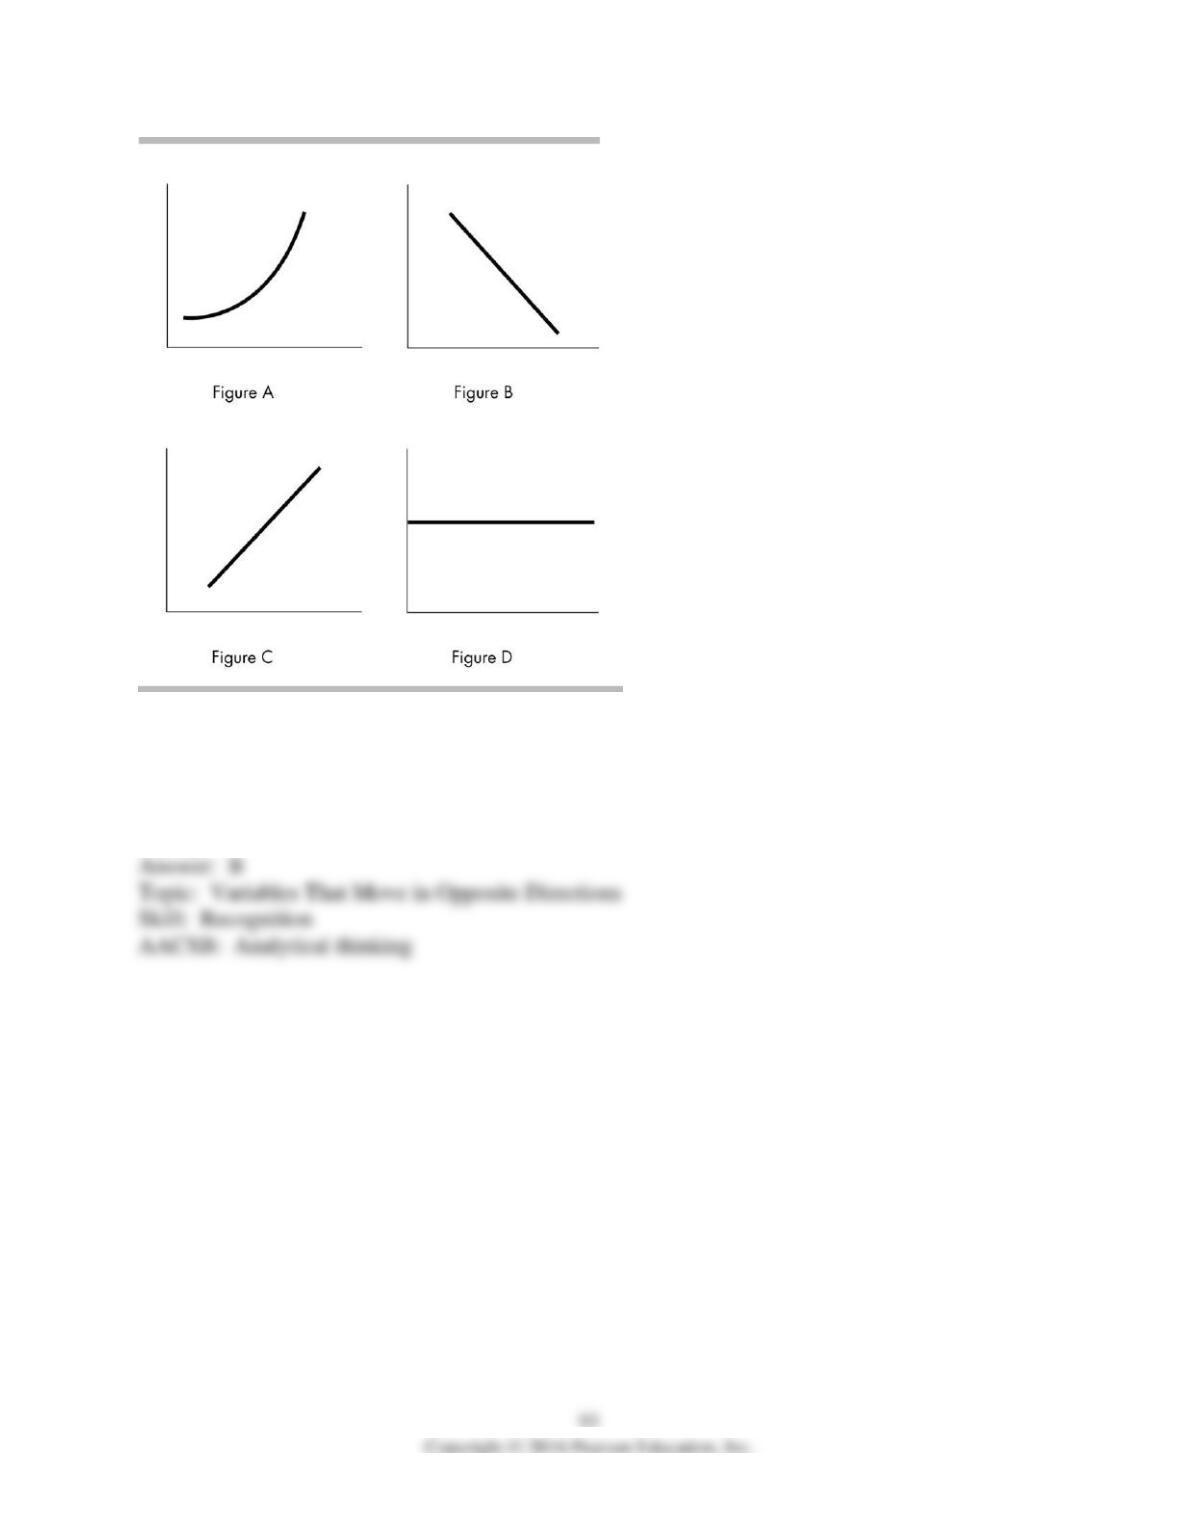
40) In the above figure, a negative relationship is demonstrated in which of the graphs?
A) Figure A
B) Figure B
C) Figure C
D) Figure D
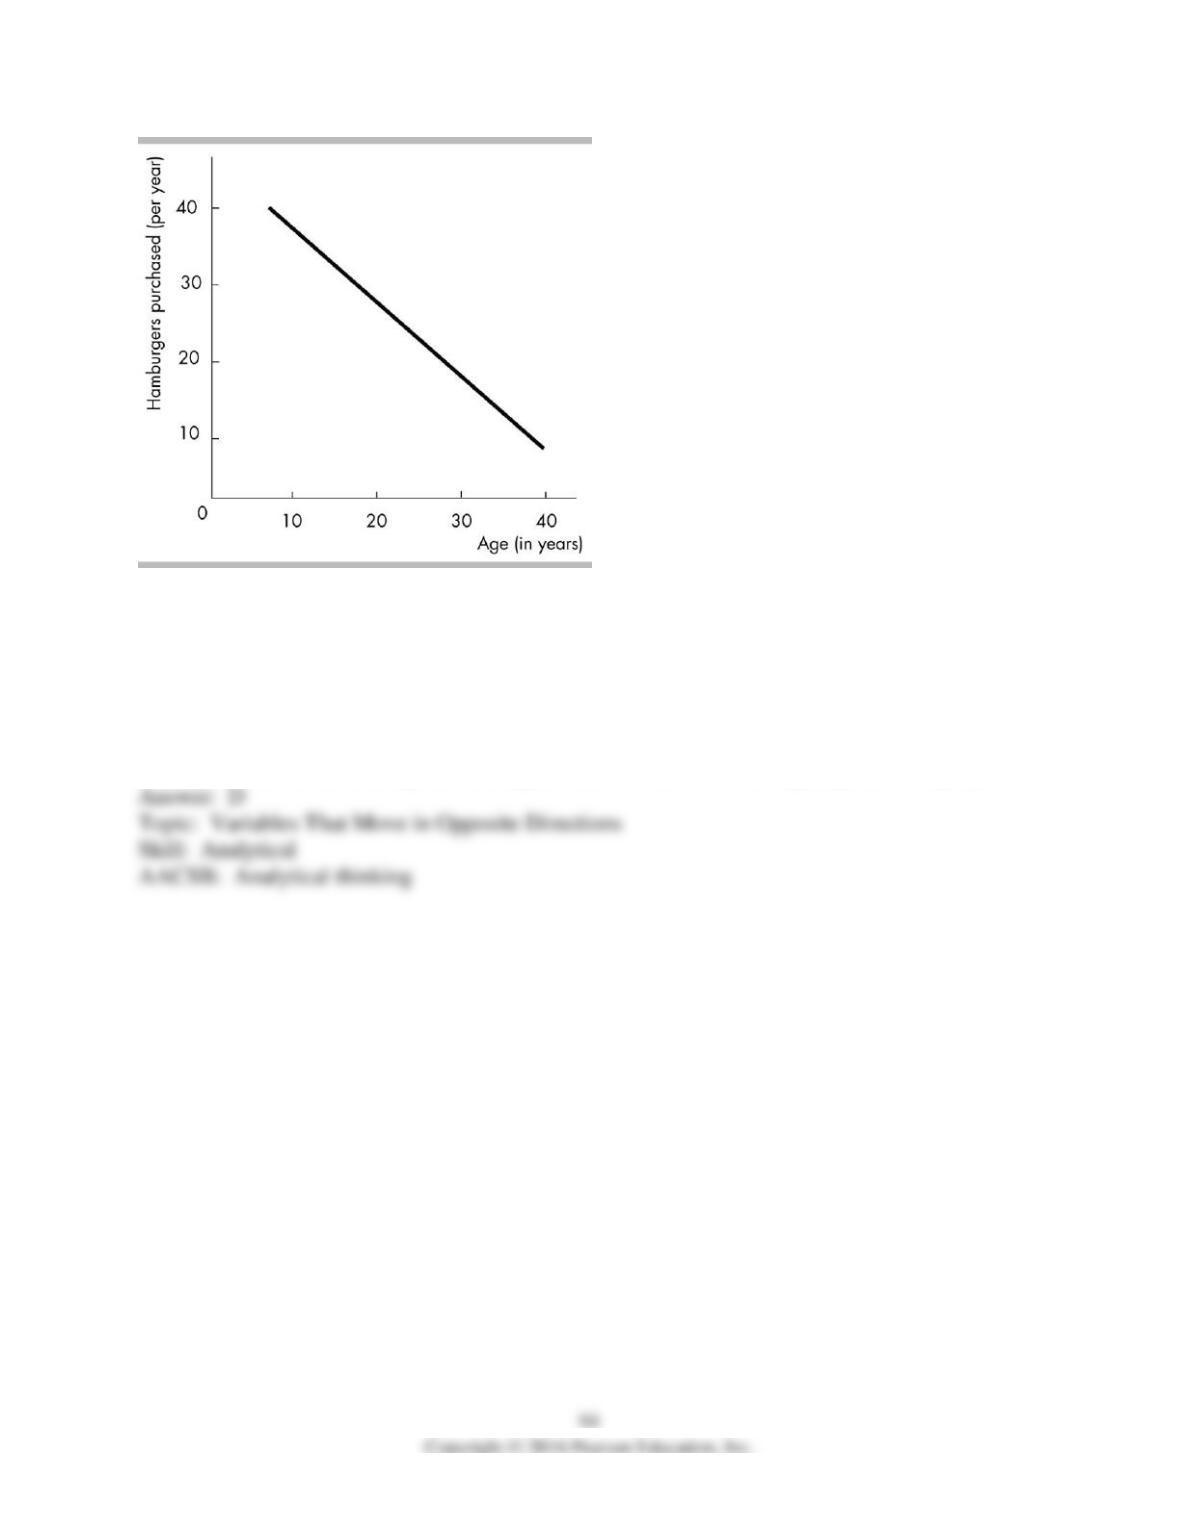
41) The above figure depicts a
A) positive non-linear relationship between age and the number of hamburgers purchased per
year.
B) negative non-linear relationship between age and the number of hamburgers purchased per
year.
C) positive linear relationship between age and the number of hamburgers purchased per year.
D) negative linear relationship between age and the number of hamburgers purchased per year.
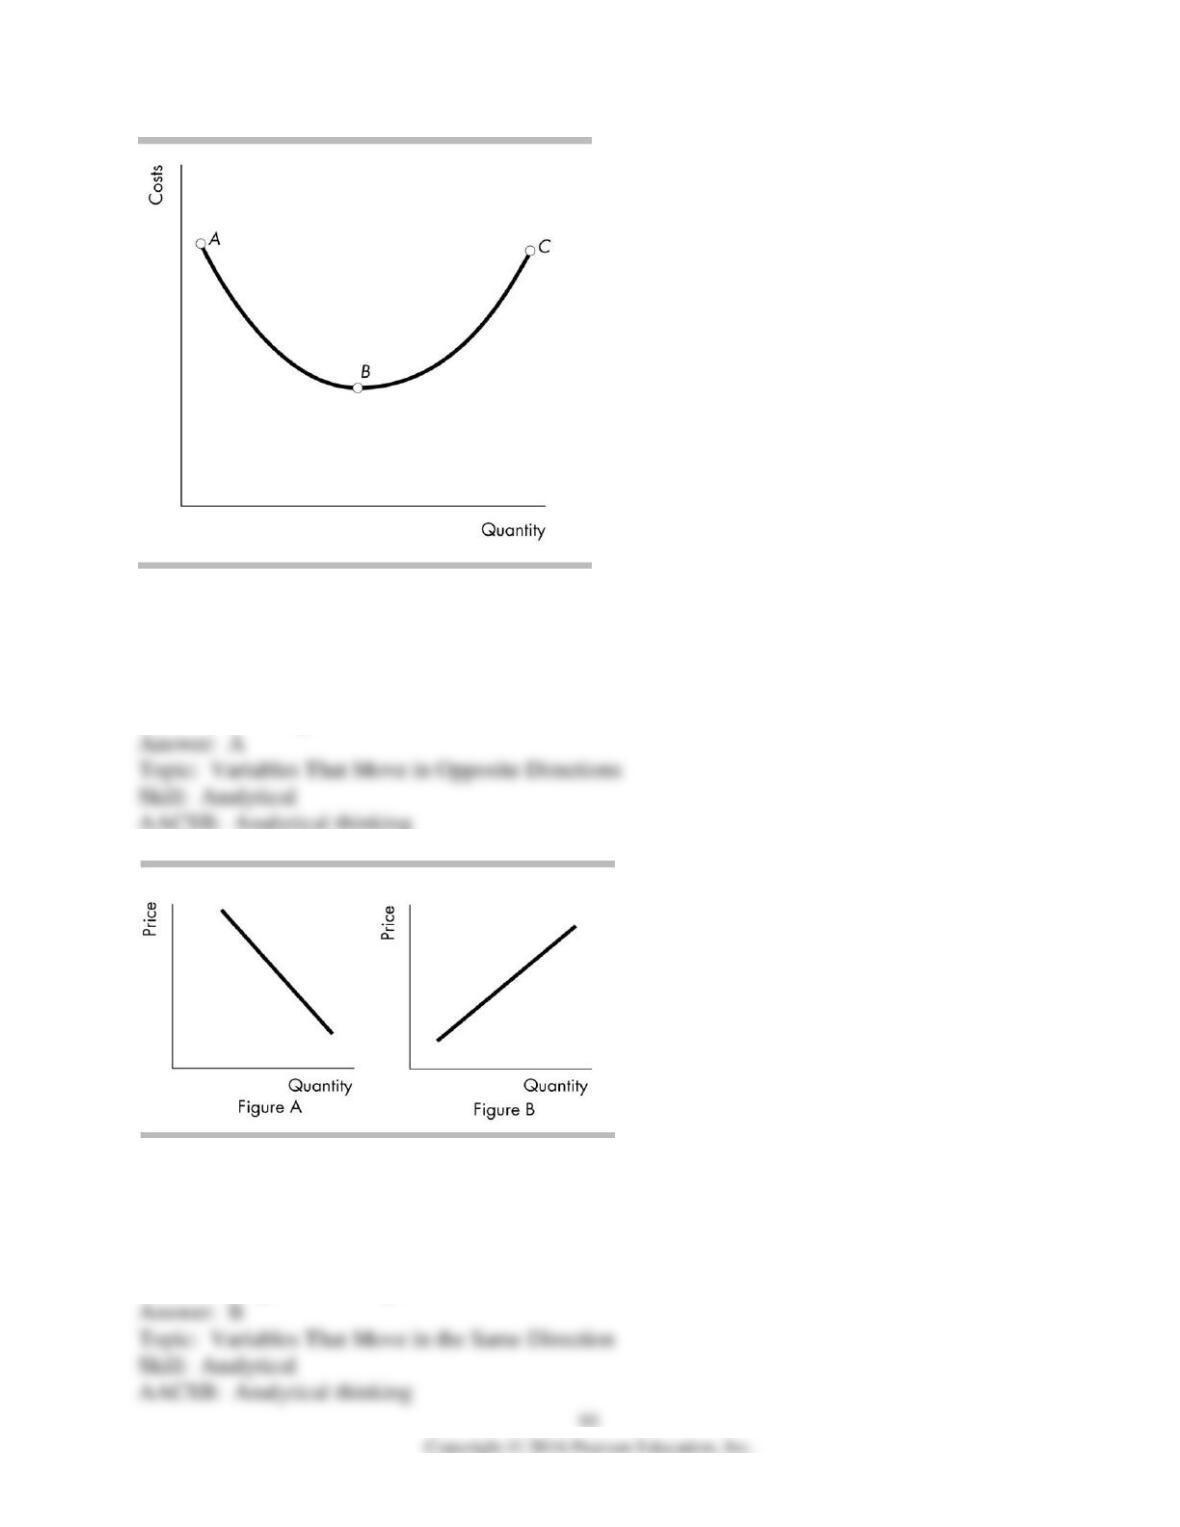
42) In the above figure, the relationship between costs and quantity is negative
A) between point A and point B.
B) between point B and point C.
C) along the entire curve.
D) no where along the curve.
43) In the above, a positive relationship between price and quantity is shown in
A) Figure A.
B) Figure B.
C) both Figure A and Figure B.
D) neither Figure A nor Figure B.
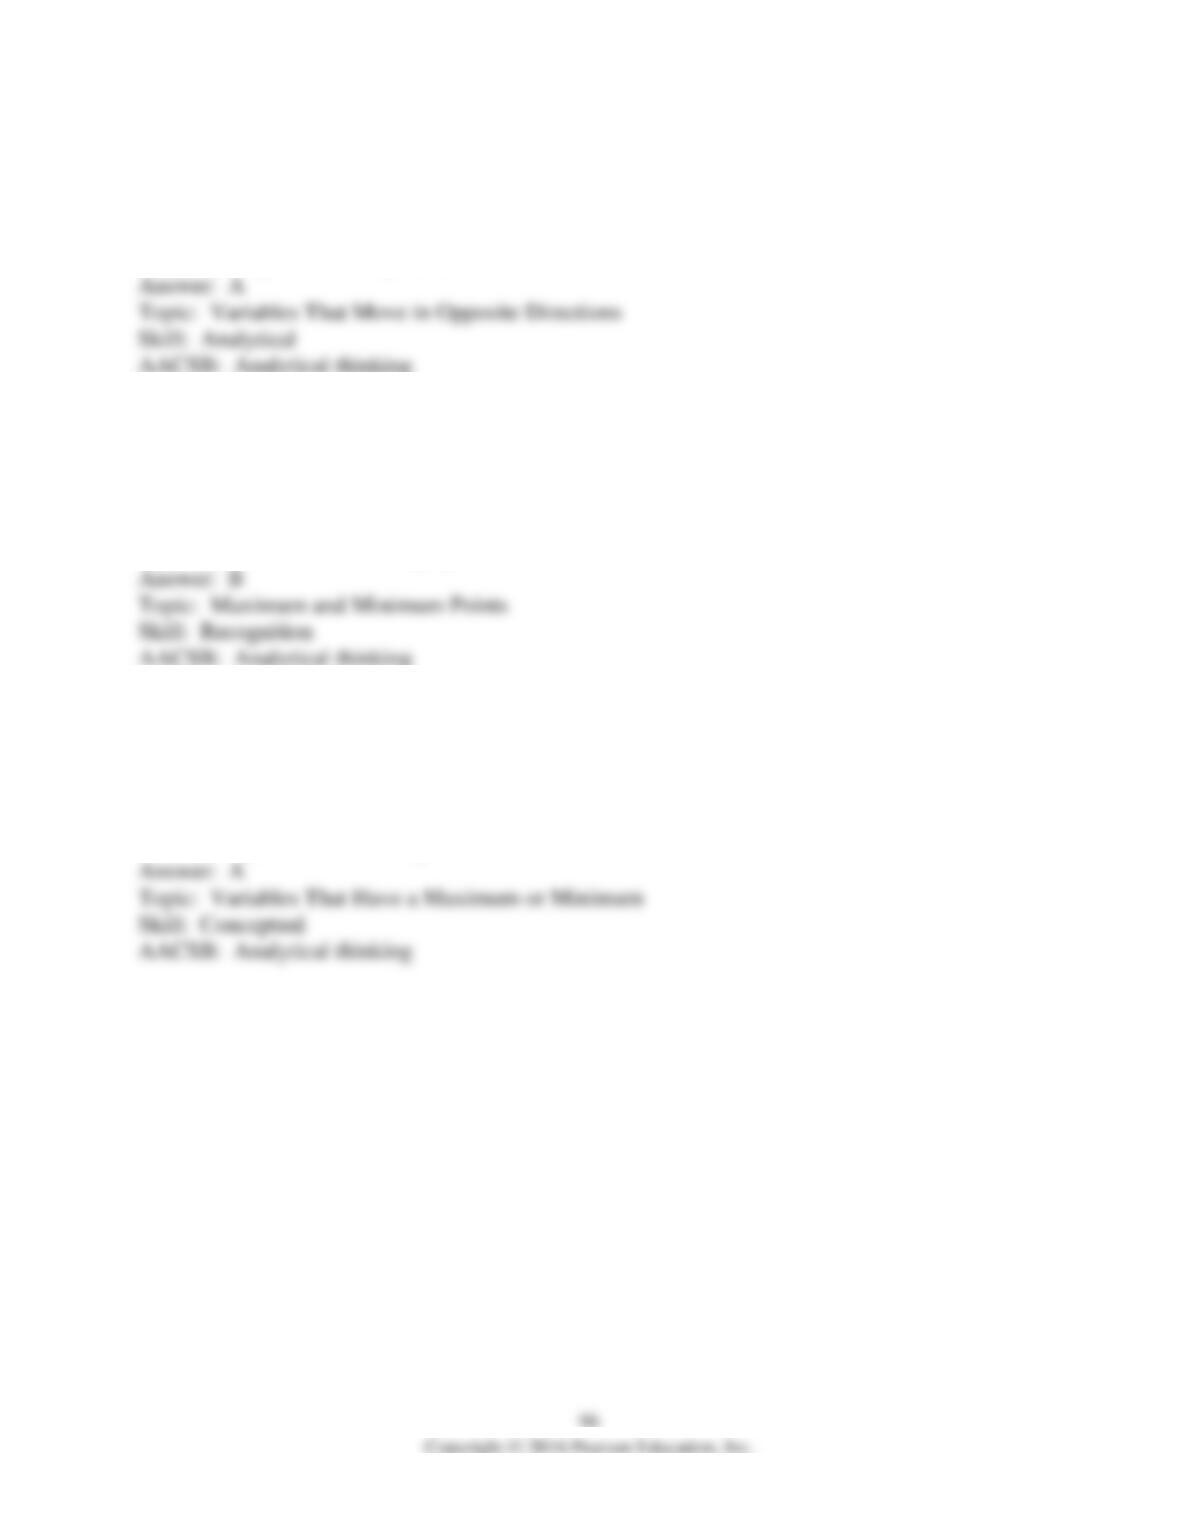
44) In the above figure, a negative relationship between price and quantity is shown in
A) Figure A.
B) Figure B.
C) both Figure A and Figure B.
D) neither Figure A nor Figure B.
45) If a graph shows a negative relationship between two variables which then becomes a
positive relationship, this curve would
A) always be an upward-sloping line.
B) have a minimum point.
C) have a maximum point.
D) always be a downward-sloping line.
46) As a firm expands its output, cost per unit of output (average cost) decreases and then
increases. Average cost and output have
A) a relationship with a minimum.
B) a relationship with a maximum.
C) no relationship.
D) a linear positive relationship.
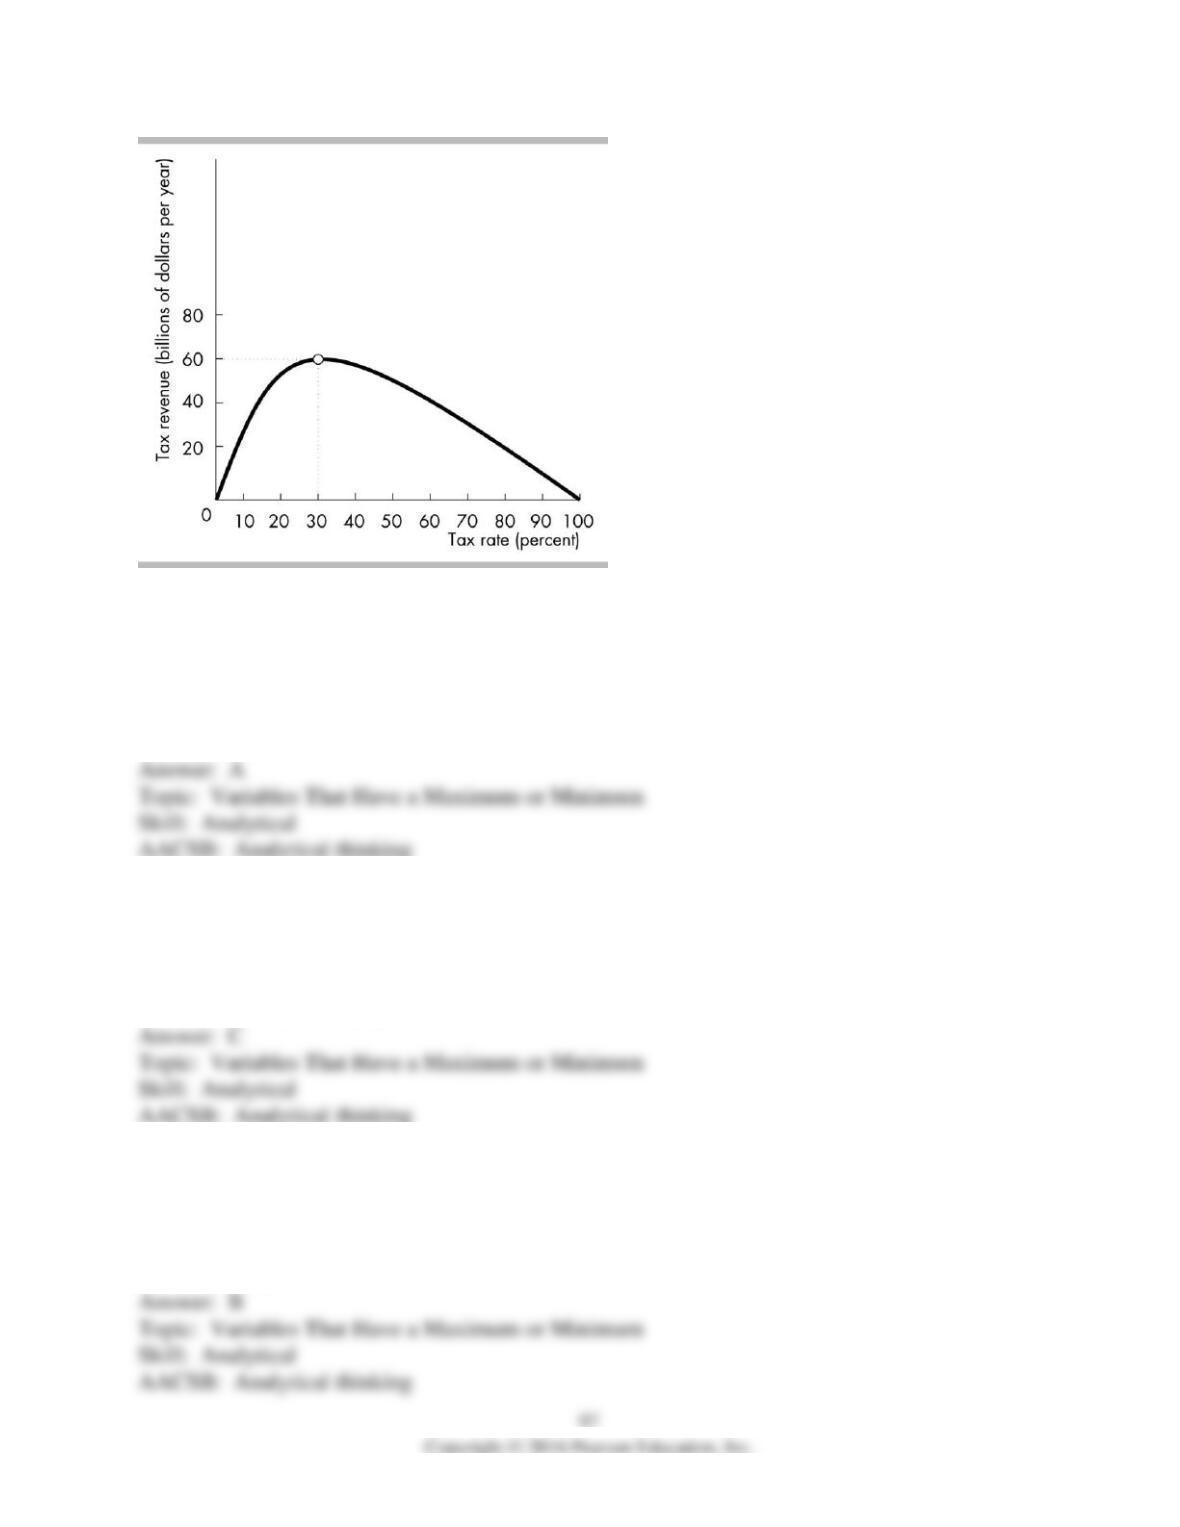
47) In the above figure, the relationship between the tax rate and tax revenue is positive and
becoming less steep between tax rates of
A) 0 percent and 30 percent.
B) 30 percent and 100 percent.
C) 0 percent and 100 percent.
D) None of the above answers are correct.
48) In the above figure, if the tax rate is increased from 20 percent to 30 percent, tax revenue
A) decreases.
B) is constant.
C) increases.
D) may increase or decrease.
49) In the above figure, tax revenue is at a maximum when the tax rate is
A) 0 percent.
B) 30 percent.
C) 50 percent.
D) 100 percent.
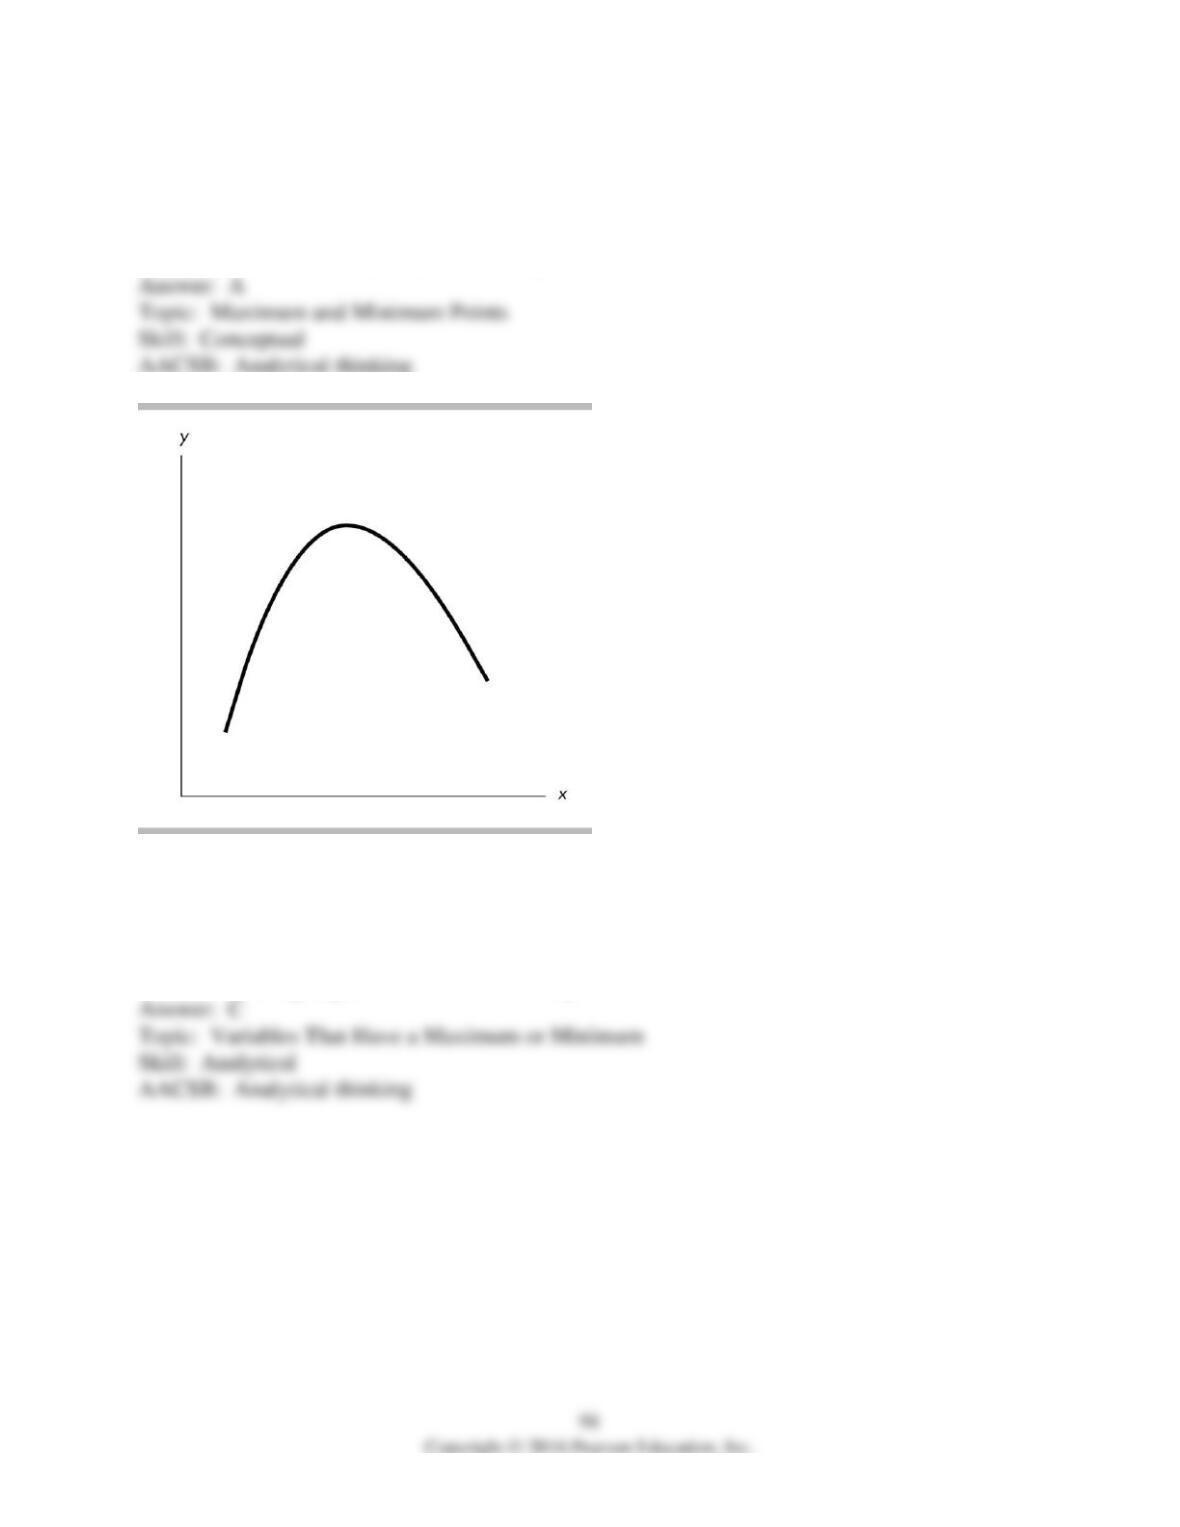
50) As a curve approaches a maximum point, the slope will
A) be positive, then negative after the maximum point.
B) be negative, then positive after the maximum point.
C) remain constant on either side of the maximum point.
D) increase before and after the maximum point.
51) In the figure above, the relationship between the x variable and the y variable
A) is positive.
B) is negative.
C) starts by being positive and then becomes negative.
D) starts by being negative and then becomes positive.
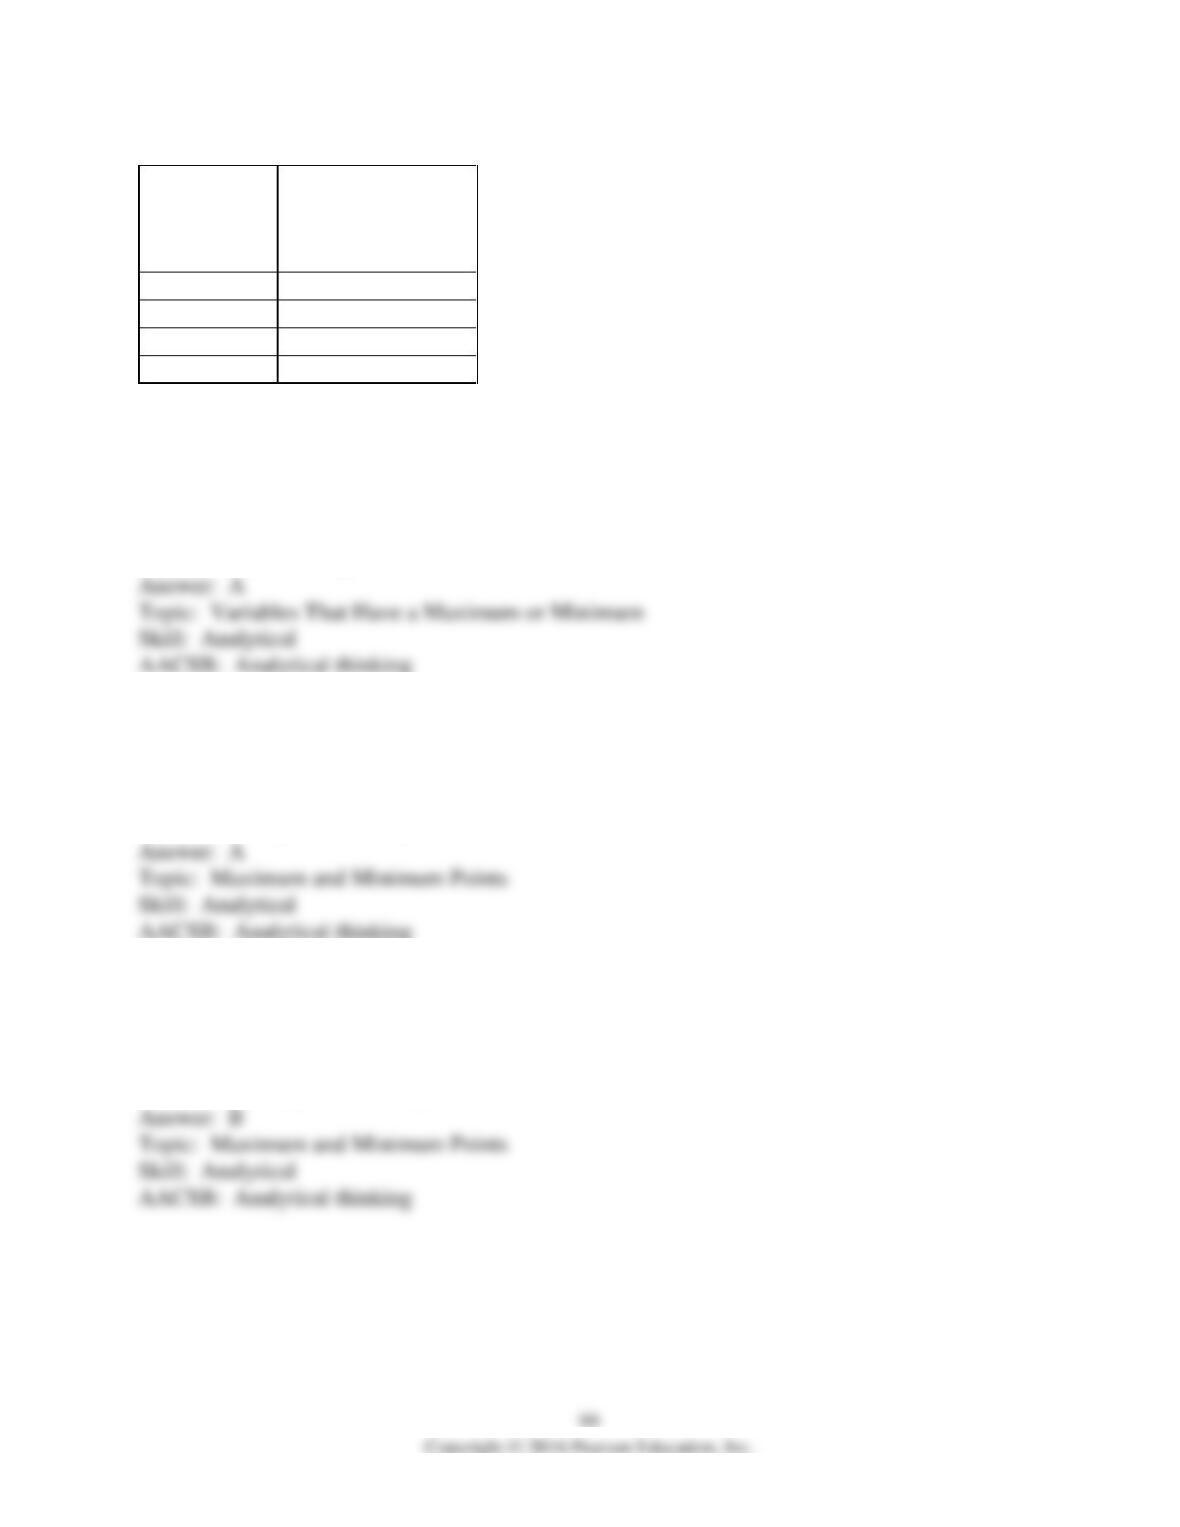
52) Graphing the data in the above table with the number of workers on the horizontal axis and
the average cost on the vertical axis, the graph would show
A) first a negative and then a positive relationship.
B) a horizontal line.
C) no relationship.
D) a linear relationship.
53) If a curve rises and then falls, it shows a
A) maximum.
B) minimum.
C) linear relationship.
D) constant slope relationship.
54) If a curve falls and then rises, it shows
A) a maximum.
B) a minimum.
C) a linear relationship.
D) a constant slope relationship.
Total number
of workers
Average cost of
producing a
television set
(dollars)
4
1,250
10
750
13
770
15
850
55) When y changes, x stays the same. The line depicting this relationship would be
A) vertical.
B) horizontal.
C) linear with a negative slope.
D) linear with a positive slope.
56) A graph measures y on the vertical axis and x on the horizontal. The curve on the graph is a
horizontal line. From this fact we know that
A) the value of x never changes.
B) the value of y does not depend on the value of x.
C) the ratio of x to y is constant.
D) the slope of the line is not defined because y never changes.
57) A graph measures y on the vertical axis and x on the horizontal. The curve on the graph is a
vertical line. From this fact we know that
A) the value of x does not change when the value of y changes.
B) the value of y is constant.
C) the ratio of x to y is constant.
D) the ratio of y to x is constant.
58) The graph of two variables, x and y, is a horizontal line. This result indicates that x and y are
A) positively related.
B) negatively related.
C) not related.
D) falsely related.