25) What is a normative statement? Give an example.
26) Explain whether the statement “The government should increase tariffs on Japanese cars to
protect the American car industry from competition,” is a normative or positive statement.
7 Numeric and Graphing Questions
1) Suppose you are working four nights per week at your courses and your grade point average is
3.5. You want a higher grade and decide to study an extra night each week. Your GPA now rises
to 3.8. What is your marginal benefit from studying for one additional night a week?
2) Jerry is studying three nights per week and his grade point average is 3.1. He wants a higher
GPA and decides to study an extra night each week. His GPA now rises to 3.5. Had Jerry not
decided to study an extra night, he would have spent this night with his friends. What is Jerry’s
marginal benefit from studying for one additional night a week? What is his marginal cost of
increasing the study time by one night per week? Why does Jerry decide to study an extra night?
8 True or False
1) Scarcity applies to both the rich and the poor.
2) Scarcity affects only those who are in need.
3) Microeconomics is the study of topics such as national production and unemployment.
4) Macroeconomics is the study of aggregate variables such as national production and
unemployment.
5) The tools, instruments, machines, and buildings that people use to produce goods and services
are called human capital.
6) Most income in the United States is earned by business owners as profit.
7) The United States produces more services than goods.
8) When I buy an $12.00 movie ticket rather than two paperback books, the opportunity cost of
going to the movie is the two paperback books I did not buy.
9 Extended Problems
1) Suppose you plan to go to school this summer. The cost of tuition and textbooks is $1,400 and
housing, board, and entertainment will cost you $500. If you didn’t go to school, you’d live in
your parents’ house for free, but your other living expenses would be about the same. Also, if
you didn’t go to school you’d work full time and could earn $8,000. You can still work part time
while attending the summer school, but you will earn only $3,000.
a) What will the summer school cost you in terms of money explicitly paid?
b) What are the opportunity costs of going to summer school that you don’t pay explicitly?
Explain.
c) What is your total opportunity costs of going to school this summer? Explain your answer.
2) Jane is deciding whether to go to school for 8 weeks this summer. The cost of tuition and
textbooks is $1,700 and housing and other expenses will cost her $600. If she does not go to
school, she will live in her parents’ house for free and they will cover her food and other
expenses for her. Also, if Jane does not go to summer school she could work fulltime. But the
best job she can get pays only $600 per week, and Jane would only agree to give up her free time
for no less than $750 per week. However, if she goes to summer school, she’ll have to spend 40
hours a week attending classes and studying.
a) What will the summer school cost Jane in terms of money spent?
b) What are the opportunity costs of going to summer school that Jane does not pay explicitly?
Explain.
c) What is Jane’s total opportunity cost of going to school this summer? Explain your answer.
d) Suppose that if Jane does not go to summer school, she will eventually take the classes
anyway. What is Jane’s marginal benefit of going to summer school?
e) Suppose Jane decides to go to school in the summer. Explain her decision using the concepts
of marginal cost and marginal benefit.
3) Suppose Canon Inc. decided to invest 45 billion yen in developing and launching a new model
of its digital camera, expecting that it will bring additional sales of 60 billion yen. The company
has already invested 38 billion yen when the marketing department suddenly finds out that the
introduction of a similar camera by Sony will reduce Canon’s expected additional sales to 30
billion yen. The company’s management is trying to decide whether to continue investing in the
new product or close the project. Canon hires you as an economic consultant. So, think like an
economist to help the company’s management make their decision:
a) At this point in time, what is Canon’s marginal cost of introducing the new product?
b) What is Canon’s marginal benefit from introducing the new product?
c) Will you advise Canon to finish the project and introduce the new product? Why or why not?
What principles of economic thinking will help you analyze the situation and make the right
choice?
4) Your student association is looking for an auditorium to rent for an all-day conference. The
university’s Performing Arts Center is vacant on that day, so the association wants to rent it. The
physical plant manager tells you that the daily rent is $660, which includes $400 to cover part of
the cost paid to build the Center, $40 to cover part of its regular maintenance cost, $50 to help
pay for the building’s insurance, $100 to cover the extra cost of electricity that the university
would incur because of the conference, and $70 to pay for additional janitorial services for the
conference. You know that no one else wants to rent the Center on that day and you think that
the price that the manager charges is too high. But how much should you pay? Use the economic
way of thinking to answer this question and to convince the manager to accept your offer:
a) If you rent the Center, what will be the university’s marginal cost of renting the center to
you?
b) If you rent the Center, what will be the university’s marginal benefit of renting the center to
you?
c) What amount of rent should you offer? Convince the manager to accept your offer.
10 Appendix: Graphing Data
1) The horizontal axis in a graph
A) measures time in a scatter diagram.
B) measures the quality of a variable.
C) is named the y-axis.
D) is named the x-axis.
2) The vertical axis in a graph
A) is named the y-axis.
B) is named the x-axis.
C) is not used in a scatter diagram.
D) has no origin.
3) The value of the y-coordinate of a point in a graph is the length of a line from the point to the
A) origin.
B) scalar.
C) x-axis.
D) y-axis.
4) The value of the x-coordinate of a point in a graph is the length of a line from the point to the
A) origin.
B) scalar.
C) x-axis.
D) y-axis.
5) On the horizontal axis of a graph, generally
A) values increase from left to right.
B) values increase from right to left.
C) values can be positive and/or negative.
D) Both answers A and C are correct.
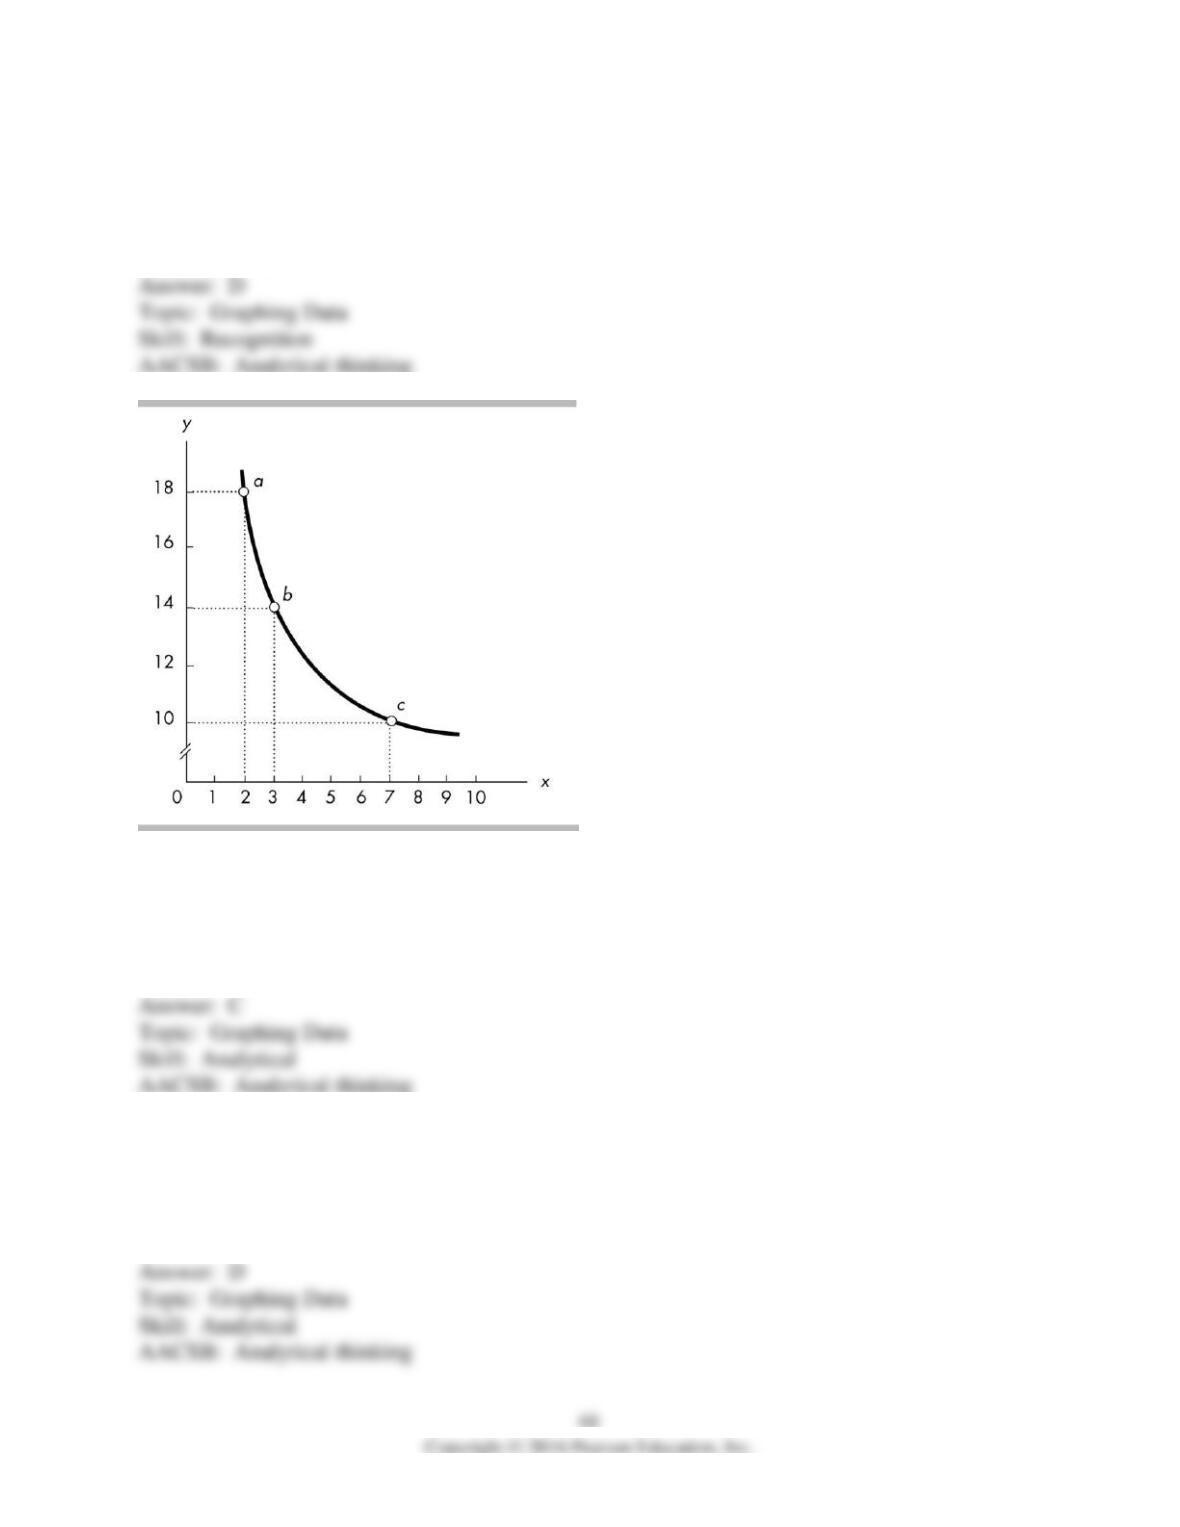
6) In the above figure, the x–coordinate of point b is
A) 1.
B) 2.
C) 3.
D) 14.
7) In the above figure, the y-coordinate of point b is
A) 1.
B) 2.
C) 3.
D) 14.
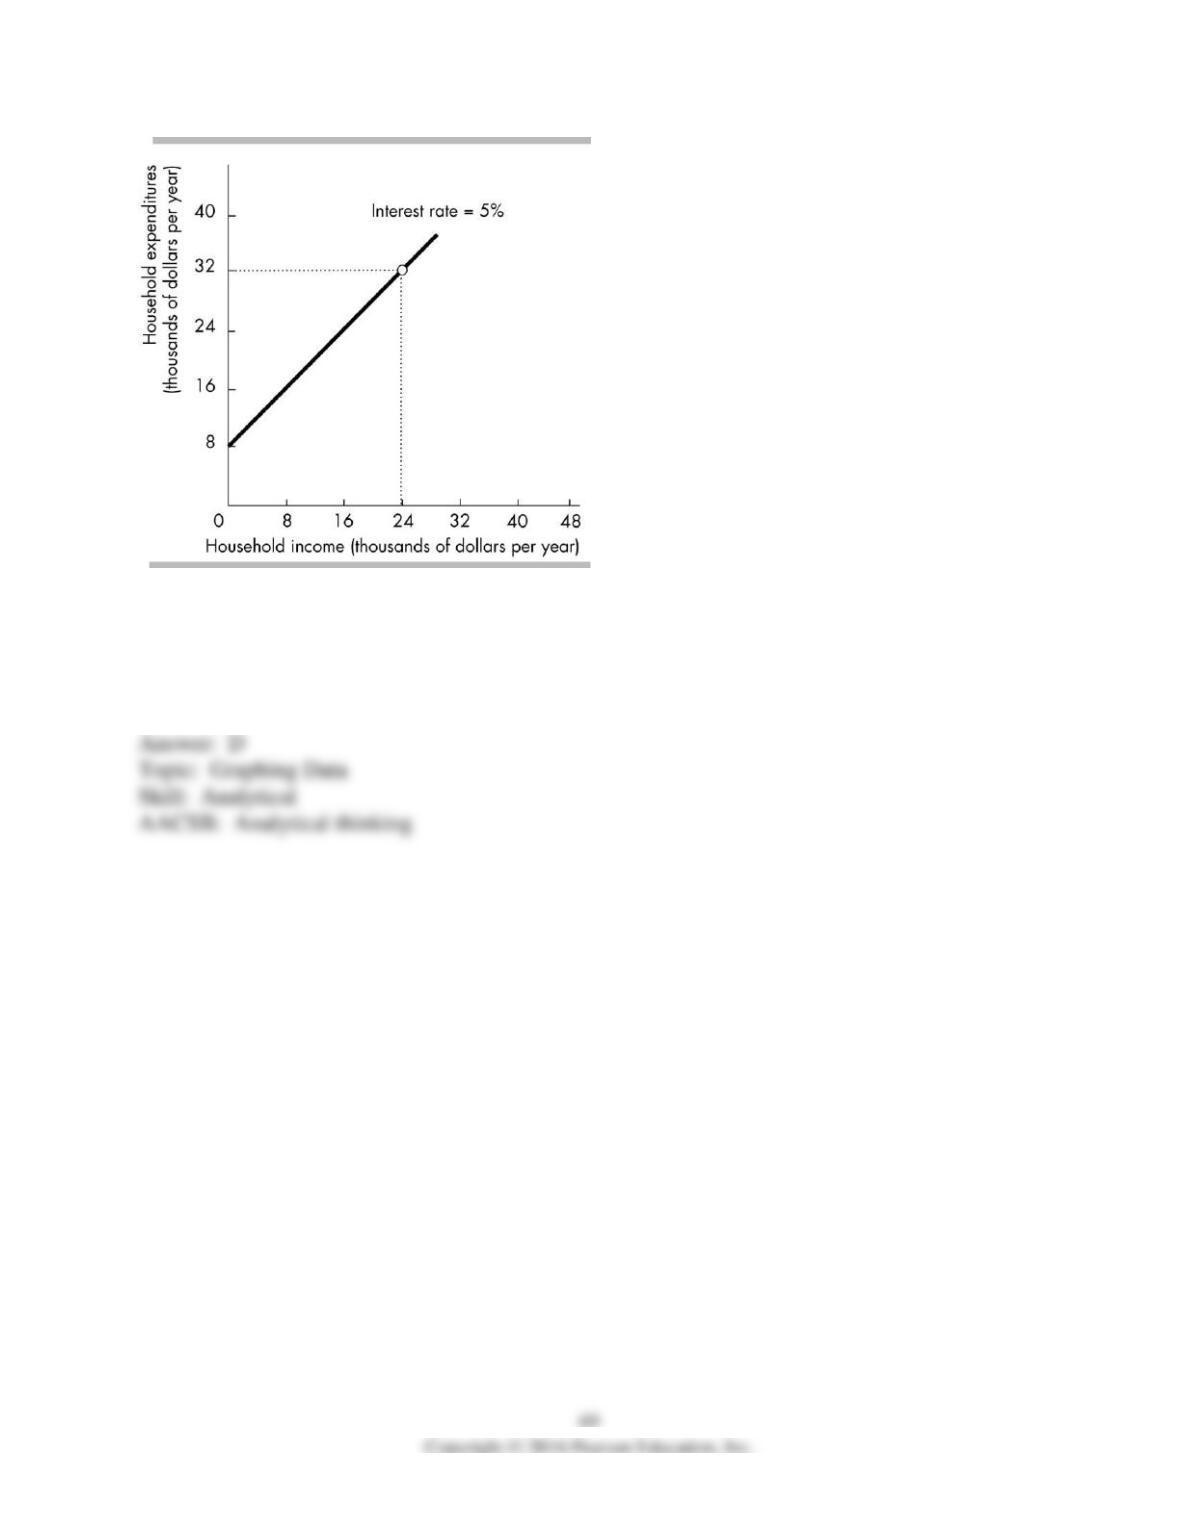
8) In the above figure, when income is zero, household expenditures equal
A) 0.
B) $1000.
C) $4000.
D) $8000.
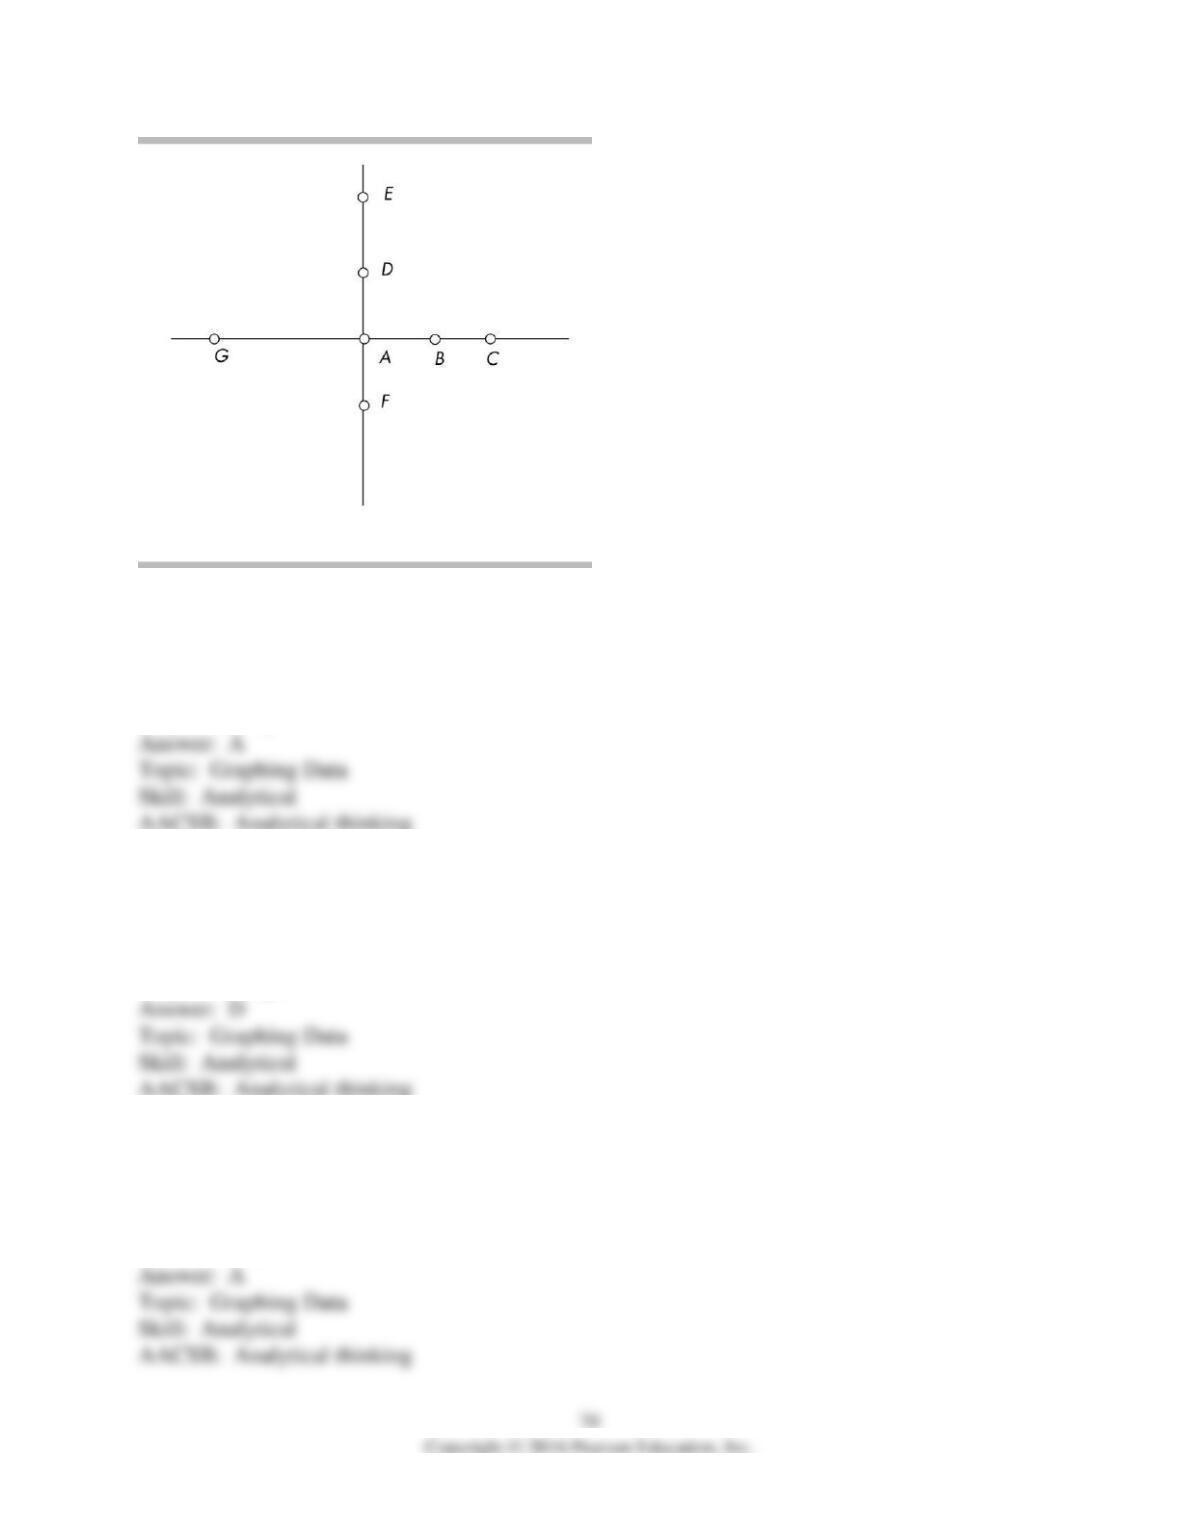
9) In the figure above, the value on the x-axis increases as we move from
A) point G to point A.
B) point C to point A.
C) point F to point A.
D) point E to point A.
10) In the figure above, the value on the y-axis decreases as we move from
A) point G to point A.
B) point C to point A.
C) point F to point A.
D) point E to point A.
11) In the figure above, point B is ________.
A) on the x-axis
B) on the y-axis
C) at the origin
D) a coordinate
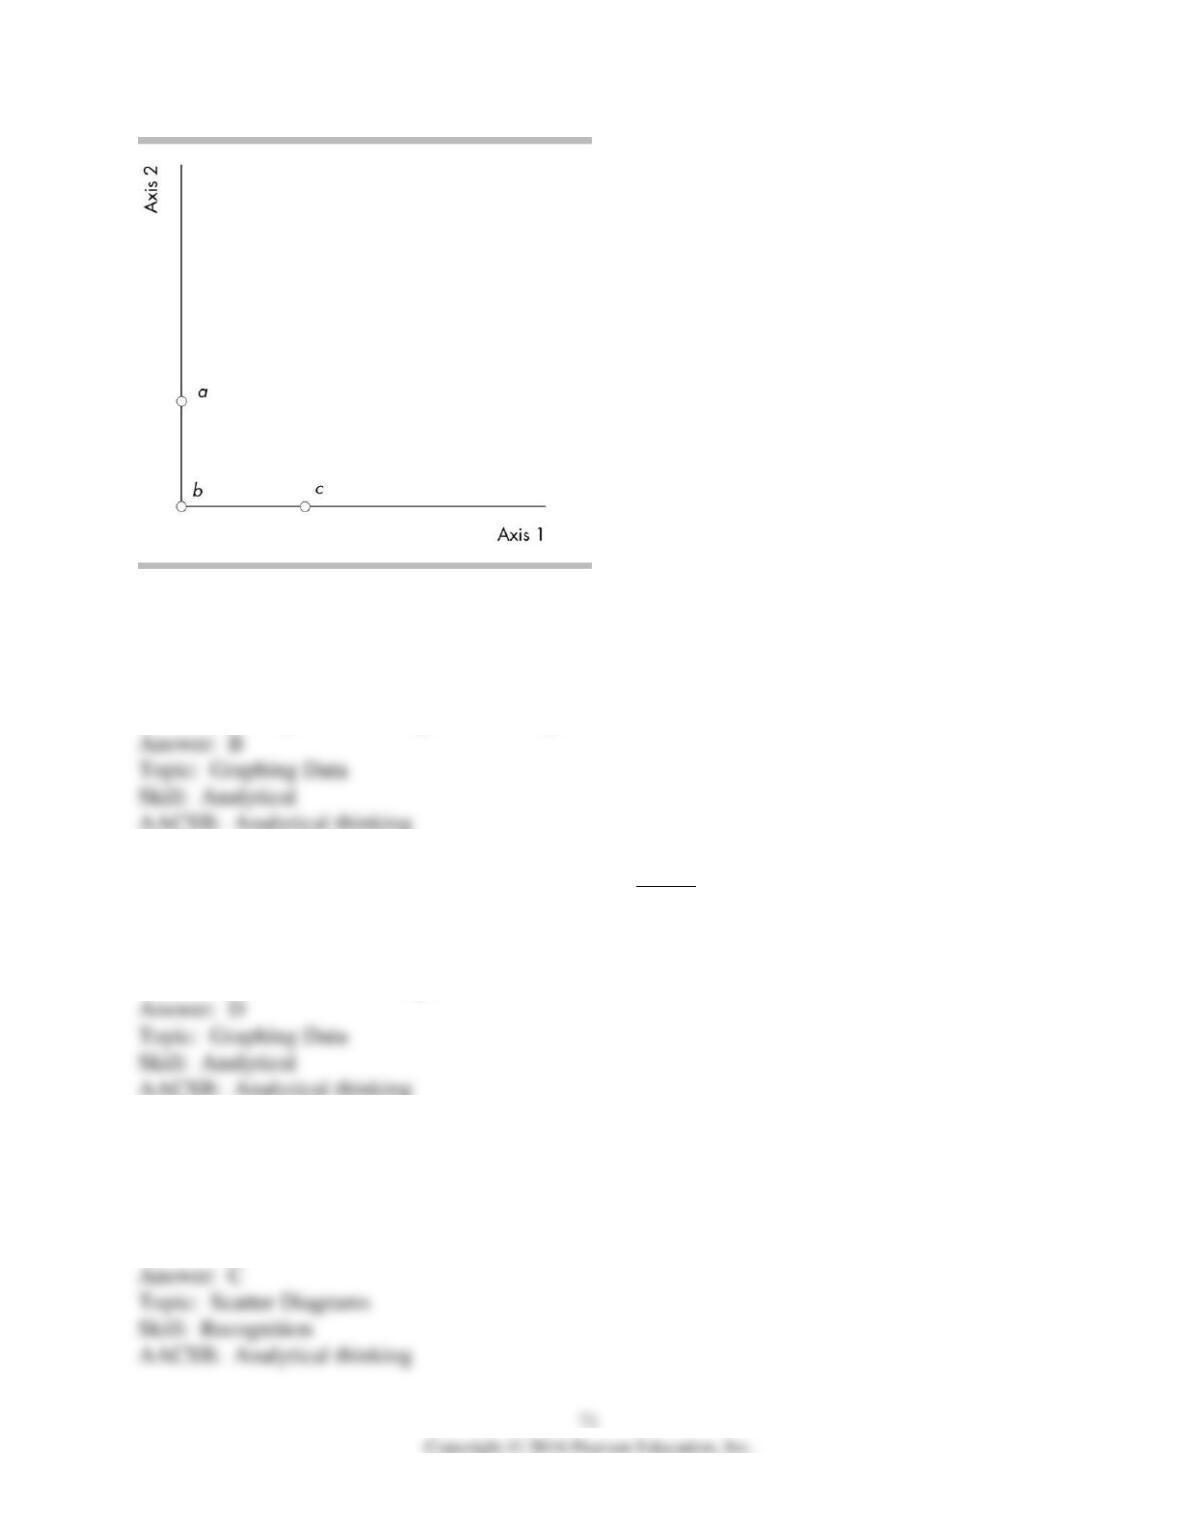
12) Using the above figure, the origin is at which point?
A) point a
B) point b
C) point c
D) None of the points in the figure is the origin.
13) Using the above figure, which of the following is TRUE?
A) Axis 1 is typically called the y-axis.
B) Axis 1 is also known as the origin.
C) Axis 2 is typically called the x-axis.
D) Point b is known as the origin.
14) A scatter diagram shows the
A) level of one variable over time.
B) change in one variable over time.
C) relationship between two variables.
D) evolution of a variable.
15) A scatter diagram will be most useful
A) in discerning a possible relationship between height and weight for individuals.
B) in resolving a dispute over two normative assertions.
C) in predicting next year’s rate of unemployment.
D) All of the above are correct.
16) You notice that when interest rates increases, new residential housing prices tend to decrease.
This observation indicates that
A) there must be false causality between interest rates and housing prices.
B) higher interest rates must cause low housing prices.
C) a scatter diagram between interest rates and housing prices will show a negative relationship.
D) a scatter diagram between interest rates and housing prices will show a direct relationship.
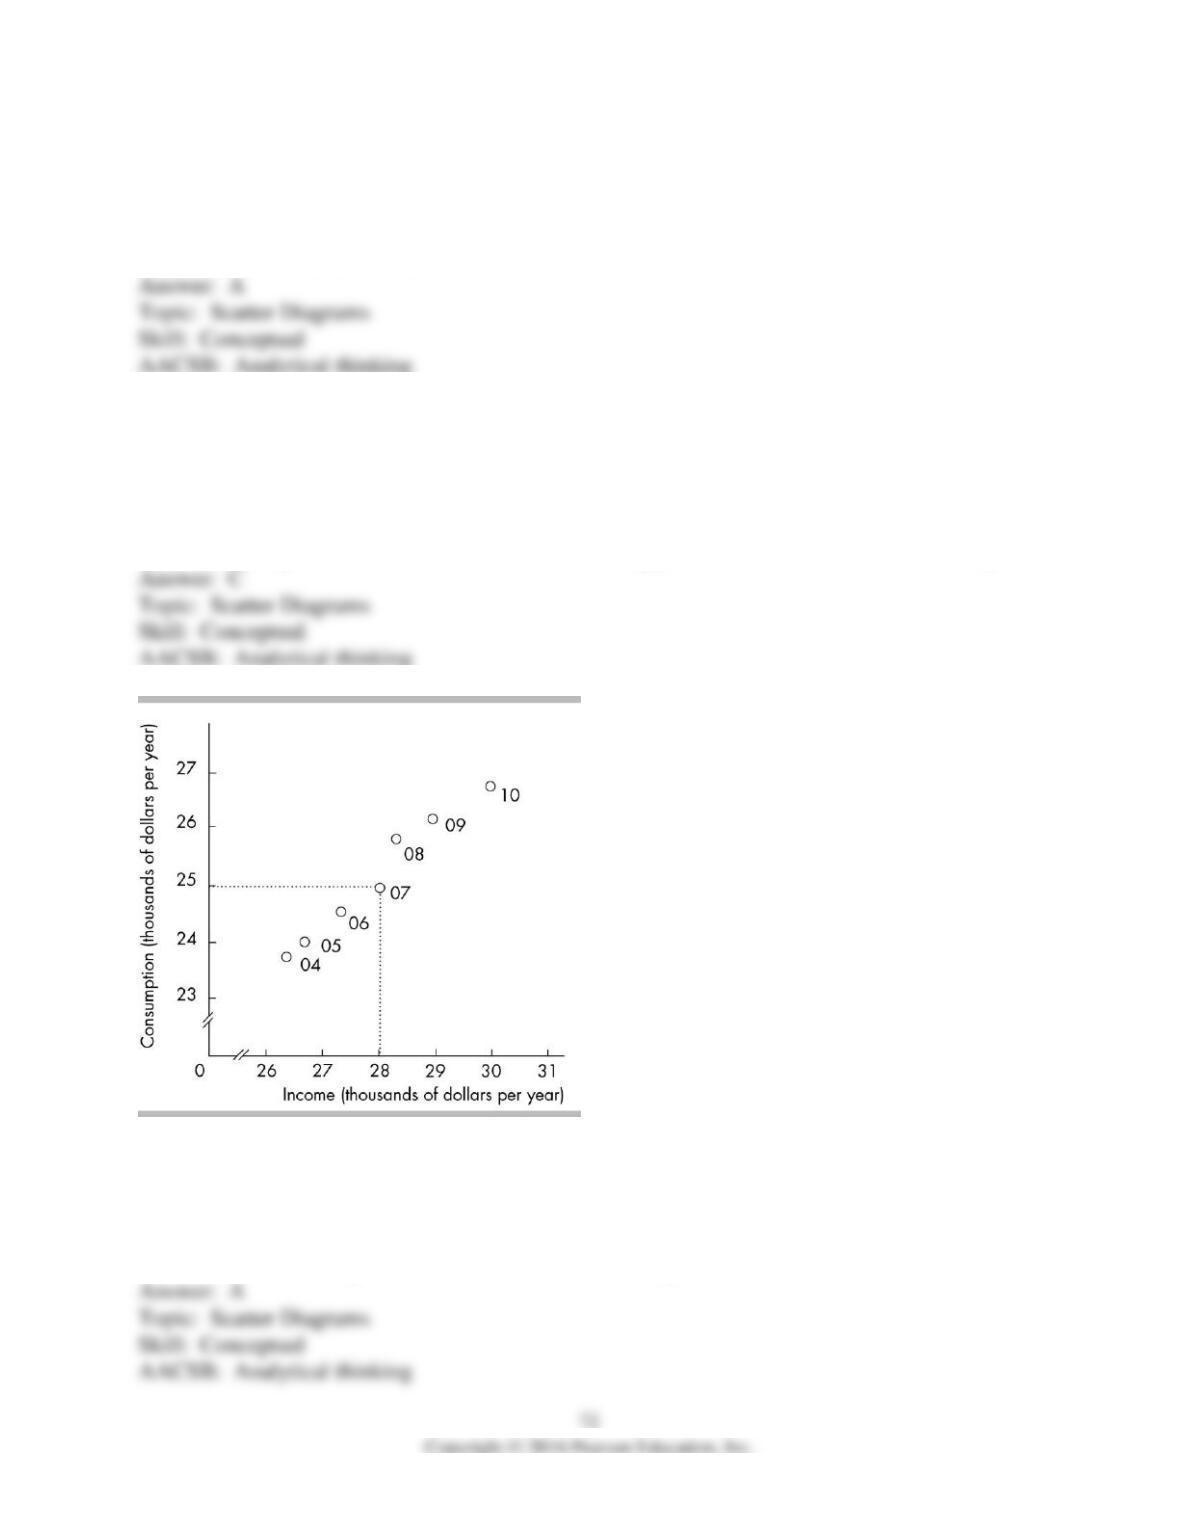
17) The above figure plots income and consumption in a nation. In 2007
A) consumption was equal to $25,000 and income was equal to $28,000.
B) consumption was equal to $28,000 and income was equal to $25,000.
C) consumption was equal to $25,000 and income was equal to $25,000.
D) consumption was equal to $27,000 and income was equal to $31,000.
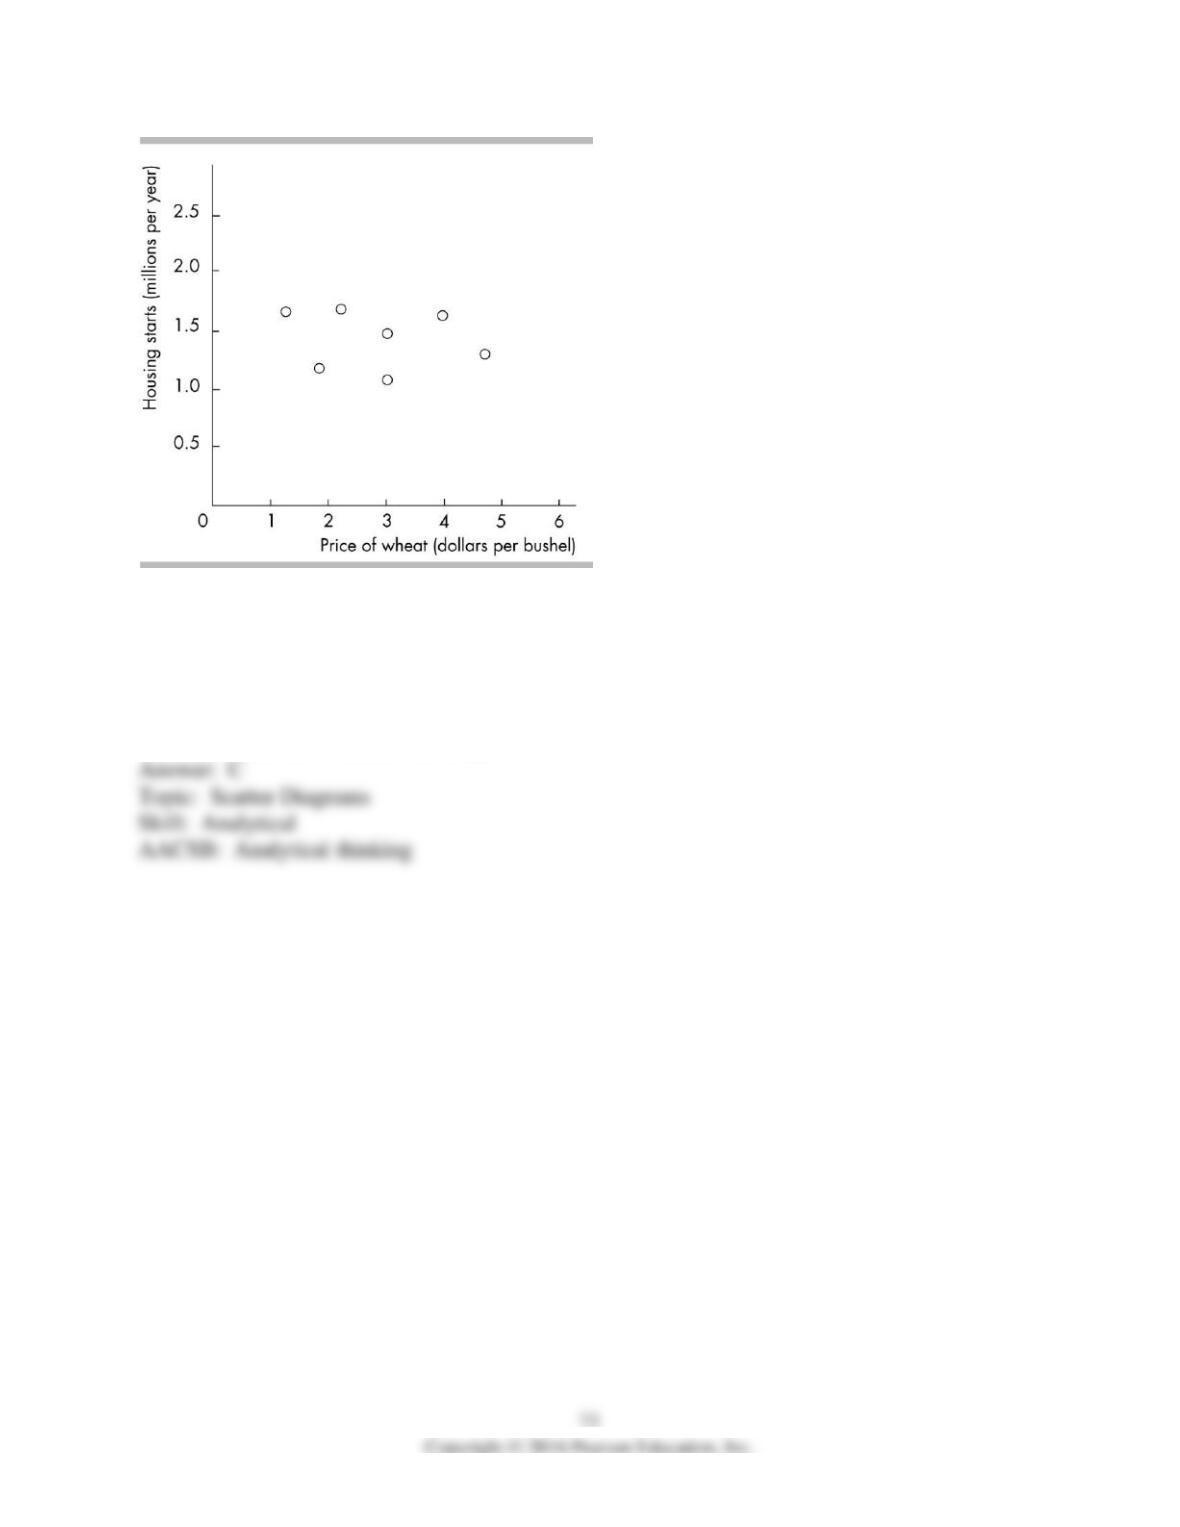
18) The above figure graphs the price of a bushel of wheat and housing starts. The graph shows
the variables are
A) strongly positively related.
B) strongly negatively related.
C) not related.
D) related via an indirect relationship.
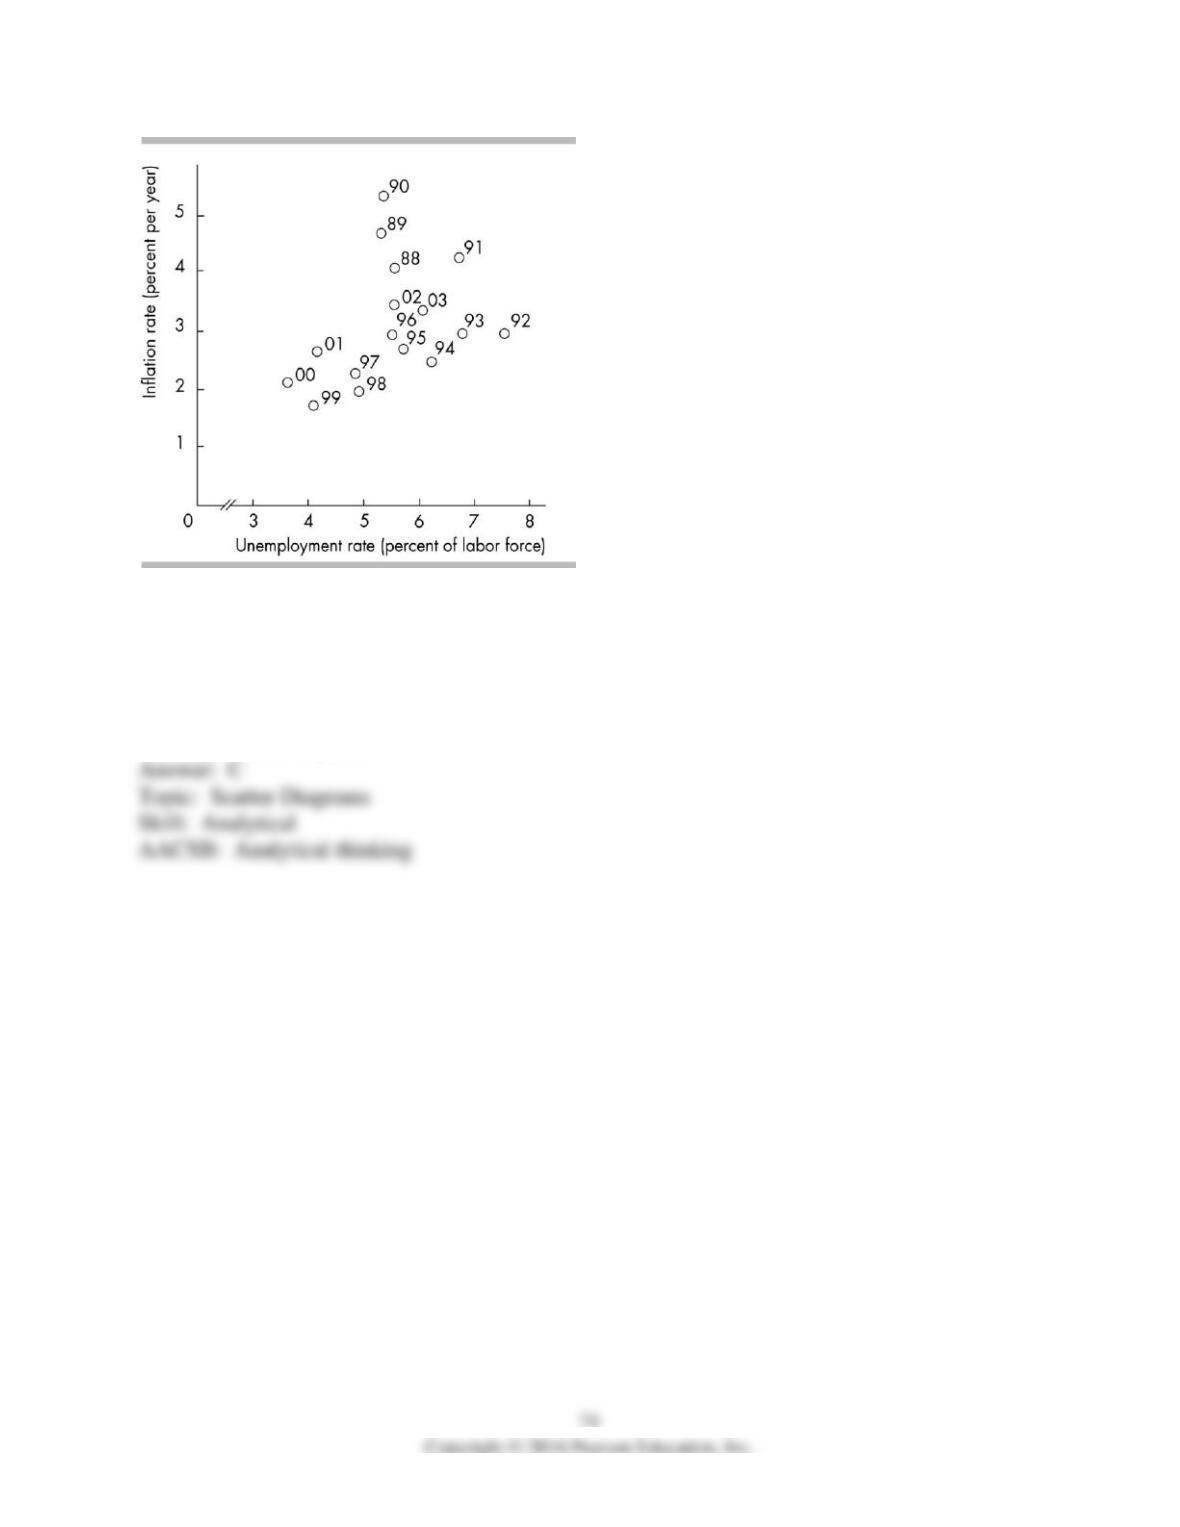
19) The figure above shows that in 1996, unemployment was equal to about ________ and the
inflation rate was equal to about ________.
A) 7.0 percent; 3.0 percent
B) 3.0 percent; 5.5 percent
C) 5.5 percent; 3.0 percent
D) 6.0 percent; 4.0 percent
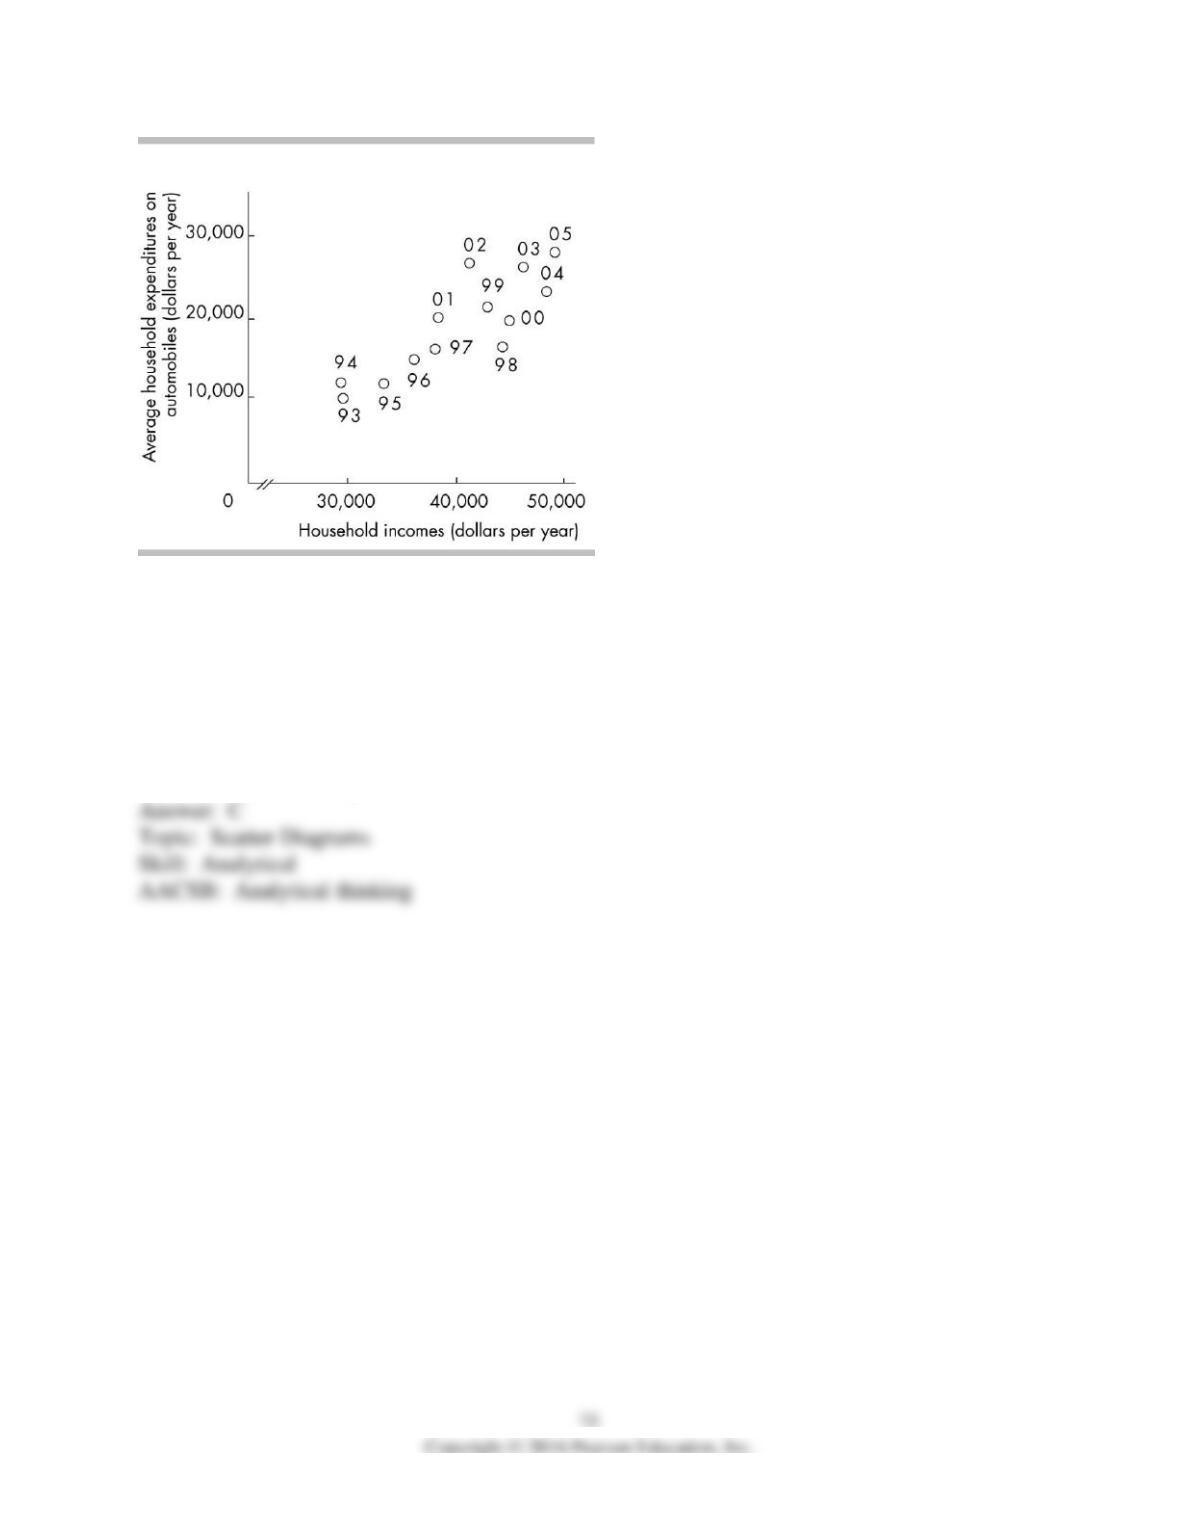
20) The above figure reveals
A) no relationship between household income and average household expenditure on
automobiles.
B) that as household income increases the average household expenditure on automobiles
decreases.
C) that as household income increases the average household expenditure on automobiles
increases.
D) all of the above are possible.
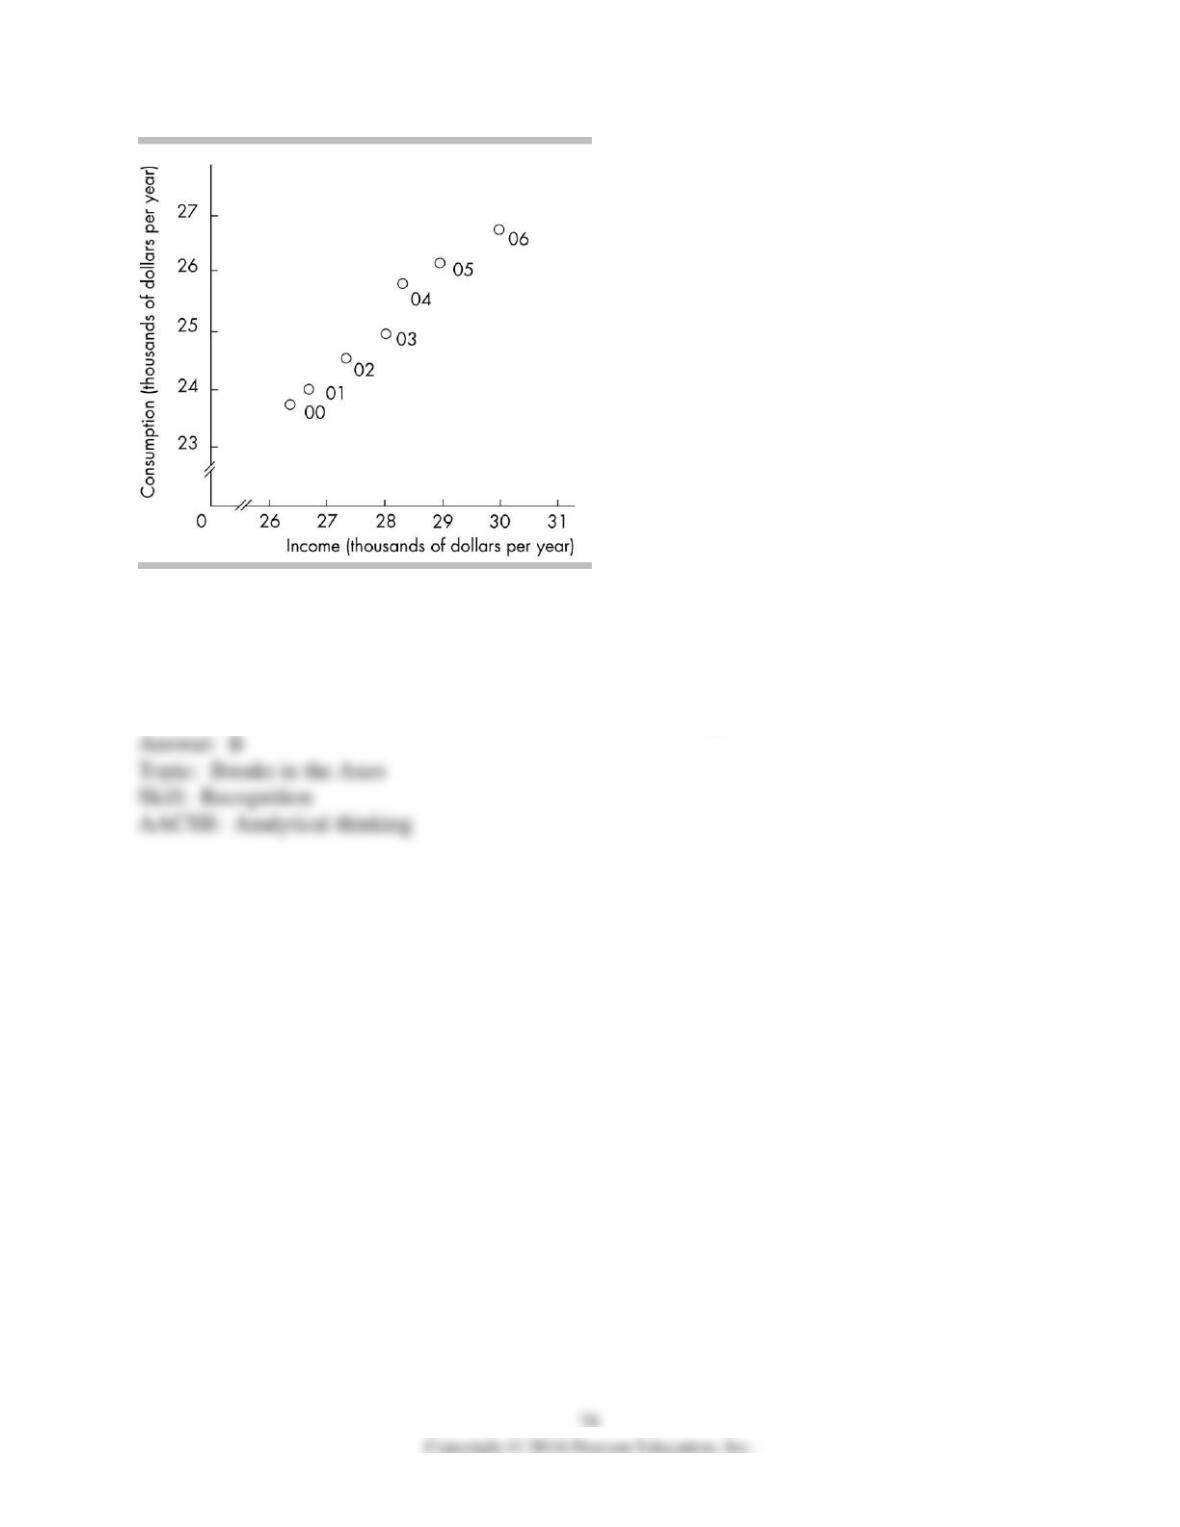
21) In the above figure, the axis breaks are used
A) to create a misleading graph.
B) to indicate that there are jumps from the origin, 0, to the first values recorded along the axes.
C) to indicate that there are not enough data to be included in the graph.
D) to show that there are no data available for the omitted ranges.
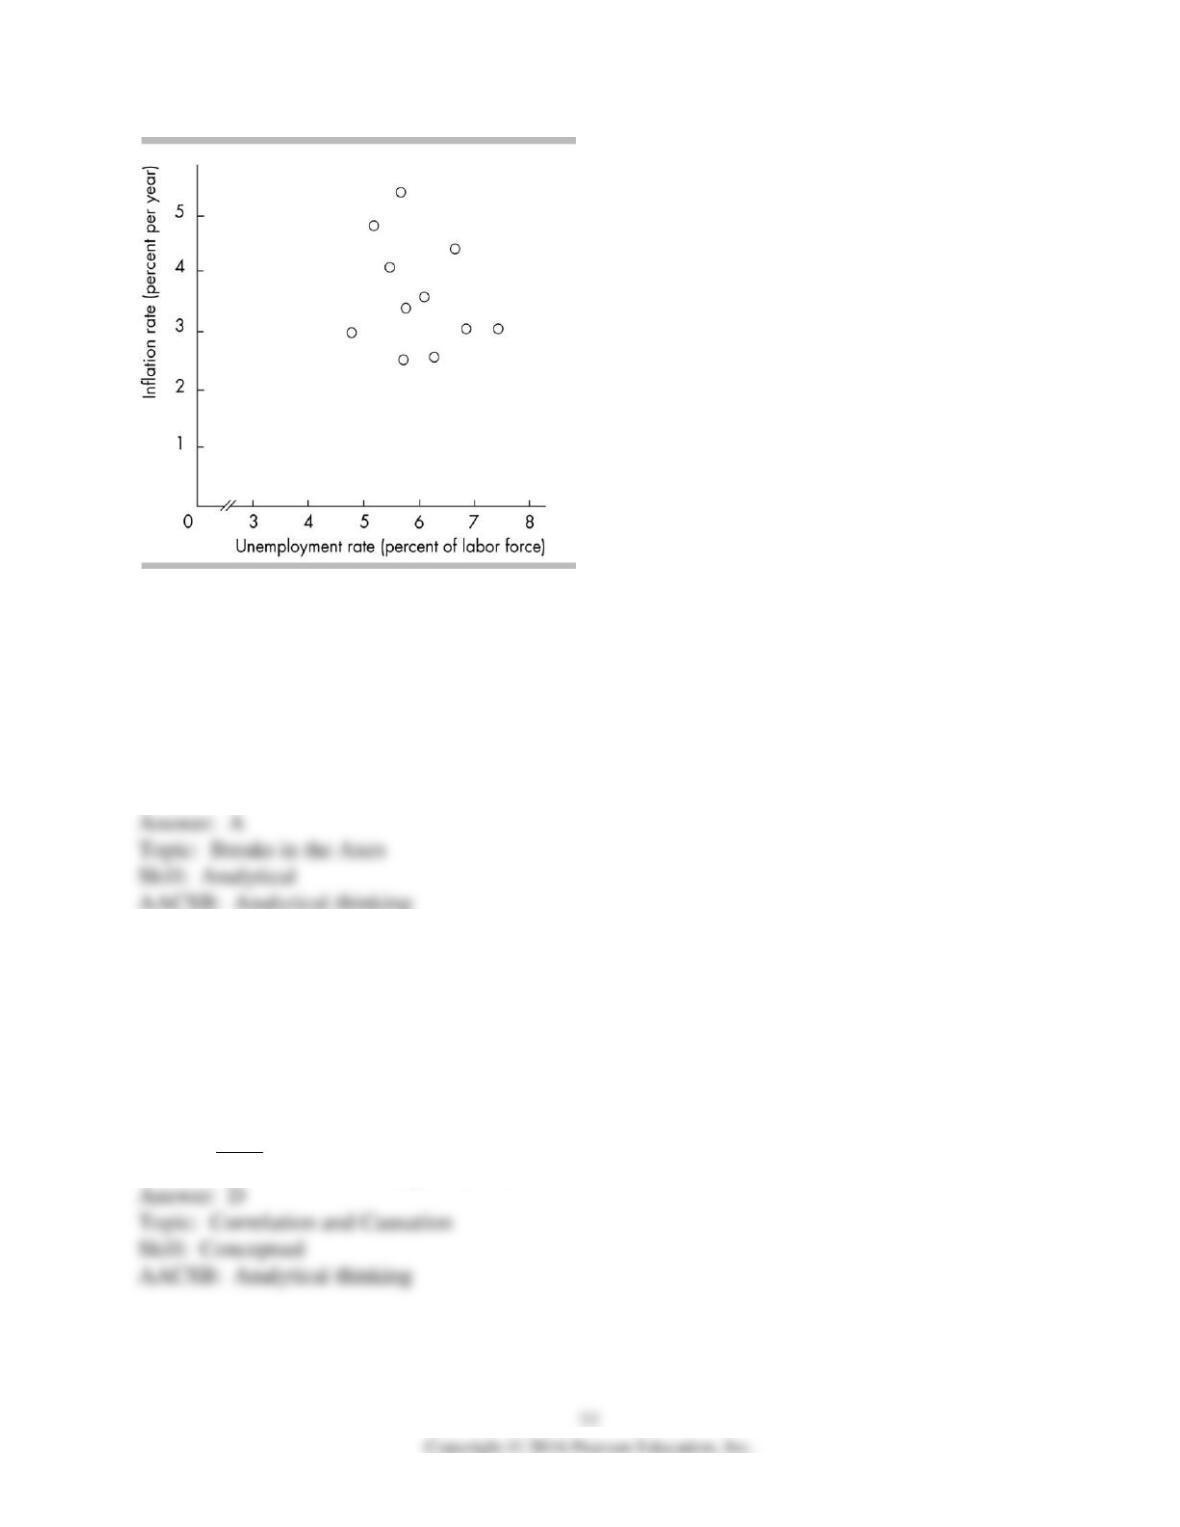
22) In the above figure, the axis break in the x-axis
A) reflects the fact that for the years covered in the figure, the unemployment rate was never less
than 3 percent.
B) shows that there is no relationship between inflation and unemployment.
C) misleadingly shows that inflation has changed very little even though the unemployment rate
has increased a great deal.
D) implies that for the years covered in the figure, the inflation rate was always greater than 1
percent.
23) On a graph, high correlation between the variable measured along the x-axis and the variable
measured along the y-axis
A) means that changes in the variable measured along the x-axis must cause changes in the
variable measured along the y-axis.
B) means that changes in the variable measured along the y-axis must cause changes in the
variable measured along the x-axis.
C) means that changes in either variable must cause changes in the other variable.
D) does NOT mean that a change in the variable measured along the x-axis must cause a change
in the variable measured along the y-axis.
24) You notice that when the inflation rate increases, the interest rate tends to increase. This
observation indicates that
A) there might be false causality between inflation and the interest rate.
B) higher inflation rates must cause a higher interest rate.
C) a scatter diagram of the inflation rate and the interest rate will show a positive relationship.
D) the variables have an inverse relationship.
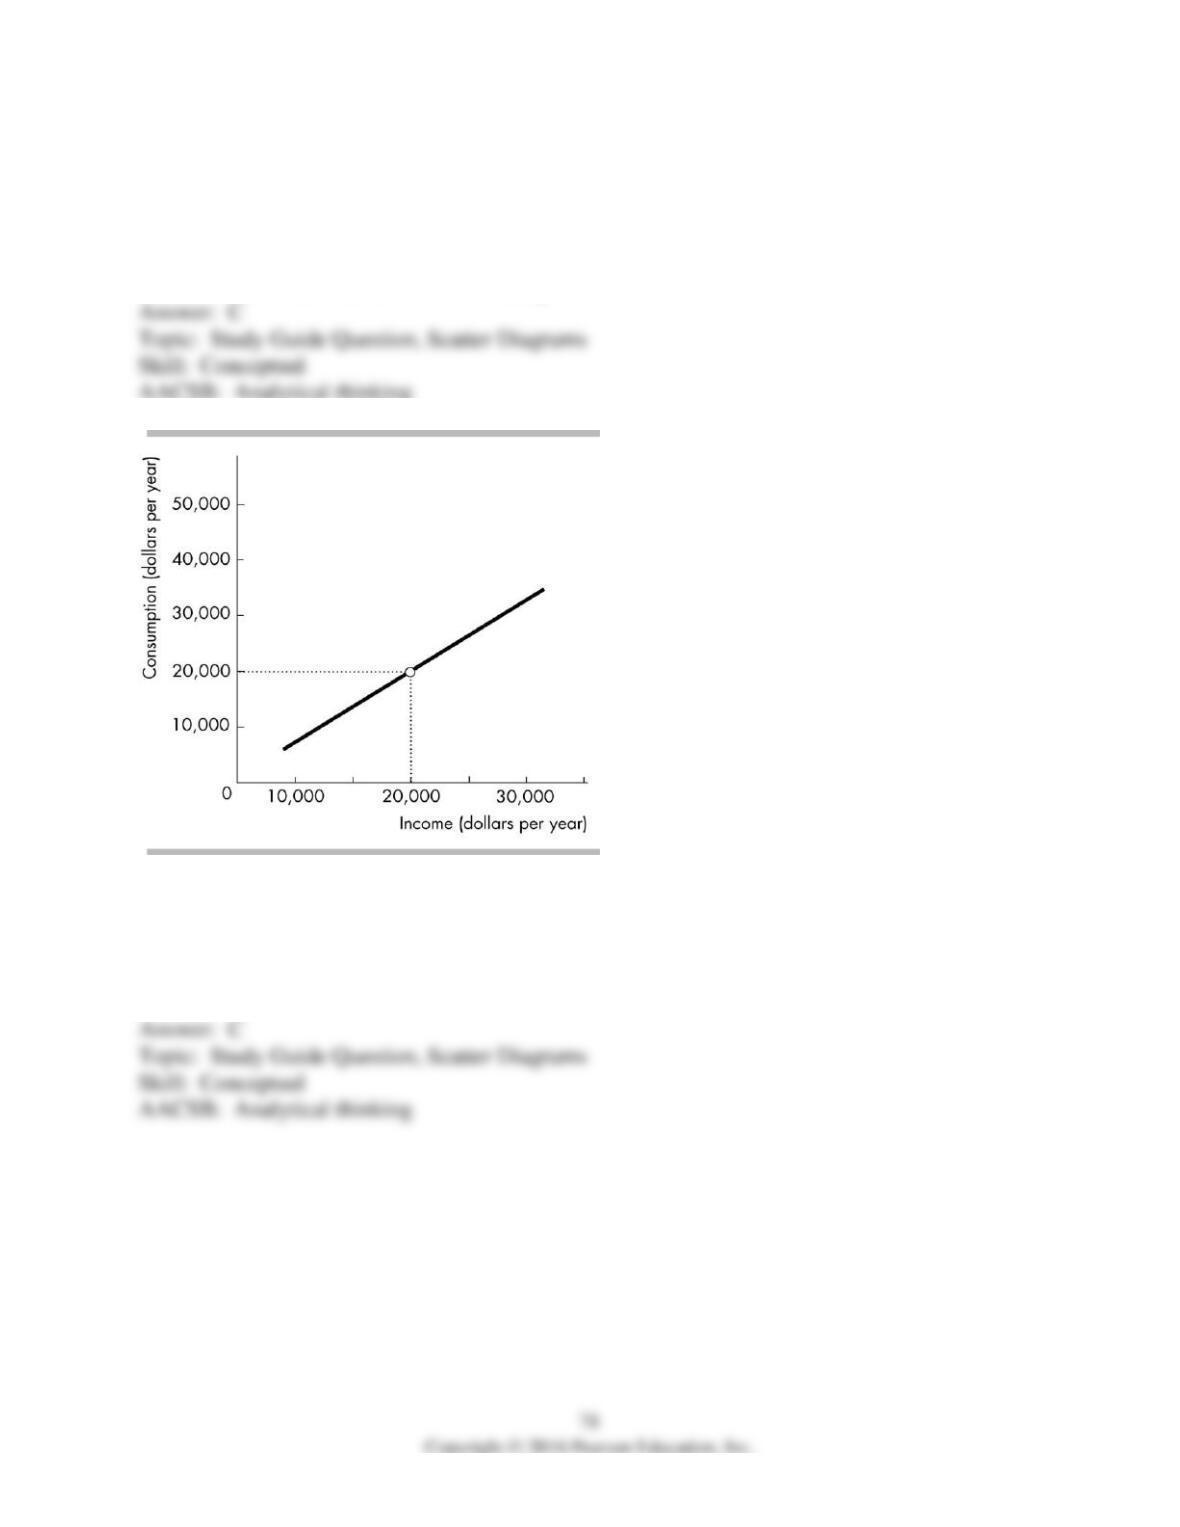
25) In the figure above, when income equals $20,000, what does consumption equal?
A) $0
B) $10,000
C) $20,000
D) impossible to tell
11 Appendix: Graphs Used in Economic Models
1) If two variables are positively related, then
A) they move in opposite directions.
B) they are independent of each other.
C) they move in the same direction.
D) their graph will have a negative slope.
2) If two variables both increase at the same time or decrease at the same time, they are
A) unrelated to each other.
B) positively related.
C) negatively related.
D) conversely related.
3) If there is a direct relationship between two variables
A) the graph of the relationship will be upward-sloping.
B) the graph of the relationship will be downward-sloping.
C) the slope of the line (or the slope of a tangent line to the curve) will be negative.
D) Both answers A and C are correct.
4) The variable measured on the y-axis increases whenever the variable measured on the x-axis
increases. As a result, the relationship between the variables will
A) be negatively sloped.
B) have a slope of zero.
C) be a vertical line.
D) be none of the above.
5) A positive relationship exists between two variables if
A) one variable has “positively” no effect on the other variable.
B) a reduction in one variable is associated with an increase in the other variable.
C) a reduction in one variable is associated with a decrease in the other variable.
D) both variables are inflation-distorted.
6) If the slope of a line that graphs the relationship between variable x and variable y is positive,
then we know that
A) when the value of variable x increases, then the value of variable y decreases.
B) when the value of variable x decreases, then the value of variable y decreases.
C) the two variables are unrelated.
D) the two variables have an inverse relationship.
7) For the Jones household it has been estimated that for every ten degrees increase in the
outdoor temperature the consumption of ice tea increases by 5 glasses. What type of relationship
exists between temperature change and the consumption of ice tea?
A) negative relationship
B) positive relationship
C) no relationship
D) maximum relationship