11) The production possibilities curve slopes downward because
A) some resources are better suited to the production of one product than another.
B) economic resources are limited.
C) economic wants are unlimited.
D) All of the above
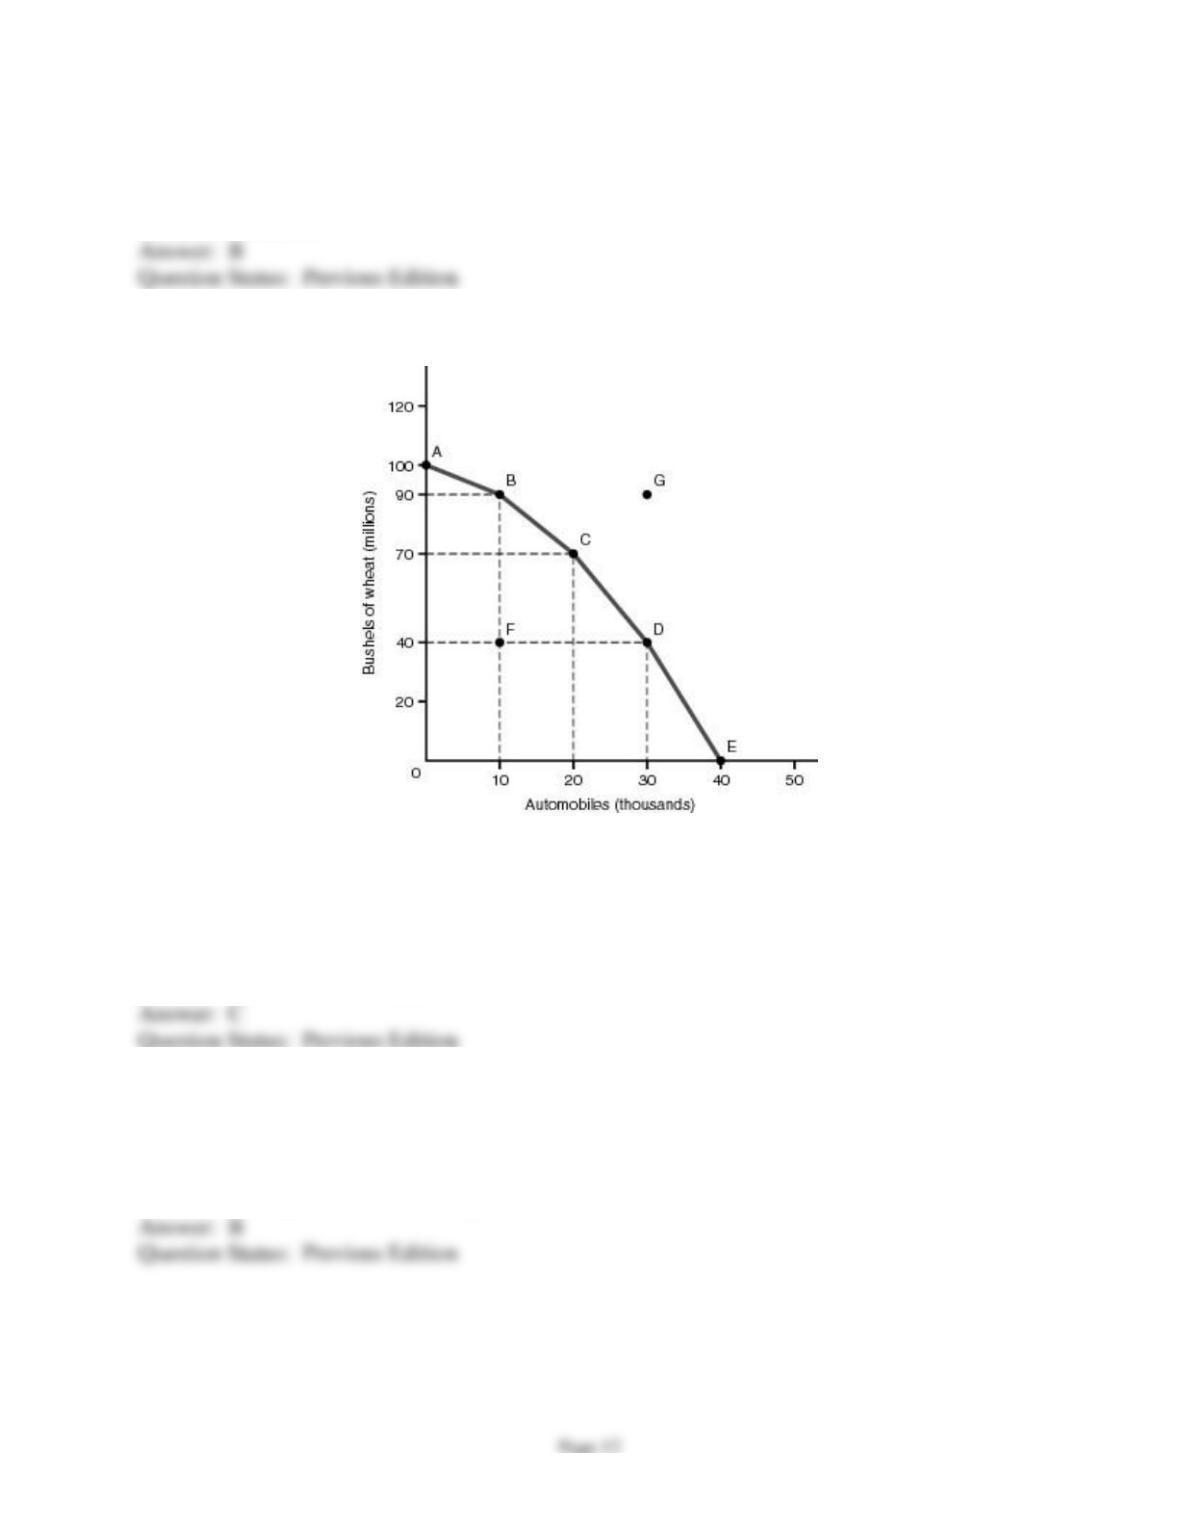
Use the production possibilities curve represented below in answering the following question(s).
12) Based on the figure above, if the economy is operating at point C, the opportunity cost of
producing an additional 10,000 automobiles will be
A) 10 million bushels of wheat.
B) 20 million bushels of wheat.
C) 30 million bushels of wheat.
D) 40 million bushels of wheat.
13) Based on the figure above, point G on the diagram represents
A) an optimal use of the society’s resources.
B) a combination of outputs beyond the economy’s productive capacity.
C) a situation in which some of the economy’s resources are unemployed.
D) the same output combination as point B.

14) Based on the figure above, the production possibilities curve might shift outward to include
G if
A) the economy put all unemployed resources to work.
B) the economy experienced more rapid price inflation.
C) improved training increased the productivity of workers.
D) the nation’s population declined.
15) Foreign trade permits an economy to
A) eliminate the problem of scarcity.
B) operate inside its production possibilities curve.
C) shift its production possibilities curve outward.
D) consume a combination of products beyond its own production possibilities.
Multiple Choice Reproduced from the Companion Web Site
1) Economics is the study of how to
A) discover more economic resources.
B) satisfy all of society’s wants.
C) divide-up the economy’s output fairly.
D) satisfy our society’s wants as fully as possible.
2) Which of the following is not an economic resource?
A) money
B) labor
C) land
D) entrepreneurship
3) When economists say that “there is no free lunch,” they mean that
A) poor decisions always have costs.
B) everything we buy costs us money.
C) the costs of a decision sometimes outweigh the benefits.
D) all of our choices entail sacrifices.

4) If something has an opportunity cost, we should
A) avoid that action.
B) take that action
C) be sure that the benefit of the action exceeds the cost.
D) be sure that the cost of the action exceeds the benefit
5) An economy’s production possibilities curve is downward sloping because
A) a society’s wants are unlimited.
B) an economy’s resources are limited.
C) resources are generally better-suited to the production of one product than another.
D) B and C
6) An economy’s production possibilities curve is curved (concave to the origin) because
A) a society’s wants are unlimited.
B) an economy’s resources are limited.
C) resources are generally better-suited to the production of one product than another.
D) B and C
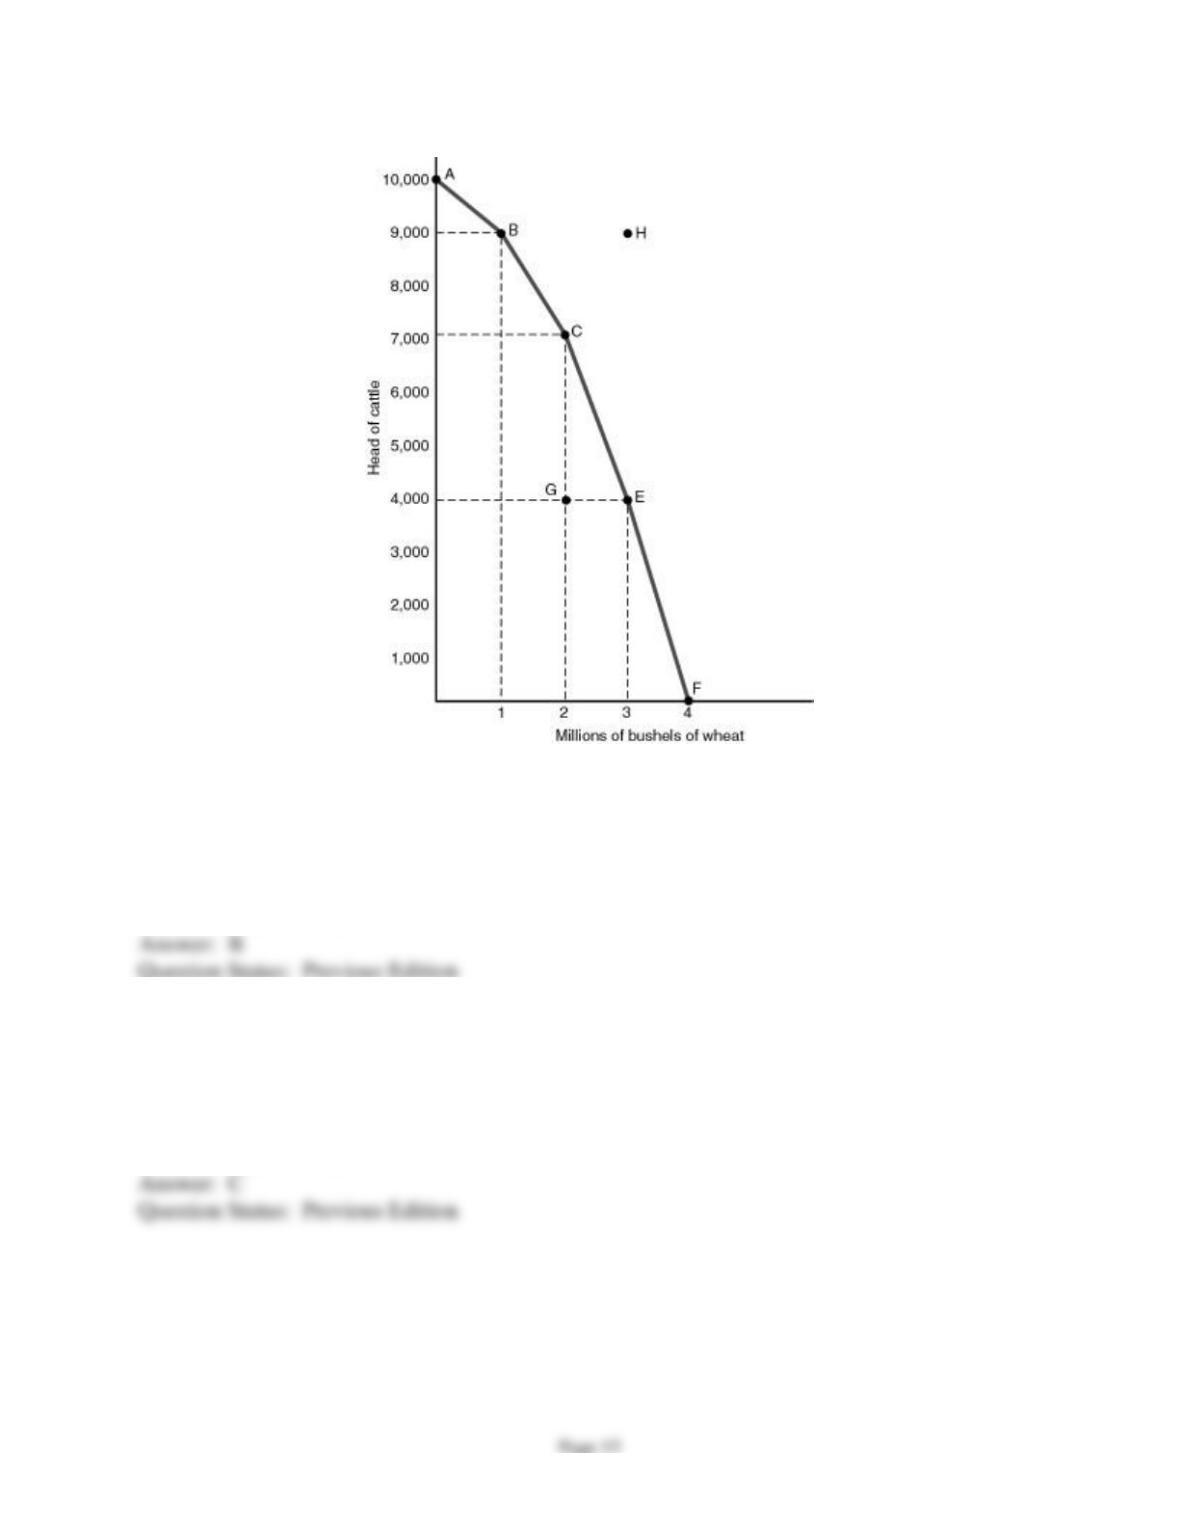
Use the production possibilities curve found below in answering the following question(s).
7) Based on the figure above, if the economy is operating at point B, the opportunity cost of
producing another one million bushels of wheat is
A) 1,000 head of cattle.
B) 2,000 head of cattle.
C) 3,000 head of cattle.
D) 4,000 head of cattle.
8) Based on the figure above, if the economy is operating at point C, the opportunity cost of
producing another million bushels of wheat is
A) 1,000 head of cattle.
B) 2,000 head of cattle.
C) 3,000 head of cattle.
D) 4,000 head of cattle.

9) Based on the figure above, which of the following is not a true statement about the production
possibilities diagram found above?
A) If the economy is operating at point G, it is not fully utilizing its resources.
B) The economy’s production possibilities curve is downward sloping because its resources are
limited.
C) This curve illustrates the law of increasing costs.
D) Society would prefer point C to point H.
10) If an economy’s production possibilities curve were a downward-sloping straight line, this
would indicate that
A) the economy had unlimited economic resources.
B) the society had limited wants.
C) resources were equally well suited to producing both products.
D) production was subject to the law of increasing costs.
11) Economic growth is represented by
A) moving from a point inside an economy’s production possibilities curve to a point on the
curve.
B) shifting an economy’s production possibilities curve outward.
C) moving from a point on an economy’s production possibilities curve to a point outside the
curve.
D) shifting an economy’s production possibilities curve inward.
12) We generally expect students who spend more time studying economics to earn higher
grades, ceteris paribus. In this context, ceteris paribus means
A) assuming they have equal abilities.
B) assuming they have equally demanding professors.
C) assuming they all have access to the same study materials.
D) All of the above.
13) The decision to use scarce resources to combat aids rather than to improve the quality of
elementary education is an example of
A) an economic theory.
B) a normative judgment.
C) the law of increasing costs.
D) the concept of ceteris paribus.

14) Which of the following represent the “three fundamental questions” of economics?
A) What to produce, where to produce it, and how to distribute it.
B) What to produce, where to produce it, and who will receive it.
C) What to produce, how to produce it, and how to distribute it.
D) What to produce, how to market it, and how to distribute it.
15) Economic efficiency has two separate elements. Those elements are
A) producing the products that consumers desire the most and producing each of those products
with as few scarce resources as possible.
B) fully employing all economic resources and using those resources to produce the goods and
services that consumers desire the most.
C) producing as much output as possible and ensuring that the resulting output is distributed
fairly.
D) producing as much output as possible while maintaining a stable price level.
16) Which of the following involves a macroeconomic event?
A) The price of wheat increases dramatically.
B) The unemployment rate rises.
C) Higher gas prices cause Joan to sell her SUV.
D) Improved technology lowers the price of personal computers.
17) Which of the following is an example of “capital” as economists use the term?
A) money
B) stocks and bonds
C) natural resources such as coal deposits
D) tools and machinery
18) “Producing more of one thing means producing less of something else.” This statement
illustrates
A) the law of increasing costs.
B) the concept of ceteris paribus.
C) a normative statement.
D) opportunity cost.

19) Imagine a production possibilities curve with agricultural products measured on one axis and
manufactured products measured on the other. A massive earthquake, that destroyed farms and
factories alike, would
A) shift the production possibilities curve inward.
B) shift the production possibilities curve outward.
C) force the economy to operate at a point inside its production possibilities curve.
D) make the production possibilities curve steeper.
20) You’re a high-school graduate who is contemplating attending college next year. Which of
the following should not be considered a cost of attending college?
A) the cost of meals
B) the income forgone to attend school full time
C) the cost of books
D) tuition and fees
21) Which of the following is least consistent with the cost-benefit model?
A) A promising college football player who drops out of college to try his luck as a pro.
B) Tiger Woods taking 2 years off from golf to pursue an MBA degree.
C) A harried mother of 12 ordering pizza instead of preparing a home-cooked meal.
D) A low-wage worker arriving before a store opens to have first crack at newly discounted
clothing.
22) Economists sometimes reach different conclusions on a given issue because
A) they disagree about goals
B) they disagree about how the economy works
C) a and b
D) neither a nor b
23) Macroeconomics deals with the study of
A) international trade
B) production possibilities
C) individual economic units
D) the economy’s overall performance
1) The fundamental economic problem is the fact that our wants exceed our capacity for
satisfying those wants.

2) Economics is the study of how to distribute an economy’s output in a fair manner.
3) Economics is the study of how to completely satisfy our wants.
4) Economics is the study of how to use our limited resources to satisfy as many of our unlimited
wants as possible.
5) The opportunity cost of an action is the most valued alternative you give up to take that action.
6) The statement that there is no “free lunch” means that every decision has an opportunity cost.
7) If someone gives you $20, there is no opportunity cost to spending that money.
8) Economists use the term “land” to refer to all production inputs created by nature.
9) Economists use the term “capital” to refer to money.
10) Societies must always operate on their production possibilities curves.
11) If economic resources were equally well suited to the production of both products, the
production possibilities curve would be a downward sloping straight line.
12) The production possibilities curve is downward sloping because resources are limited.
13) The production possibilities curve is downward sloping because some resources are better
suited to the production of one product than another.

14) The discovery of more efficient production methods will shift an economy’s production
possibilities curve to the right.
15) An economy cannot operate inside its production possibilities curve.
16) When an economy is operating on its production possibilities curve, additional units of one
product can be obtained only by sacrificing units of the other product.
17) Trade with other nations can enable a country to acquire products at a lower opportunity cost
than they can be produced domestically.
18) Trade with other nations eliminates the problem of scarce resources.
19) Trade with other nations allows a country to consume a combination of products beyond its
own production capabilities.
20) In deciding what materials and methods to use in production, a society is answering the
“What to produce” question.
21) Only poor economies must decide “For whom to produce.”
22) Economic theories simplify the real world in order to make it more easily understood.
23) Economic theories are generalizations about causal relationships between variables.
24) Ceteris paribus literally means “in a controlled experiment.”

25) When a prediction proves incorrect and the assumption of ceteris paribus has been violated,
it is clear that the economist’s theory is invalid.
26) Issues involving what “should be” are described as normative issues.
27) When economists describe how the economy works, they are engaging in normative
analysis.
28) Microeconomics is the study of the overall performance of the economy.
29) Microeconomics is the study of the individual units that make up the economy.
30) The only reason that economists ever disagree is because they have different opinions about
which of the society’s economic goals are the most important.
1) The countries of the former Soviet Union are attempting to convert factories that once
produced military goods to the production of civilian products. Why might we expect the output
of civilian products to increase much less than the output of military goods declines?
2) Economists can disagree either because they have different views about what “is” or because
they have different views about what “should be.” Explain these two different types of
disagreement and provide an example of each.
3) Suppose that you are an exceptionally bright student attending your first calculus lecture. The
instructor begins the class by noting that “Students who have completed college algebra tend to
do better in this class than those who have not, ceteris paribus.” If you have not completed
college algebra should you expect to finish near the bottom of the class? Why or why not?
4) Suppose that your uncle sends you $500 as a graduation gift. Is there any opportunity cost
associated with spending this “free” money? Defend your conclusion.

Question Status: Previous Edition
5) Suppose that human wants were limited instead of unlimited. Would there still be a job for
economists? Might some societies need them and not others? Defend your conclusion.