
Chapter 01 – Economics: The Study of Opportunity Cost
Chapter 01 Economics: The Study of Opportunity Cost
Multiple Choice
1) Economics is the study of
A) how much people should buy and the prices they should be willing to pay.
B) how much people should sell and the prices they should be willing to accept.
C) the allocation of the world’s freely available resources and who should get them.
D) the allocation and use of scarce resources to satisfy unlimited human wants.
2) The one word in the definition of economics that focuses on the fact that it is impossible to
provide all of the goods and services that everyone wants is
A) scarcity.
B) resources.
C) study.
D) allocation.
3) The one word in the definition of economics that focuses on the fact that we have to make
choices about who gets what and how much is
A) scarcity.
B) resources.
C) study.
D) allocation.
4) Economists focus on “unlimited human wants” rather than _____ to describe our pursuit of
goods and services.
A) needs
B) prices
C) output
D) physical requirements
5) Scarcity implies that the allocation scheme chosen by society can
A) not make more of any one good.
B) typically make more of a good but at the expense of making less of another.
C) always make more of all goods simultaneously.

Chapter 01 – Economics: The Study of Opportunity Cost
6) Production possibilities frontier models
A) the choices we make in setting prices.
B) the choices we make in setting output alternatives.
C) the choices we make in setting wages.
D) the choices we make in setting incomes.
7) A production possibilities frontier is a simple model of
A) scarcity and allocation.
B) prices and output.
C) production and costs.
D) inputs and outputs.
8) A simplifying assumption is typically made so as to
A) make a point clearer by stripping away excess detail.
B) make a point clearer by adding sufficient detail to get things precise.
C) divert attention from the real problem.
D) make things look better than they really are.
9) Something is scarce as long as
A) there is a price that the market puts on the item.
B) there is no freely available infinite source of the item.
C) the government provides it.
D) the market provides it.
10) A resource
A) must come from the earth.
B) only includes physical things.
C) is anything that we consume directly or use to make things we will ultimately consume.
D) A) and C)

Chapter 01 – Economics: The Study of Opportunity Cost
11) The underlying reason that there are unattainable points on a production possibilities frontier
diagram is that there
A) is government.
B) are always choices that have to be made.
C) is a scarcity of resources within a fixed level of technology.
D) is unemployment of resources.
12) The underlying reason production possibilities frontiers are likely to be bowed out (rather
than linear) is
A) choices have consequences.
B) there is always opportunity costs.
C) some resources and people can be better used producing one good rather than another.
D) there is always some level of unemployment.
13) The optimization assumption suggests that people make
A) irrational decisions.
B) unpredictable decisions.
C) decisions to make themselves as well off as possible.
D) decisions without thinking very hard.
14) The fact that we are operating at a point inside a bowed out production possibilities frontier,
indicates there is
A) scarcity.
B) constant opportunity cost.
C) unemployment.
D) increasing opportunity cost.
15) If the production possibilities frontier is not bowed out but is a line, indicates there is
A) scarcity.
B) constant opportunity cost.
C) unemployment.
D) increasing opportunity cost.

Chapter 01 – Economics: The Study of Opportunity Cost
16) The fact that the production possibilities frontier is bowed out indicates there is
A) scarcity.
B) constant opportunity cost.
C) unemployment.
D) increasing opportunity cost.
17) The fact that we cannot operate at a point outside a production possibilities frontier indicates
there is
A) scarcity.
B) constant opportunity cost.
C) unemployment.
D) increasing opportunity cost.
18) Points on the Production Possibilities Frontier are
A) attainable.
B) unattainable.
C) associated with some unemployment
D) both attainable and unattainable.
19) Points inside the Production Possibilities Frontier are
A) attainable.
B) unattainable.
C) associated with some unemployment.
D) both attainable and unattainable.
20) Points outside the Production Possibilities Frontier are
A) attainable.
B) unattainable.
C) associated with some unemployment.
D) both attainable and unattainable.
Chapter 01 – Economics: The Study of Opportunity Cost
Use the following to answer questions 21-25:
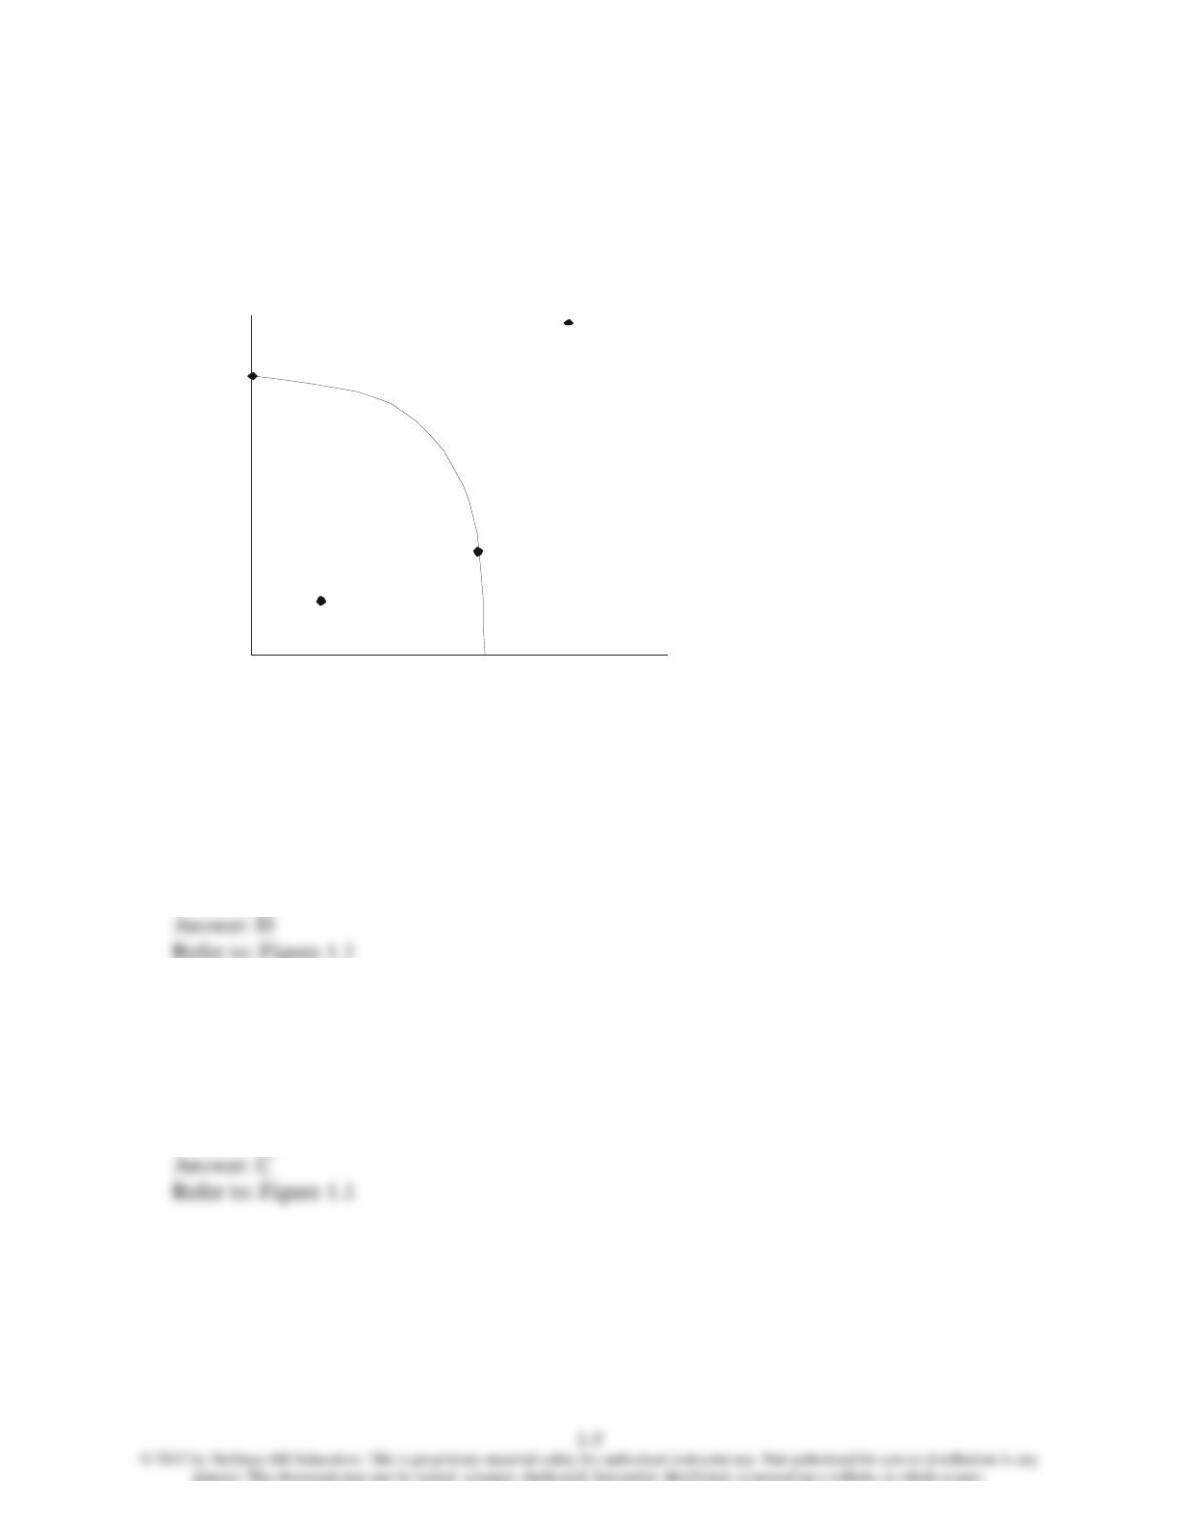
Figure 1.1
21) In Figure 1.1, which labeled points are attainable?
A) only A
B) only B and C
C) only D
D) A, B and C
22) In Figure 1.1, which labeled points are unattainable?
A) only A
B) only B and C
C) only D
D) A, B and C
Soda
Pizza
B
Production Possibilities Frontier
A
C
D
Chapter 01 – Economics: The Study of Opportunity Cost
23) In Figure 1.1, which labeled points represent the existence of unemployment?
A) only A
B) only B and C
C) only D
D) A, B and C
24) In Figure 1.1, which labeled point indicates that there are sufficient resources and technology
to produce the combination of goods represented by that point?
A) only A
B) only B and C
C) only D
D) A, B and C
25) In Figure 1.1, which labeled point indicates that there are insufficient resources or technology
to produce the combination of goods represented by that point?
A) only A
B) only B and C
C) only D
D) A, B and C
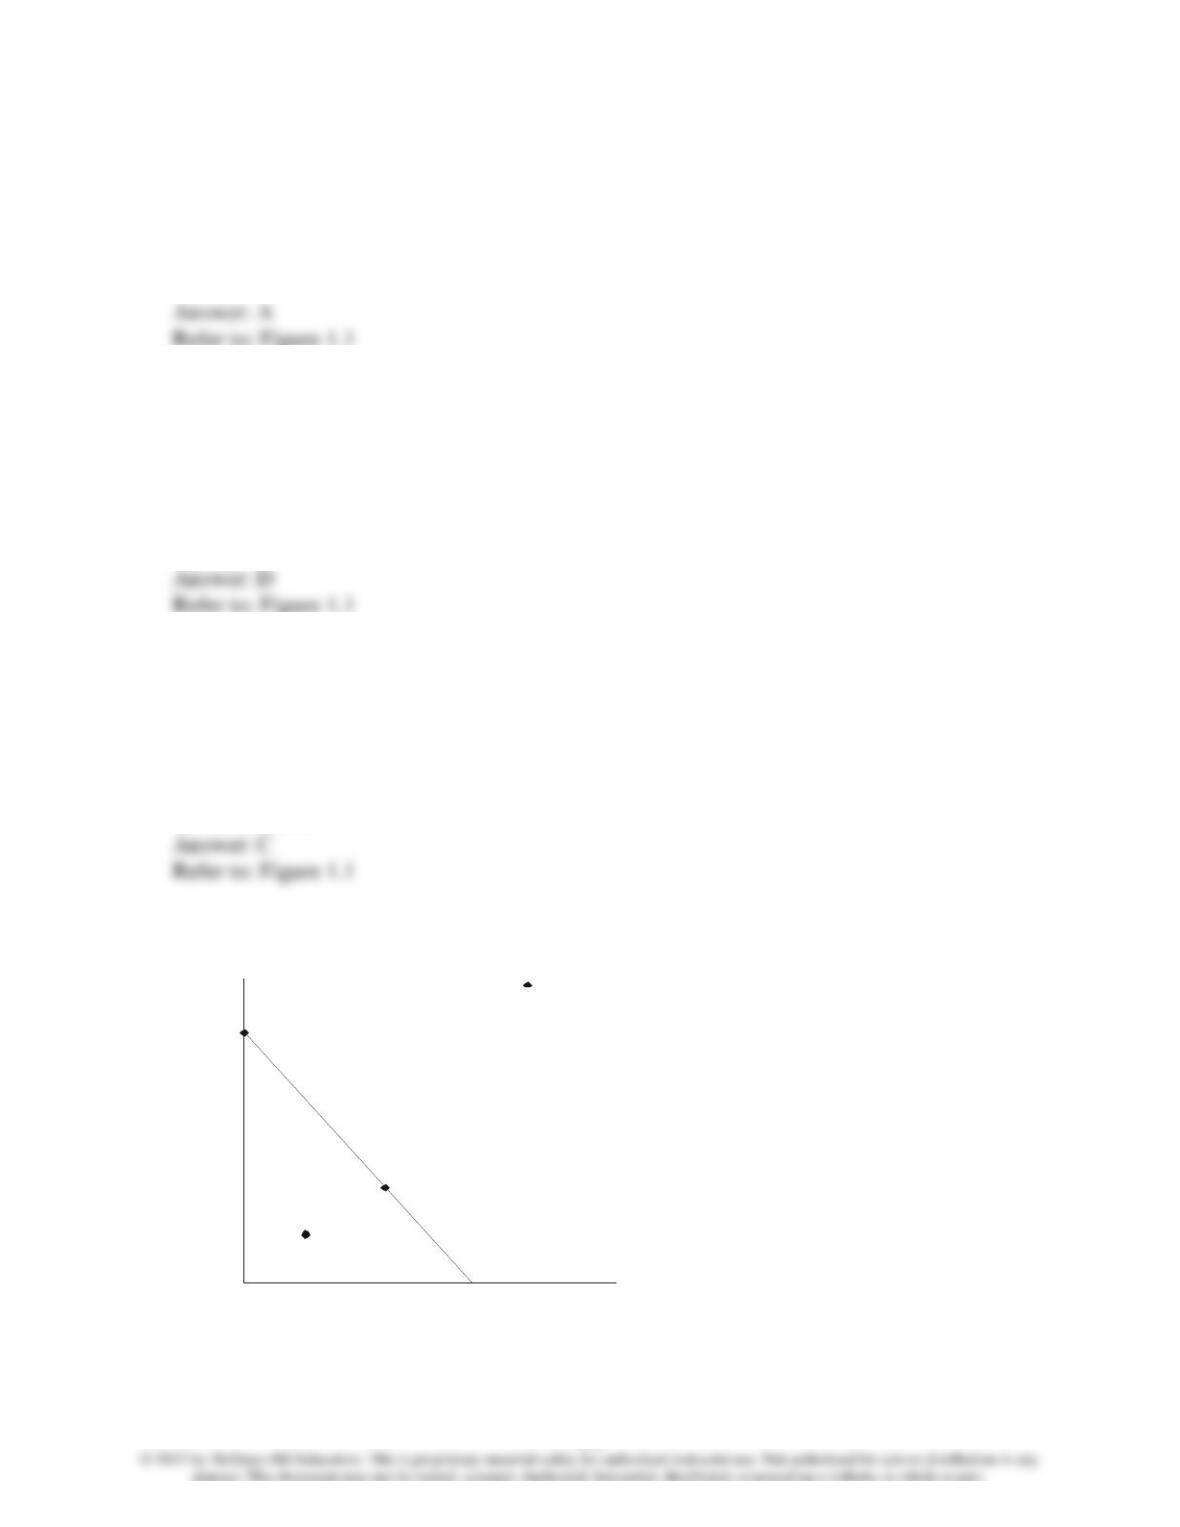
Use the following to answer questions 26-30:
Soda
Pizza
B
Production Possibilities
Frontier
A
C
D
Chapter 01 – Economics: The Study of Opportunity Cost
Figure 1.2
26) In Figure 1.2, which labeled points are attainable?
A) only A
B) only B and C
C) only D
D) A, B and C
27) In Figure 1.2, which labeled points are unattainable?
A) only A
B) only B and C
C) only D
D) A, B and C
28) In Figure 1.2, which labeled points represent the existence of unemployment?
A) only A
B) only B and C
C) only D
D) A, B and C
29) In Figure 1.2, which labeled point indicates that there are sufficient resources and technology
to produce the combination of goods represented by that point?
A) only A
B) only C
C) only D
D) A, B and C
Chapter 01 – Economics: The Study of Opportunity Cost
30) In Figure 1.2, which labeled point indicates that there are insufficient resources or technology
to produce the combination of goods represented by that point?
A) only A
B) only C
C) only D
D) A, B and C
Use the following to answer questions 31-34:
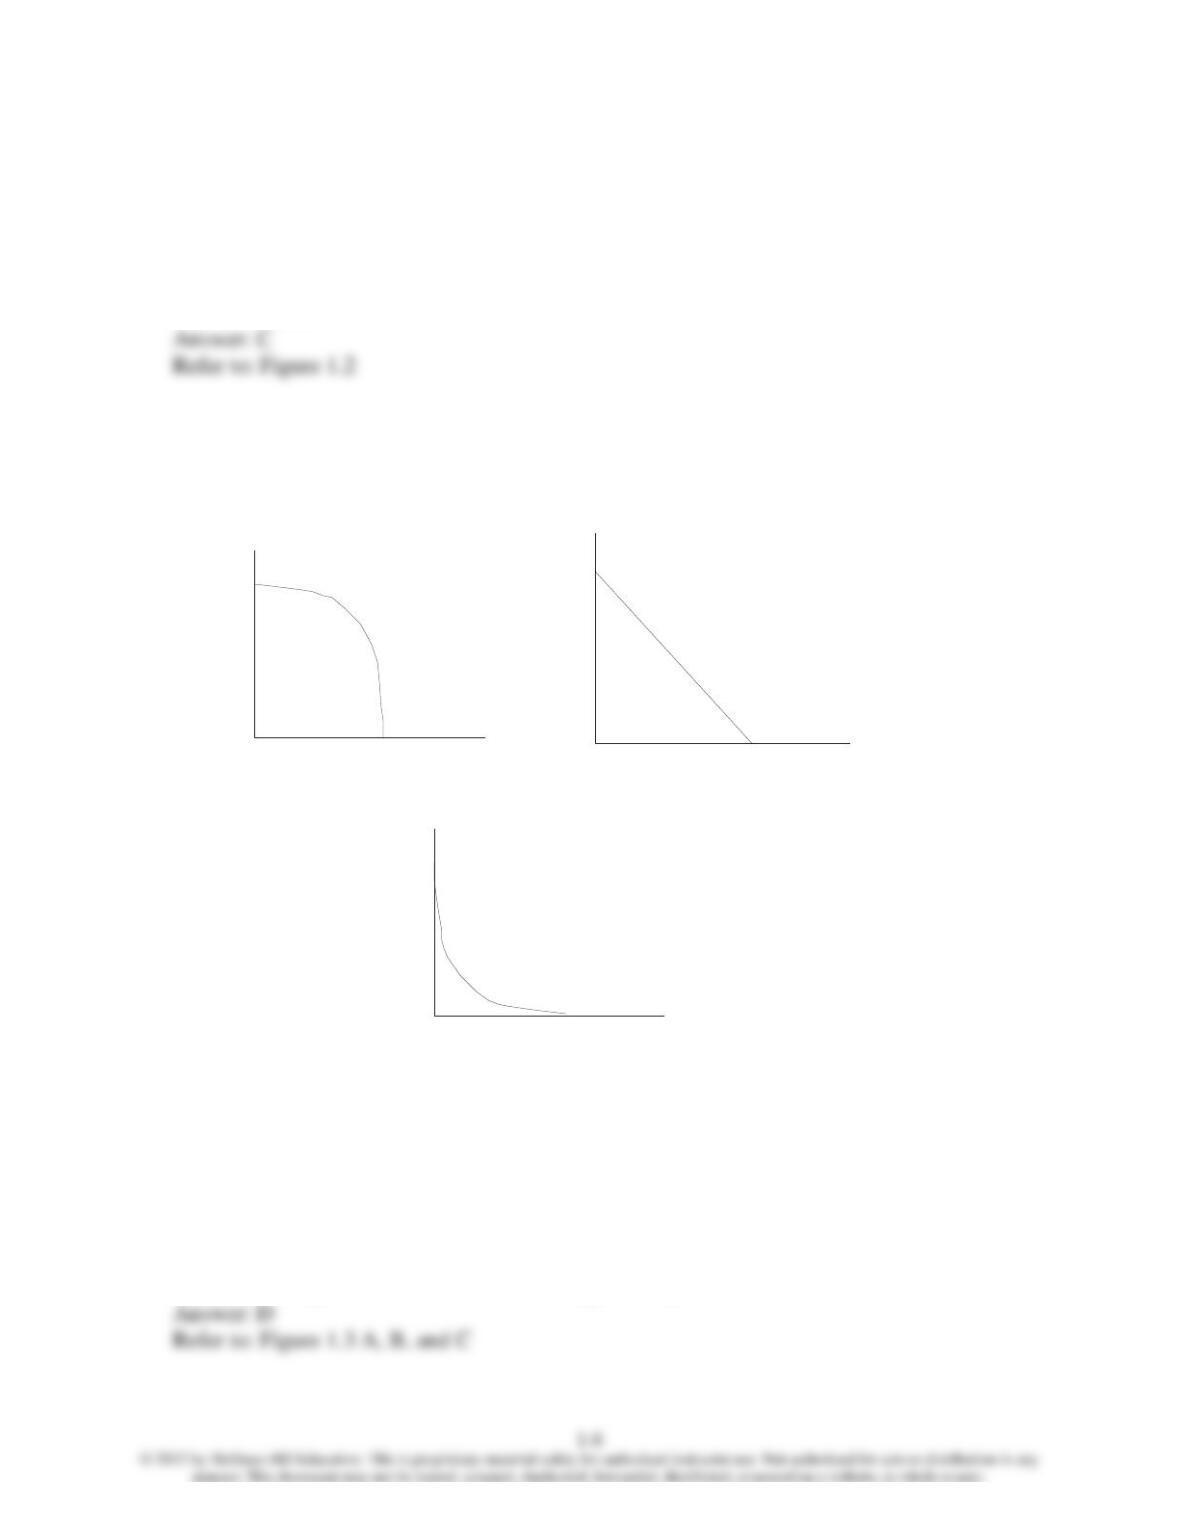
Figure 1.3 A, B and C
31) In Figure 1.3 A, B and C, which depicts the existence of opportunity cost?
A) Figure A
B) Figure B
C) Figure C
D) All three figures show the existence of opportunity cost.
Soda
Pizza
Production Possibilities Frontier
Sod
a
Pizza
Production Possibilities Frontier
Soda
Pizza
Production Possibilities Frontier
Figure A Figure B
Figure C
Chapter 01 – Economics: The Study of Opportunity Cost
32) In Figure 1.3 A, B and C, which depicts the existence of scarcity?
A) Figure A
B) Figure B
C) Figure C
D) All three figures show the existence of scarcity.
33) In Figure 1.3 A, B and C, which depicts the existence of constant opportunity cost?
A) Figure A
B) Figure B
C) Figure C
D) All three figures show the existence of constant opportunity cost.
34) In Figure 1.3 A, B and C, which depicts the existence of increasing opportunity cost?
A) Figure A
B) Figure B
C) Figure C
D) All three figures show the existence of increasing opportunity cost.
Chapter 01 – Economics: The Study of Opportunity Cost
Use the following to answer questions 35-43:
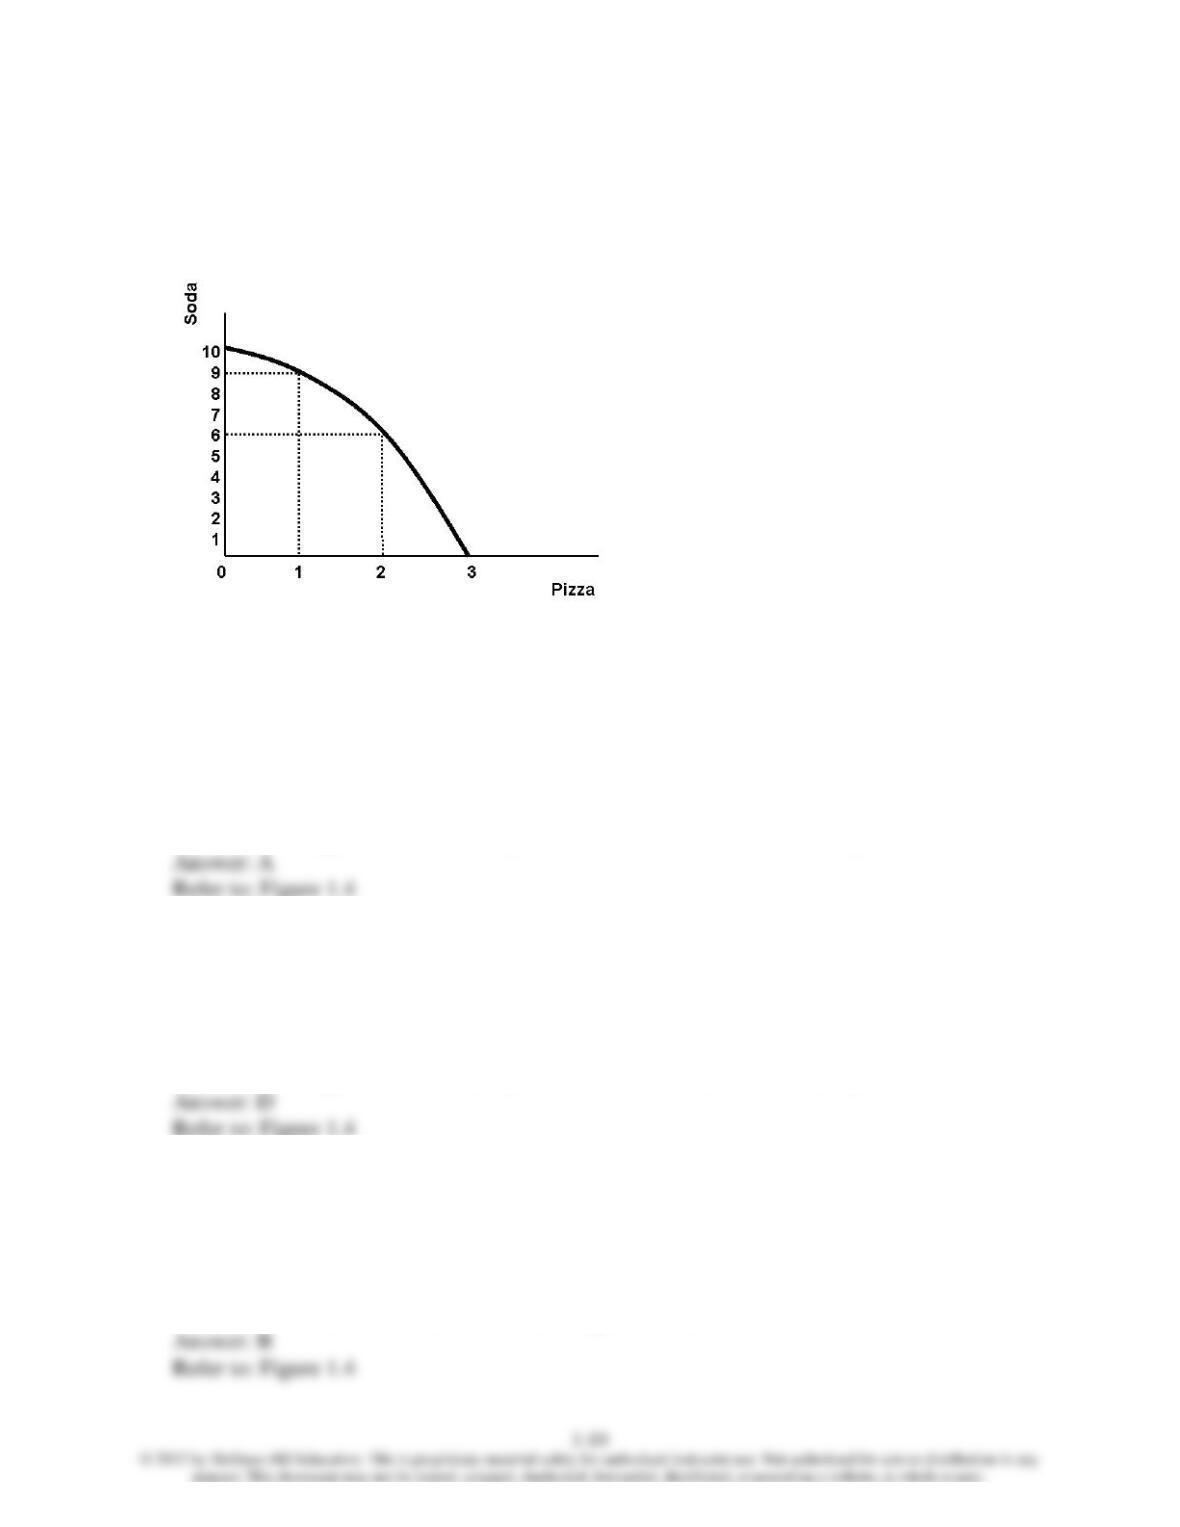
Figure 1.4
35) Using Figure 1.4 above you can tell that
A) there is increasing opportunity cost.
B) there is unemployment.
C) there is constant opportunity cost.
D) the technology does not exist to produce 9 units of soda and 1 unit of pizza.
36) Using Figure 1.4 above you can tell that
A) the technology does not exist to produce 6 units of soda and 2 unit of pizza.
B) there is unemployment.
C) there is constant opportunity cost.
D) the technology does not exist to produce 9 units of soda and 3 unit of pizza.
37) Using Figure 1.4 above we know the production of 6 units of soda and 2 units of pizza is
A) possible, but there would be unemployment.
B) possible, but only if all resources were fully employed.
C) impossible because we have the resources but do not have the technology.
D) impossible because we have the technology but do not have the resources.
Chapter 01 – Economics: The Study of Opportunity Cost
38) Using Figure 1.4 above we know the production of 9 units of soda and 1 units of pizza is
A) possible, but there would be unemployment.
B) possible, but only if all resources were fully employed.
C) impossible because we have the resources but do not have the technology.
D) impossible because we have the technology but do not have the resources.
39) Using Figure 1.4 above we know the production of 9 units of soda and 3 units of pizza is
A) possible, but there would be unemployment.
B) possible, but only if all resources were fully employed.
C) impossible because we either do not have the resources or the technology.
D) undesirable.
40) Using Figure 1.4 above we know the production of 4 units of soda and 2 units of pizza is
A) possible, but there would be unemployed resources.
B) possible, but only if all resources were fully employed.
C) impossible because we have the resources but do not have the technology.
D) impossible because we have the technology but do not have the resources.
41) Referring to Figure 1.4, the opportunity cost of producing the first unit of pizza is
A) one unit of soda.
B) three units of soda.
C) six units of soda.
D) the same as the opportunity cost of producing the second unit of pizza.
42) Referring to Figure 1.4, the opportunity cost of producing the second unit of pizza is
A) one unit of soda.
B) three units of soda.
C) six units of soda.
D) the same as the opportunity cost of producing the first unit of pizza.
Chapter 01 – Economics: The Study of Opportunity Cost
43) Referring to Figure 1.4, the opportunity cost of producing the third unit of pizza is
A) one unit of soda.
B) three units of soda.
C) six units of soda.
D) the same as the opportunity cost of producing the first unit of pizza.
Use the following to answer questions 44-52:
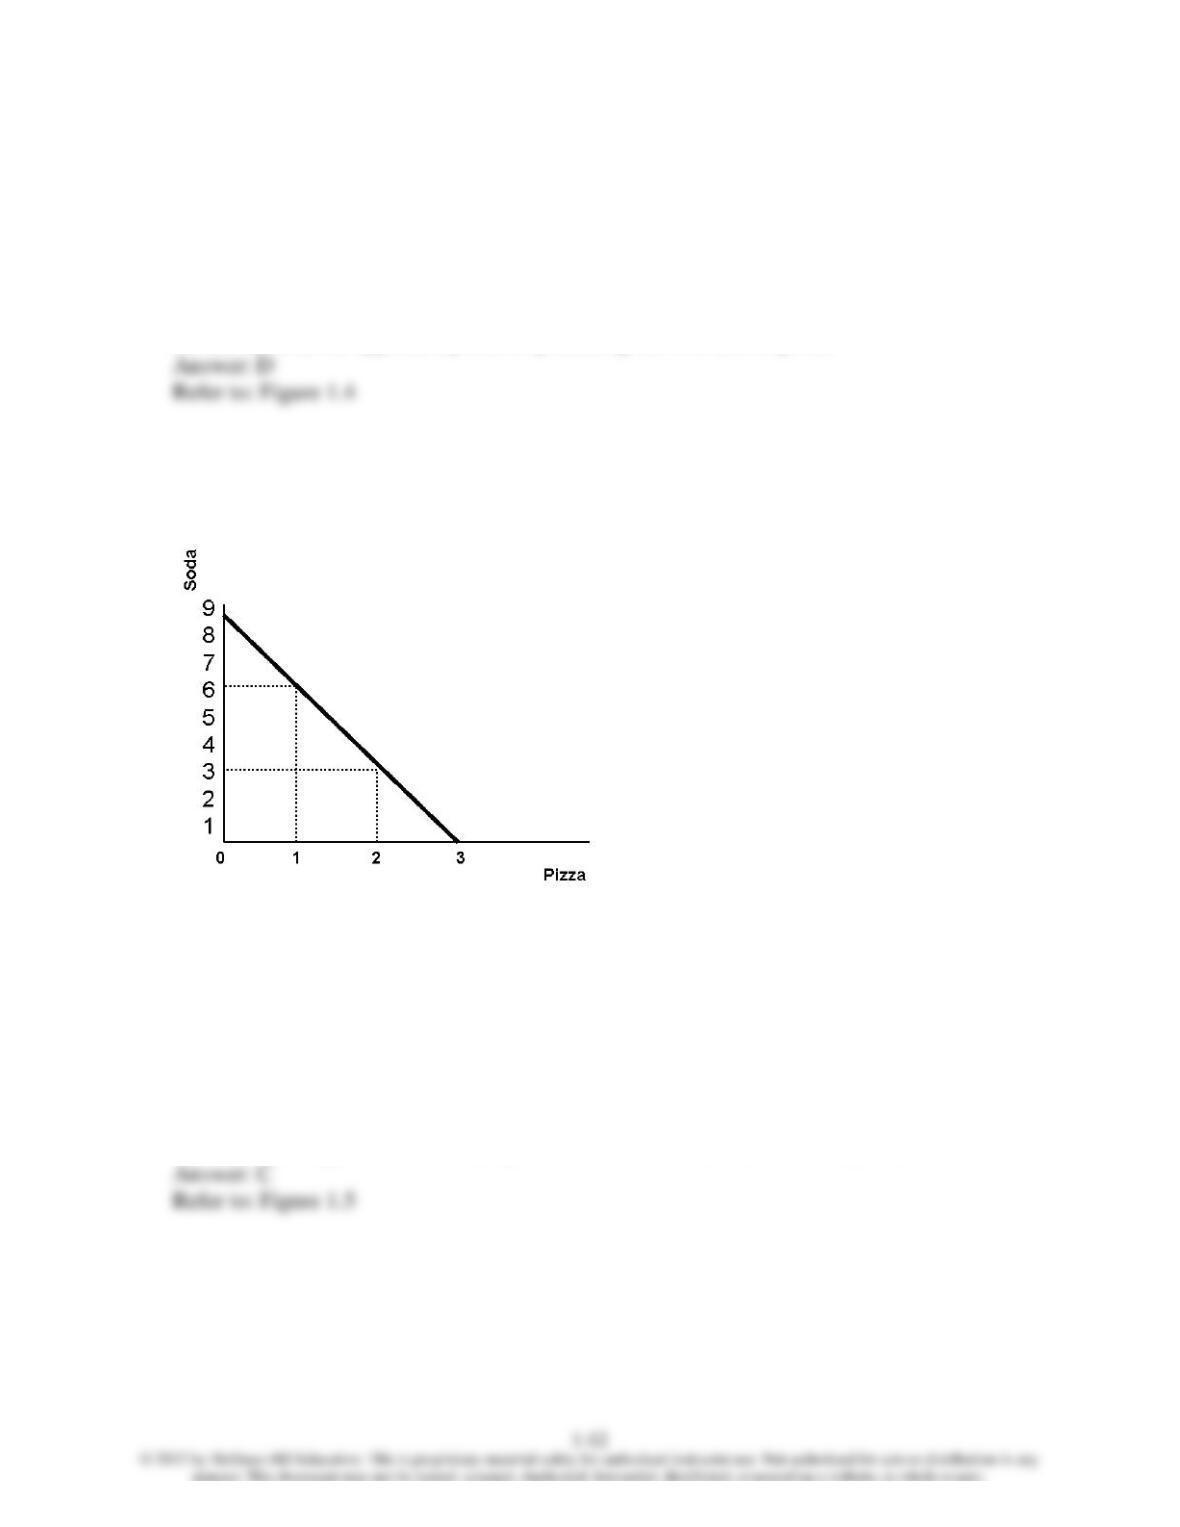
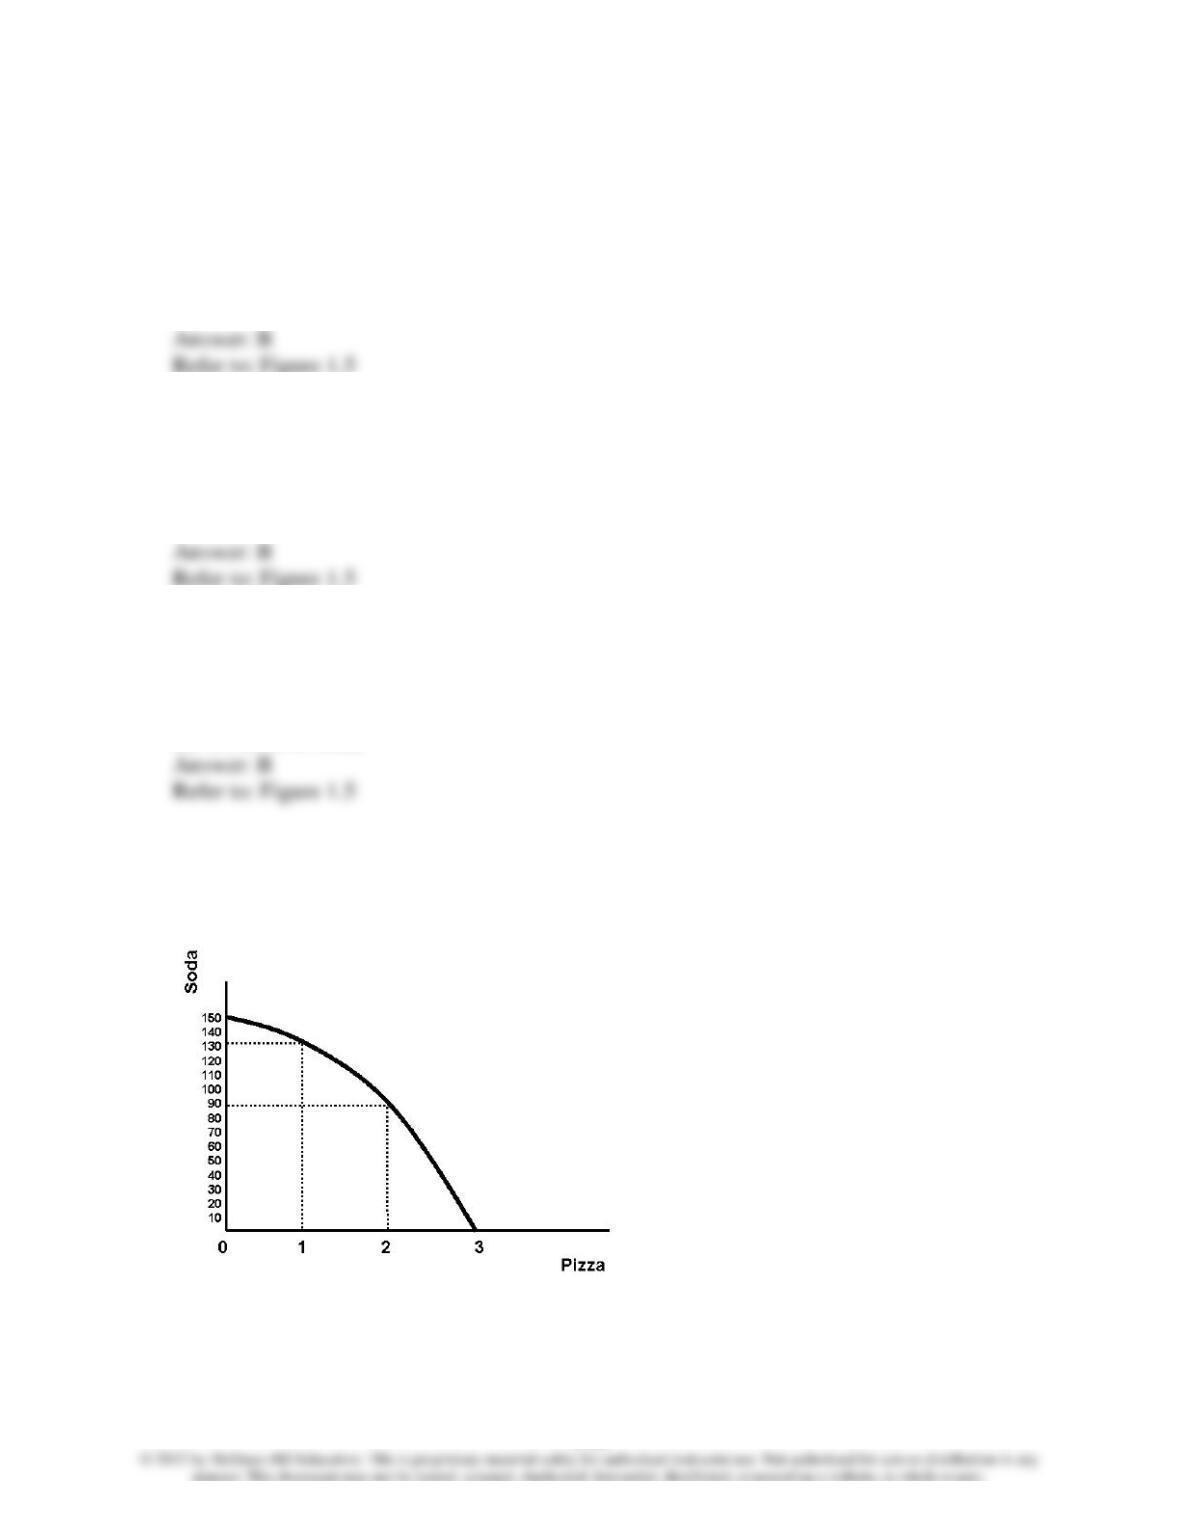
Figure 1.5
44) Using Figure 1.5 above you can tell that
A) there is increasing opportunity cost.
B) there is unemployment.
C) there is constant opportunity cost.
D) the technology does not exist to produce 6 units of soda and 1 unit of pizza.
Chapter 01 – Economics: The Study of Opportunity Cost
45) Using Figure 1.5 above you can tell that
A) the technology does not exist to produce 4 units of soda and 1 unit of pizza.
B) there is unemployment.
C) there is increasing opportunity cost.
D) the technology does not exist to produce 3 units of soda and 3 unit of pizza.
46) Using Figure 1.5 above we know the production of 3 units of soda and 2 units of pizza is
A) possible, but there would be unemployed.
B) possible, but only if all resources were fully employed.
C) impossible because we have the resources but do not have the technology.
D) impossible because we have the technology but do not have the resources.
47) Using Figure 1.5 above we know the production of 6 units of soda and 1 unit of pizza is
A) possible, but there would be unemployed resources.
B) possible, but only if all resources were fully employed.
C) impossible because we have the resources but do not have the technology.
D) impossible because we have the technology but do not have the resources.
48) Using Figure 1.5 above we know the production of 6 units of soda and 2 units of pizza is
A) possible, but there would be unemployed resources.
B) possible, but only if all resources were fully employed.
C) impossible because we either do not have the resources or the technology.
D) undesirable.
49) Using Figure 1.5 above we know the production of 2 units of soda and 2 units of pizza is
A) possible, but there would be unemployed resources.
B) possible, but only if all resources were fully employed.
C) impossible because we have the resources but do not have the technology.
D) impossible because we have the technology but do not have the resources.
Chapter 01 – Economics: The Study of Opportunity Cost
50) Referring to Figure 1.5, the opportunity cost of producing the first unit of pizza is
A) one unit of soda.
B) three units of soda.
C) six units of soda.
51) Referring to Figure 1.5, the opportunity cost of producing the second unit of pizza is
A) one unit of soda.
B) three units of soda.
C) six units of soda.
52) Referring to Figure 1.5, the opportunity cost of producing the third unit of pizza is
A) one unit of soda.
B) three units of soda.
C) six units of soda.
Use the following to answer questions 53-58: