Ch.3 NumericallySummarizingData
3.1 MeasuresofCentralTendency
1 Determinethearithmeticmean,median,andmodeofavariablefromrawdata.
SHORTANSWER.Writethewordorphrasethatbestcompleteseachstatementoranswersthequestion.
Provideanappropriateresponse.
1) Findthemean,median,andmodeofthefollowingstatisticstudentsʹtestscores:
71 74 67 71 64 72 71 65 66 69
2) Calculatethemean,median,andmodeforthefollowingsample:5,10,6,11,1
,
1
,
10,1.
3) Calculatethemean,median,andmodeforthefollowingsample:5,10,6,100,0,0,10,0.
4) Thehightemperatures(indegreesCelsius)eachdayoverathreeweekperiodwereasfollows:17,18,20,22,
21,19,16,15,18,20,21,21,22,21,19,20,19,17,16,16,17.Computethemean,median,andmode.
5) Inasampleof18studentsatEastHighSchoolthefollowingnumberofdaysofabsenceswererecordedforthe
previoussemester:4,3,1,0,4,2,3,0,1,2,3,0,4,1,1,5,1,1.Computethemean,median,andmode.
6) Thenumberofgoalsscoredbyarandomsampleof16hockeyplayersforagivenseasonare5,3,21,10,7,2,0,
30,19,6,4,7,10,5,7,and24.Computethemean,median,andmode.
MULTIPLECHOICE.Choosetheonealternativethatbestcompletesthestatementoranswersthequestion.
7) Theheightsoftenfemalestudents(ininches)inacollegemathclassarelistedbelow.Findthemean.
65 66 67 66 67 70 67 70 71 68
A) 67.7inches B) 65.5inches C) 71.1inches D) 70.0inches
8) Theheightsoftenmalestudents(ininches)inacollegebiologyclassarelistedbelow.Findthemean.
71 67 67 72 76 72 73 68 72 72
A) 71inches B) 67inches C) 68inches D) 72inches
9) Therepaircostsforfivecarswhichwerecrashedbyasafetytestingorganizationwereasfollows:
$100,$150,$200,$250,and$150.Findthemeancostofrepair.
A) $170 B) $160 C) $180 D) $140
10) Eachyearadvertisersspendbillionsofdollarspurchasingcommercialtimeonnetworksportstelevision.Inthe
first6monthsof1988,advertisersspent$1.1billion.Arecentarticlelistedthetop10leadingspenders(in
millionsofdollars):
CompanyA$70.3 CompanyF$26.4
CompanyB60.5 CompanyG24.6
CompanyC57.9 CompanyH21.1
CompanyD54.7 CompanyI22.4
CompanyE29.3 CompanyJ20.9
Calculatethemeanamountspent.
A) 38.81milliondollars B) 19.52 milliondollars
C) 381.01milliondollars D) 49.40 milliondollars
Page54
11) Thenumberofstudentsenrolledinaphysicsclassforthelasttensemestersarelistedbelow.Findthemedian
numberofstudents.
65 66 67 66 67 70 67 70 71 68
A) 67students B) 66students C) 68students D) 70students
12) Thecommutingtimes(inminutes)ofanemployeefortenconsecutivedaysarelistedbelow.Findthemedian
commute.
71 67 67 72 76 72 73 68 72 72
A) 72minutes B) 67minutes C) 71minutes D) 73minutes
13) Thefollowingdatarepresentsarandomsampleof15complaintsregisteredwiththecustomerservice
departmentofastore.Determinethemediancomplaint.
Other defectiveproduct excessivewaitingtime
Messystore other other
Messystore other messystore
Other messystore messystore
Defectiveproduct other messystore
A) Nomedian B) Messystore
C) Defectiveproduct D) Excessivewaitingtime
14) Eachyearadvertisersspendbillionsofdollarspurchasingcommercialtimeonnetworksportstelevision.Inthe
first6monthsoftheyear,advertisersspent$1.1billion.Arecentarticlelistedthetop10leadingspenders(in
millionsofdollars):
CompanyA$73.2 CompanyF$24.6
CompanyB61.7 CompanyG24.4
CompanyC57 CompanyH23.9
CompanyD56.4 CompanyI23
CompanyE28.5 CompanyJ19.2
Calculatethemedian.
A) 26.55milliondollars B) 5.15 milliondollars
C) 39.19milliondollars D) 54.00 milliondollars
SHORTANSWER.Writethewordorphrasethatbestcompleteseachstatementoranswersthequestion.
15) Thenumberofyardsthatafootballplayerrushedinthefirst13gamesofhisNFLcareerarelistedbelow.Find
themeanandmediannumberofyardsrushed.Roundthemeantothenearestwholenumber.
Whichmeasureofcentraltendency–themeanorthemedian–betterrepresentsthedata?Explainyour
reasoning.
349 32 33 39 22 42 9939 52 58 70
16) Thenumberofhomeworkpointsearnedbytwelvestudentsinahistoryclassoveronetermarelistedbelow.
Findthemeanandmediannumberofpoints.Roundthemeantothenearestwholenumber.Whichmeasureof
centraltendency–themeanorthemedian–bestrepresentsthedata?Explainyourreasoning.
102 56 25 9956 165 88 122 150 91 114
17) Theannualprofitsofteninternetbusinessesarelistedbelow.Findthemeanandmedianprofits.Roundthe
mediantothenearestdollar.Whichmeasure–themeanorthemedian–bestrepresentsthedata?Explainyour
reasoning.
$1,172,246 $163,659 $440,584 $350,634 $290,596
$186,731 $145,809 $143,209 $139,096 $125,106
Page55
MULTIPLECHOICE.Choosetheonealternativethatbestcompletesthestatementoranswersthequestion.
18) Thecommutingtimesoftenemployees(inminutes)arelistedbelow.Findthemodescore.
65 66 67 66 67 70 67 70 71 68
A) 67minutes B) 65minutes C) 66minutes D) 68minutes
19) TheFebruaryutilitybills(indollars)fortenresidentsofalargecityarelistedbelow.Findthemodeamount.
71 67 67 72 76 72 73 68 72 72
A) $72 B) $67 C) $76 D) $73
20) ThefollowingdatarepresentthebachelordegreesofCEOʹsatareasmallbusinesses.Determinethemode
degree.
Degree Number
Accounting 29
Business 42
LiberalArts 5
Marketing 24
Other 7
A)
b
usiness B) accounting C) marketing D) nomode
21) Thefollowingdatarepresentarandomsampleof15complaintsregisteredwiththecustomerservice
departmentofastore.Determinethemodecomplaint.
defectiveproduct rudepersonnel messystore
other defectiveproduct defectiveproduct
other excessivewaitingtime other
defectiveproduct other other
rudepersonnel defectiveproduct other
A) other B) defectiveproduct C) messystore D) nomode
SHORTANSWER.Writethewordorphrasethatbestcompleteseachstatementoranswersthequestion.
22) Theaccompanyingdatasetcontainsquizscoresfor12studentsinachemistryclass:18,15,5,8,15,20,2,16,10,
12,20,15.
a.Findameasureofcentraltendencythatseparatesthedataintotwogroupssuchthateachgroup
consistsof50%ofthescoresaboveand50%ofthescoresbelowthatmeasure.
b.Findameasureofcentraltendencythatrepresentsthequizscorethatoccursmostoften.
c.Findameasureofcentraltendencythatrepresentstheaverageofthe12quizscores.
MULTIPLECHOICE.Choosetheonealternativethatbestcompletesthestatementoranswersthequestion.
23) IfX1
,
X2
,
X3
,
…,XNaretheNobservationsofavariablefromapopulation,thenthepopulationmeanis
symbolizedby
A) μB) XC) ΣD) X
~
24) Anumericalsummaryofapopulationisa
A) Parameter B) Statistic
C) Variable D) Qualitativeresponse
25) Themedianofadatasetforavariableisthedatavaluethat
A) Liesinthemiddleofthedatawhenthedataisarrangedinascendingorder.
B) Appearsthemostoften
C) Istheaverage,thatis,thesumofallthedatavaluesofthevariabledividedbythenumberofobservations
inthedataset?
D) Noneofthese
Page56
26) The________ofavariableiscomputedbydeterminingthesumofallthevaluesofthevariableinthedataset
anddividingthissumbythenumberofobservationsinthedataset.
A) Arithmeticmean B) Median C) Mode D) Geometricmean
27) Whichmeasureofcentraltendencymaynotexistforallnumericdatasets?
A) Mode B) Median C) Mean D) Midrange
28) Whichmeasureofcentraltendencymayhavemorethanonevalueinanumericdataset?
A) Mode B) Median C) Mean D) Midrange
29) Whichmeasureofcentraltendencyisnotresistanttoextremevaluesinanumericdataset?
A) Mean B) Mode C) Median D) Parameters
2 Explainwhatitmeansforastatistictoberesistant.
MULTIPLECHOICE.Choosetheonealternativethatbestcompletesthestatementoranswersthequestion.
Provideanappropriateresponse.
1) Describetheshapeofthehistogram.Thedataset:Pick–Threelotteryresultsfor10consecutiveweeks
3676061784
1575915399
2230884024
A) uniform B) symmetric
C) skewedtotheleft D) skewedtotheright
2) Describetheshapeofthehistogram.Thedataset:ageof20householdstereosystemsrandomlyselected
fromaneighborhood
12 64911 17898
913 515 768821
A) symmetric B) uniform
C) skewedtotheleft D) skewedtotheright
3) Describetheshapeofthehistogram.Thedataset:round–tripcommutingtimes(inminutes)of20randomly
selectedemployees
135 120 115 132 136 124 119 145 98 110
125 120 115 130 140 105 116 121 125 108
A) skewedtotheright B) uniform
C) skewedtotheleft D) symmetric
4) Thedistributionofsalariesofprofessionalbasketballplayersisskewedtotheright.Whichmeasureofcentral
tendencywouldbethebestmeasuretodeterminethelocationofthecenterofthedistribution?
A) median B) mode C) mean D) frequency
Page57
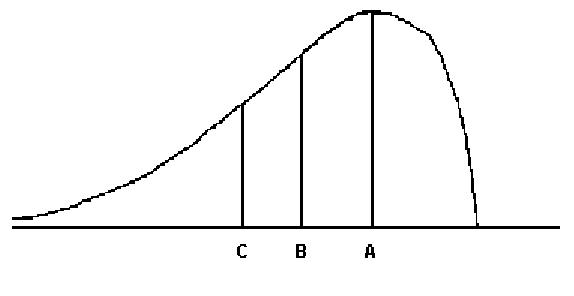
5)
Forthedistributiondrawnhere,identifythemean,median,andmode.
A) A=mode,B=median,C=mean B) A=median,B=mode,C=mean
C) A=mode,B=mean,C=median D) A=mean,B=mode,C=median
6) Indistributionsthatareskewedtotheright,whatistherelationshipofthemean,median,andmode?
A) mean>median>mode B) median>mean>mode
C) mode>median>mean D) mode>mean>median
7) Indistributionsthatareskewedtotheleft,whatistherelationshipofthemean,median,andmode?
A) mode>median>mean B) mean>median>mode
C) mode<mean<median D) mode>mean>median
8) Manyfirmsuseon–the–
j
obtrainingtoteachtheiremployeesnewsoftware.Supposeyouworkinthepersonnel
departmentofafirmthatjustfinishedtrainingagroupofitsemployeesinnewsoftware,andyouhavebeen
requestedtoreviewtheperformanceofoneofthetraineesonthefinaltestthatwasgiventoalltrainees.The
meanofthetestscoresis76.Additionalinformationindicatedthatthemedianofthetestscoreswas83.What
typeofdistributionmostlikelydescribestheshapeofthetestscores?
A) skewedtotheleft B) symmetric
C) skewedtotheright D) unabletodeterminewiththeinformationgiven
9) Aseveredroughtaffectedseveralwesternstatesfor3years.AChristmastreefarmerisworriedaboutthe
droughtʹseffectonthesizeofhistrees.Todecidewhetherthegrowthofthetreeshasbeenretarded,thefarmer
decidestotakeasampleoftheheightsof25treesandobtainsthefollowingresults(recordedininches):
60 57 62 69 46 54 64 60 59 58 75 51 49
67 65 44 58 55 48 62 63 73 52 55 50
Whichmeasureofcentraltendencywouldbeconsideredthebestmeasuretouseinthisproblem?
A) mean B) median C) mode D) range
SHORTANSWER.Writethewordorphrasethatbestcompleteseachstatementoranswersthequestion.
10) Parkingatalargeuniversityhasbecomeaverybigproblem.Universityadministratorsareinterestedin
determiningtheaverageparkingtime(e.g.thetimeittakesastudenttofindaparkingspot)ofitsstudents.An
administratorinconspicuouslyfollowed140studentsandcarefullyrecordedtheirparkingtimes.Theparking
timesrecordedfollowedadistributionthatwasskewedtotheright.Basedonthisinformation,discussthe
relationshipbetweenthemeanandthemedianforthe140studentparkingtimescollected.
Page58
11) Theoutputbelowgivesthemeanandmedianforthenationaldropoutratesofhighschoolstudentsin2010
and2012.
Drop2010 Drop2012
N5151
MEAN 28.38 26.76
MEDIAN 27.94 25.54
Usethesampleinformationtodeterminetheshapeofthedistributionsofthehighschooldropoutratesin2010
and2012.
MULTIPLECHOICE.Choosetheonealternativethatbestcompletesthestatementoranswersthequestion.
12) Theannualprofitsoffivelargecorporationsinacertainareaaregivenbelow.Whichmeasureofcentral
tendencyshouldbeused?
$135,000 $143,000 $163,000 $133,000 $1,213,000
A) median B) mean C) mode D) midrange
13) Ifthegraphofadistributionofdatashowsthatthegraphisskewedtotherightthenthe
A) Mean>Median
B) Mean≈Median
C) Mean<Median
D) Noconclusionabouttherelativepositionofthemeanandthemediancanbemade
14) Ifthegraphofadistributionofdatashowsthatthegraphisskewedtotheleftthenthe
A) Median>Mean
B) Mean≈Median
C) Mean>Median
D) Noconclusionabouttherelativepositionofthemeanandthemediancanbemade
15) Ifthegraphofadistributionofdatashowsthatthegraphissymmetricthenthe
A) Meanisabettermeasureofcentraltendency
B) Medianisabettermeasureofcentraltendency
C) Modeisabettermeasureofcentraltendency
D) Midrangeisabettermeasureofcentraltendency
16) Whichmeasureofcentraltendencyismorerepresentativeofthetypicalobservationifthegraphofthedatais
skewedtotheright?
A) Median B) Mean C) Mode D) Midrange
17) Whichmeasureofcentraltendencyismorerepresentativeofthetypicalobservationifthegraphofthedatais
skewedtotheleft?
A) Median B) Mean C) Mode D) Midrange
3.2 MeasuresofDispersion
1 Determinetherange,standarddeviation,andvarianceofavariablefromrawdata.
MULTIPLECHOICE.Choosetheonealternativethatbestcompletesthestatementoranswersthequestion.
Computetherangeforthesetofdata.
1) 13
,
14
,
15
,
16
,
17
A) 4 B) 17 C) 0.8 D) 13
Page59
2) 3
,
3
,
3
,
17
,
29
,
29
,
29
A) 26 B) 16.1 C) 17 D) 169.1
3) 9
,
20
,
9
,
20
,
9
,
20
,
9
,
20
A) 11 B) 20 C) 14.5 D) 22
4) 8
,
19
,
2
,
13
,
9
A) 17 B) 19 C) 2 D) 1
5) 25
,
34
,
13
,
42
,
52
A) 39 B) 52 C) 13 D) 33.2
6) 9
,
9
,
7
,
1
,
6
,
10
,
9
,
7
,
9
A) 9 B) 10 C) 7.4 D) 11
7) 67
,
140
,
25
,
90
,
176
A) 151 B) 176 C) 25 D) 99.6
8) 112
,
494
,
230
,
565
,
401
,
257
A) 453 B) 565 C) 112 D) 343.2
9) 2.8
,
5.8
,
1.6
,
4.4
,
6.7
,
3.8
A) 5.1 B) 6.7 C) 1.6 D) 4.2
10) 0.23
,
0.12
,
0.554
,
0.379
,
0.575
,
0.257
A) 0.455 B) 0.575 C) 0.12 D) 0.353
Findthesamplestandarddeviation.
11) 15
,
16
,
17
,
18
,
19
A) 1.6 B) 2.5 C) 1.3 D) 1.5
12) 11
,
11
,
11
,
14
,
17
,
17
,
17
A) 3 B) 2.8 C) 7.7 D) 9.0
13) 19
,
16
,
17
,
12
,
8
,
7
,
16
,
9
,
12
A) 4.3 B) 4.1 C) 18.6 D) 16.5
14) 88
,
87
,
21
,
86
,
38
,
44
,
43
,
47
,
80
A) 25.7 B) 23.0 C) 589.3 D) 530.4
15) 262
,
296
,
116
,
174
,
162
,
287
,
220
,
287
,
201
A) 64.3 B) 60.6 C) 4138.2 D) 3678.4
16) 11
,
5
,
11
,
13
,
16
,
13
,
19
,
12
,
12
,
19
A) 4.1 B) 3.8 C) 1.5 D) 3.6
17) 4
,
1
,
8
,
14
,
7
,
12
,
16
,
17
,
10
A) 5.4 B) 5.1 C) 29.4 D) 26.1
Provideanappropriateresponse.
18) TheAprilprecipitationamounts(ininches)for10citiesarelistedbelow.Findtherangeofthedata.
2.0 3.2 1.8 2.9 0.9 4.0 3.3 2.9 3.6 0.8
A) 3.2inches B) 2.45inches C) 1.4inches D) 2.8inches
Page60
19) TheJanuaryutilitybills(indollars)for20residentsofalargecityarelistedbelow.Findtherangeofthedata.
70 72 71 70 69 73 69 68 70 71
67 71 70 74 69 68 71 71 71 72
A) $7 B) $2.98 C) $2 D) $1.73
20) Thecosts(indollars)of10collegemathtextbooksarelistedbelow.Findthesamplestandarddeviation.
70 72 71 70 69 73 69 68 70 71
A) $1.49 B) $70.30 C) $5.00 D) $2.23
SHORTANSWER.Writethewordorphrasethatbestcompleteseachstatementoranswersthequestion.
21) Thecosts(indollars)of10collegemathtextbooksarelistedbelow.Findthepopulationstandarddeviation
andthepopulationvariance.
70 72 71 70 69 73 69 68 70 71
22) Inarandomsample,10employeesatalocalplantwereaskedtocomputethedistancetheytraveltoworkto
thenearesttenthofamile.Thedataislistedbelow.Computetherange,samplestandarddeviationandsample
varianceofthedata.
1.1 5.2 3.6 5.0 4.8 1.8 2.2 5.2 1.5 0.8
MULTIPLECHOICE.Choosetheonealternativethatbestcompletesthestatementoranswersthequestion.
23) Thetopspeeds(inmph)forasampleoffivenewautomobilebrandsarelistedbelow.Calculatethestandard
deviationofthespeeds.
160,125,190,185,105
A) 37.2mph B) 28,458.00 mph C) 153.00 mph D) 85mph
24) Overthelast10yearsfourmutualfundsallhadthesamemeanrateofreturn,12%.Thesemutualfundshad
differentstandarddeviationsasfollows:MutualMoney8%,Co–joinedInvestments6%,TogetherFund4%,All
forOneFund9%.Whichmutualfundinvestmentisthemostconsistentinrateofreturn?
A) TogetherFund B) MutualMoney
C) Co–
j
oinedInvestments D) AllforOneFund
25) Thebookcost(indollars)foronesemesterʹsbooksaregivenbelowforasampleoffivecollegestudents.
Calculatethesamplevarianceofthebookcosts.
200,130,400,500,345
A) 22,450.00 B) 149.83 C) 370.00 D) 315.00
SHORTANSWER.Writethewordorphrasethatbestcompleteseachstatementoranswersthequestion.
26) Theagesoffiverandomlyselectedstudentsinthebiologydepartmentataprivateuniversityare30
,
26
,
27
,
25
,
and29.Calculatethesamplevarianceoftheseages.
Page61
MULTIPLECHOICE.Choosetheonealternativethatbestcompletesthestatementoranswersthequestion.
27) Eachyearadvertisersspendbillionsofdollarspurchasingcommercialtimeonnetworksportstelevision.Inthe
first6monthsof1988,advertisersspent$1.1billion.Whowerethelargestspenders?Inarecentarticle,listed
thetop10leadingspenders(inmillionofdollars):
CompanyA$70.7 CompanyF$27.3
CompanyB60.7 CompanyG26.1
CompanyC55.4 CompanyH22.8
CompanyD54.8 CompanyI23
CompanyE28.7 CompanyJ19.4
Calculatethesamplevariance.
A) 367.36 B) 19.17 C) 38.89 D) 51.30
28) Inthecomputationofthesamplestandardvariance,howmanydegreesoffreedomarethereinadatasetthat
has15datavalues?
A) 14 B) 15 C) 16 D) noneofthese
29) Forthedatasetgivenbelowthesamplevariancewillbecomputed.Howmanydegreesoffreedomarethere?
6961511 598
A) 8 B) 9 C) 1 D) 10
30) Lastyearbattingaveragesinprofessionalbaseballaveraged0.266 withahighof0.334andalowof0.228
(minimum250at–bats).Basedonthisinformation,whichmeasureofvariationcouldbecalculated?
A) range B) variance
C) standarddeviation D) percentile
31) Whichisnotameasureofdispersion?
A) Mean B) Standarddeviation
C) Variance D) Range
32) The_______________istheeasiestmeasureofdispersiontocalculate.
A) Range B) Standarddeviation
C) Variance D) Meanabsolutedeviation
33) TrueorFalse:Thevarianceofapopulationisthearithmeticaverageofthesquareddeviationsaboutthe
populationmean.
A) True B) False
34) TrueorFalse:Varianceisthesquarerootofstandarddeviation.
A) False B) True
35) Astatisticissaidtobebiasedifit
A) Systematicallyunderestimatesoroverestimatesaparameter
B) Hasexactlythesamevalueastheparameter
C) Isdeterminedfromatrimmedsample
D) Leadstoanerroneousconclusionaboutthesample
Page62
2 UsetheEmpiricalRuletodescribedatathatarebellshaped.
MULTIPLECHOICE.Choosetheonealternativethatbestcompletesthestatementoranswersthequestion.
Provideanappropriateresponse.
1) Atatennistournamentastatisticiankeepstrackofeveryserve.Thestatisticianreportedthatthemeanserve
speedofaparticularplayerwas104milesperhour(mph)andthestandarddeviationoftheservespeedswas8
mph.Assumethatthestatisticianalsogaveustheinformationthatthedistributionoftheservespeedswasbell
shaped.Whatproportionoftheplayerʹsservesareexpectedtobebetween112mphand120mph?
A) 0.1350 B) 0.270 C) 0.95 D) 0.68
2) TheamountoftelevisionviewedbytodayʹsyouthisofprimaryconcerntoParentsAgainstWatching
Television(PAWT).300parentsofelementaryschool–agedchildrenwereaskedtoestimatethenumberof
hoursperweekthattheirchildwatchedtelevision.Themeanandthestandarddeviationfortheirresponses
were16and4,respectively.PAWTconstructedastem–and–leafdisplayforthedatathatshowedthatthe
distributionoftimeswasabell–shapeddistribution.Giveanintervalaroundthemeanwhereyoubelievemost
(approximately95%)ofthetelevisionviewingtimesfellinthedistribution.
A)
b
etween8and24hoursperweek B) lessthan12 andmorethan20hoursperweek
C)
b
etween4and28hoursperweek D)
b
etween12 and20hoursperweek
3) Healthcareissuesarereceivingmuchattentioninbothacademicandpoliticalarenas.Asociologistrecently
conductedasurveyofcitizensover60yearsofagewhosenetworthistoohightoqualifyforgovernment
healthcarebutwhohavenoprivatehealthinsurance.Theagesof25uninsuredseniorcitizenswereasfollows:
68 73 66 76 86 74 61 89 65 90 69 92 76
62 81 63 68 81 70 73 60 87 75 64 82
Supposethemeanandstandarddeviationare74.0and9.7,respectively.Ifweassumethatthedistributionof
agesisbellshaped,whatpercentageoftherespondentswillbebetween64.3and93.4yearsold?
A) approximately81.5% B) approximately68%
C) approximately95% D) approximately83.9%
4) Asmallcomputingcenterhasfoundthatthenumberofjobssubmittedperdaytoitscomputershasa
distributionthatisapproximatelybellshaped,withameanof84jobsandastandarddeviationof10.Wheredo
weexpectmost(approximately95%)ofthedistributiontofall?
A)
b
etween64and104jobsperday B)
b
etween74 and94jobsperday
C)
b
etween54and114jobsperday D)
b
etween64 and114jobsperday
5) Astudywasdesignedtoinvestigatetheeffectsoftwovariables–(1)astudentʹslevelofmathematicalanxiety
and(2)teachingmethod–onastudentʹsachievementinamathematicscourse.Studentswhohadalowlevel
ofmathematicalanxietyweretaughtusingthetraditionalexpositorymethod.Thesestudentsobtainedamean
scoreof460withastandarddeviationof50onastandardizedtest.Assumingabell–shapeddistribution,what
percentageofscoresexceeded360?
A) approximately97.5% B) approximately95%
C) approximately2.5% D) approximately84%
6) Astudywasdesignedtoinvestigatetheeffectsoftwovariables–(1)astudentʹslevelofmathematicalanxiety
and(2)teachingmethod–onastudentʹsachievementinamathematicscourse.Studentswhohadalowlevel
ofmathematicalanxietyweretaughtusingthetraditionalexpositorymethod.Thesestudentsobtainedamean
scoreof460withastandarddeviationof40onastandardizedtest.Assumingabell–shapeddistribution,
wherewouldapproximately68%ofthestudentsscore?
A)
b
etween420and500 B)
b
etween380 and540
C)
b
elow380orabove540 D)
b
elow420 orabove500
Page63
7) Solarenergyisconsideredbymanytobetheenergyofthefuture.Arecentsurveywastakentocomparethe
costofsolarenergytothecostofgasorelectricenergy.Resultsofthesurveyrevealedthatthedistributionof
theamountofthemonthlyutilitybillofa3–bedroomhouseusinggasorelectricenergyhadameanof$120
andastandarddeviationof$11.Ifthedistributioncanbeconsideredbellshaped,whatpercentageofhomes
willhaveamonthlyutilitybillofmorethan$109?
A) approximately84% B) approximately95%
C) approximately16% D) approximately32%
8) Manyfirmsuseon–the–
j
obtrainingtoteachtheiremployeesnewsoftware.Supposeyouworkinthepersonnel
departmentofafirmthatjustfinishedtrainingagroupofitsemployeesinnewsoftware,andyouhavebeen
requestedtoreviewtheperformanceofoneofthetraineesonthefinaltestthatwasgiventoalltrainees.The
meanandstandarddeviationofthetestscoresare80and3,respectively,andthedistributionofscoresisbell
shaped.Whatpercentageoftest–takersscoredbetterthanatraineewhoscored71?
A) approximately99.85% B) approximately84%
C) approximately95% D) approximately97.5%
9) Aseveredroughtaffectedseveralwesternstatesfor3years.AChristmastreefarmerisworriedaboutthe
droughtʹseffectonthesizeofhistrees.Todecidewhetherthegrowthofthetreeshasbeenretarded,thefarmer
decidestotakeasampleoftheheightsof25trees.Typicallytreesofthisagehaveameanheightof65inches
withastandarddeviationof9inches.Assumingthedistributionisbellshaped,wheredoyouexpectmiddle
95%ofthetreeheightstofall?
A)
b
etween47and83inchestall B)
b
etween56and74inchestall
C)
b
etween38and92inchestall D) over56inchestall
10) Thescoresfromastatestandardizedtest haveabell–shapeddistributionwithameanof100andastandard
deviationof15.UsetheEmpiricalRuletofindthepercentageofstudentswithscoresbetween70and130.
A) 95% B) 68% C) 99.7% D) 100%
11) Thescoresfromastatestandardizedtest haveameanof80andastandarddeviationof10.Thedistributionof
thescoresisroughlybellshaped.UsetheEmpiricalRuletofindthepercentageofscoresthatliebetween60
and80.
A) 47.5% B) 68% C) 34% D) 95%
12) Theaveragescoreoflocalstudentsonacollegeentranceexamis110,withastandarddeviationof5.The
distributionisroughlybellshaped.UsetheEmpiricalRuletofindthepercentageoflocalstudentswithscores
above120.
A) 2.5% B) 5% C) 95% D) 97.5%
3 UseChebyshevʹsinequalitytodescribeanysetofdata.
MULTIPLECHOICE.Choosetheonealternativethatbestcompletesthestatementoranswersthequestion.
Provideanappropriateresponse.
1) Atatennistournamentastatisticiankeepstrackofeveryserve.Thestatisticianreportedthatthemeanserve
speedofaparticularplayerwas98milesperhour(mph)andthestandarddeviationoftheservespeedswas14
mph.Ifnothingisknownabouttheshapeofthedistribution,giveanintervalthatwillcontainthespeedsofat
leasteight–ninthsoftheplayerʹsserves.
A) 56mphto140mph B) 70 mphto126 mph
C) 42mphto154mph D) 140 mphto182 mph
Page64
2) Astudywasdesignedtoinvestigatetheeffectsoftwovariables–(1)astudentʹslevelofmathematicalanxiety
and(2)teachingmethod–onastudentʹsachievementinamathematicscourse.Studentswhohadalowlevel
ofmathematicalanxietyweretaughtusingthetraditionalexpositorymethod.Thesestudentsobtainedamean
scoreof480withastandarddeviationof20onastandardizedtest.Assumingnoinformationconcerningthe
shapeofthedistributionisknown,whatpercentageofthestudentsscoredbetween440and520?
A) atleast75% B) approximately95%
C) atleast88.9% D) approximately68%
SHORTANSWER.Writethewordorphrasethatbestcompleteseachstatementoranswersthequestion.
3) Commutingtimesforemployeesofalocalcompany haveameanof63.6minutesandastandarddeviationof
2.5minutes.WhatdoesChebyshevʹsTheoremsayaboutthepercentageofemployeeswithcommutingtimes
between58.6minutesand68.6minutes?
4) Commutingtimesforemployeesofalocalcompany haveameanof63.6minutesandastandarddeviationof
2.5minutes.WhatdoesChebyshevʹsTheoremsayaboutthepercentageofemployeeswithcommutingtimes
between56.1minutesand71.1minutes?
MULTIPLECHOICE.Choosetheonealternativethatbestcompletesthestatementoranswersthequestion.
5) Fillintheblank.____________givesusamethodofinterpretingthestandarddeviationthatappliestoanydata
set,regardlessoftheshapeofthedistribution.
A) Chebyshevʹsrule B) TheEmpiricalRule
C) Chebyshevʹsruleandtheempiricalrule D) noneofthese
6) Fillintheblank.____________isamethodofinterpretingthestandarddeviationthatappliestodatathathave
abell–shapeddistribution.
A) TheEmpiricalRule B) Chebyshevʹsrule
C) Chebyshevʹsruleandtheempiricalrule D) noneofthese
7) Ifnothingisknownabouttheshapeofadistribution,whatpercentageoftheobservationsfallwithin2
standarddeviationsofthemean?
A) atleast75% B) atmost25%
C) approximately95% D) approximately5%
3.3 MeasuresofCentralTendencyandDispersionfromGroupedData
1 Approximatethemeanandstandarddeviationofavariablefromgroupeddata.
MULTIPLECHOICE.Choosetheonealternativethatbestcompletesthestatementoranswersthequestion.
Provideanappropriateresponse.
1) Forthefollowingdata,approximatethemeannumberofunusedvacationdaysattheendoftheyear.
Days Frequency
1–22
3–421
5–620
7–810
9–10 30
A) 6.6 B) 6.1 C) 7.1 D) 7.8
Page65
2) Forthefollowingdata,approximatethemeannumberofemailsreceivedperday.
Emails(perday) Frequency
8–11 3
12–15 34
16–19 31
20–23 8
24–27 27
A) 18.4 B) 17.9 C) 16.9 D) 19.9
3) Forthefollowingdata,approximatethemeanweeklygrocerybill.
Bill(indollars) Frequency
135–139 13
140–144 7
145–149 11
150–154 18
155–159 9
A) $147.30 B) $145.30 C) $149.30 D) $145.80
4) Onarecentdayduringthefluseason,theMidtownMedicalClinicsawmanypatients.Patientshadtheir
temperatures(in°F)taken.Thedistributionoftemperaturesisgivenbelow.Determinethemeantemperature
ofasampleof100patients.
Temperatures Frequency
95.6–96.49 1
96.5–97.39 3
97.4–98.29 19
98.3–99.19 28
99.2–100.09 35
100.1–100.99 12
101.0–101.89 2
A) 99.08°F B) 99.52°F C) 98.75°F D) 98.63°F
5) A1–poundbagofpeanutscontains430peanuts.Thedistributionofweightsingramsofthepeanutsisgiven
below.Whatisthemeanweightofapeanut?
Weights
(grams)
Frequency
0.755–0.814 3
0.815–0.874 2
0.875–0.934 2
0.935–0.994 2
0.995–1.054 168
1.055–1.114 241
1.115–1.174 12
A) 1.059g B) 1.088g C) 0.965g D) 1.029g
Page66
6) Forthefollowingdataset,approximatethesamplestandarddeviationofunusedvacationdays.
Days Frequency
1–29
3–422
5–628
7–815
9–10 14
A) 2.4days B) 5.5days C) 3.5days D) 5.9days
7) Forthefollowingdataset,approximatethesamplestandarddeviationofemailsperday.
Emails(perday) Frequency
8–11 18
12–15 23
16–19 38
20–23 47
24–27 32
A) 5.1emails B) 4.0emails C) 25.8emails D) 19.3emails
8) Forthefollowingdataset,approximatethesamplestandarddeviationofcommutingtimesperday.
Commute(inmin) Frequency
50–52 5
53–55 8
56–58 12
59–61 13
62–64 11
A) 3.9min B) 6.6min C) 2.5min D) 55.7min
9) Forthefollowingdataset,approximatethesamplestandarddeviationofunusedvacationdays.
Days Frequency
1–29
3–412
5–68
7–85
9–10 4
A) 2.6days B) 2.5days C) 6.5days D) 6.6days
10) Forthefollowingdataset,approximatethesamplestandarddeviationofdistancesfromwork(inmiles).
Distance(miles) Frequency
8–11 15
12–15 21
16–19 36
20–23 39
24–27 23
A) 4.9miles B) 24.5miles C) 5.2miles D) 24.3miles
Page67
11) Forthefollowingdataset,approximatethesamplestandarddeviationofmonthlytelephonebills(indollars).
Bill(in$) Frequency
50–52 2
53–55 5
56–58 12
59–61 19
62–64 7
A) $3.11 B) $58.60 C) $93.12 D) $9.65
12) Onarecentdayduringthefluseason,theMidtownMedicalClinicsawmanypatients.Patientshadtheir
temperaturestaken(in°F).Thedistributionoftemperaturesisgivenbelow.Determinethestandarddeviation
ofthetemperaturesofasampleof100patients.
Temperatures Frequency
95.6–96.49 1
96.5–97.39 3
97.4–98.29 19
98.3–99.19 28
99.2–100.09 35
100.1–100.99 12
101.0–101.89 2
A) 1.021°F B) 1.031°F C) 1.015°F D) 1.04°F
13) A1–poundbagofpeanutscontained430peanuts.Thedistributionofweights(ingrams)ofthepeanutsis
givenbelow.Whatisthesamplestandarddeviationoftheweightofapeanut?
Weights
(grams)
Frequency
0.755–0.814 3
0.815–0.874 2
0.875–0.934 2
0.935–0.994 2
0.995–1.054 168
1.055–1.114 241
1.115–1.174 12
A) 0.045g B) 0.002g C) 0.209g D) 0.000004g
2 Computetheweightedmean.
MULTIPLECHOICE.Choosetheonealternativethatbestcompletesthestatementoranswersthequestion.
Provideanappropriateresponse.
1) Astudentreceivestestscoresof62,83,and91.Thestudentʹstermprojectscoreis88andherhomeworkscore
is76.Eachtestisworth20%ofthefinalgrade,thetermprojectis25%ofthefinalgrade,andthehomework
gradeis15%ofthefinalgrade.Whatisthestudentʹsmeanscoreintheclass?
A) 80.6 B) 76.6 C) 83.3 D) 80.0
Page68

2) Thegradesaregivenforastudentforaparticularterm.Findthegradepointaverage.Thepointvaluesof
gradesaregivenbelow.
A:4, B:3, C:2, D:1, F:0
GradeCreditHours
C3
F1
D2
F2
F3
A) 0.73 B) 2.2
C) 0.6 D) 1.8
3) Inahealthfoodstore,JennyandKevincreateatrailmixfromdriedfruit,nuts,andgranola.Theybuy5
poundsofdriedfruitat$4.00perpound,4poundsofnutsat$5.00perpound,and2poundsofgranolaat
$3.50perpound.Determinethecostperpoundofthemix.
A) $4.27 B) $3.76 C) $4.47 D) $4.39
4)
J
imbuyshisschoolsuppliesinbulk.Ononeparticularshoppingtriphebought5redpensat$1.29each,3blue
pensat$1.49each,6greenpensat$1.79eachand9blackpensat$0.99each.Whatwastheaveragecostofa
pen?
A) $1.33 B) $1.29 C) $0.99 D) $1.39
3.4 MeasuresofPositionandOutliers
1 Determineandinterpretz–scores.
SHORTANSWER.Writethewordorphrasethatbestcompleteseachstatementoranswersthequestion.
Provideanappropriateresponse.
1) Testscoresforastatisticsclasshadameanof79withastandarddeviationof4.5.Testscoresforacalculusclass
hadameanof69withastandarddeviationof3.7.Supposeastudentgetsa66onthestatisticstestanda81on
thecalculustest.Calculatethez–scoreforeachtest.Onwhichtestdidthestudentperformbetterrelativetothe
otherstudentsineachclass?
MULTIPLECHOICE.Choosetheonealternativethatbestcompletesthestatementoranswersthequestion.
2) Astudentscores56onageographytestand285 onamathematicstest.Thegeographytesthasameanof80
andastandarddeviationof20.Themathematicstesthasameanof300andastandarddeviationof10.Ifthe
dataforbothtestsarenormallydistributed,onwhichtestdidthestudentscorebetterrelativetotheother
studentsineachclass?
A) Thestudentscoredbetteronthegeographytest.
B) Thestudentscoredbetteronthemathematicstest.
C) Thestudentscoredthesameonbothtests.
3) Manyfirmsuseon–the–
j
obtrainingtoteachtheiremployeesnewsoftware.Supposeyouworkinthepersonnel
departmentofafirmthatjustfinishedtrainingagroupofitsemployeesinnewsoftware,andyouhavebeen
requestedtoreviewtheperformanceofoneofthetraineesonthefinaltestthatwasgiventoalltrainees.The
meanandstandarddeviationofthetestscoresare73and2,respectively,andthedistributionofscoresis
mound–shapedandsymmetric.Supposethetraineeinquestionreceivedascoreof72.Computethetraineeʹs
z–score.
A) z=–0.50 B) z=0.5 C) z= –0.96 D) z=0.96
Page69
4) Aseveredroughtaffectedseveralwesternstatesfor3years.AChristmastreefarmerisworriedaboutthe
droughtʹseffectonthesizeofhistrees.Todecidewhetherthegrowthofthetreeshasbeenretarded,thefarmer
decidestotakeasampleoftheheightsof25treesandobtainsthefollowingresults(recordedininches):
60 57 62 69 46 54 64 60 59 58 75 51 49
67 65 44 58 55 48 62 63 73 52 55 50
Thetreefarmerfeelsthenormalheightofatreethatwasunaffectedbythedroughtwouldbe65inches.Find
thez–scoreforatreethatis65inchestall.
A) z=0.84 B) z=0.98 C) z=0.77 D) z=0.98
5) Atelevisionstationclaimsthattheamountofadvertisingperhourofbroadcasttimehasanaverageof16
minutesandastandarddeviationequalto1.4minutes.Youwatchthestationfor1hour,atarandomly
selectedtime,andcarefullyobservethattheamountofadvertisingtimeisequalto8minutes.Calculatethe
z–scoreforthisamountofadvertisingtime.
A) z=–5.71 B) z=5.71 C) z= –0.41 D) z=0.41
SHORTANSWER.Writethewordorphrasethatbestcompleteseachstatementoranswersthequestion.
6) Astudywasdesignedtoinvestigatetheeffectsoftwovariables–(1)astudentʹslevelofmathematicalanxiety
and(2)teachingmethod–onastudentʹsachievementinamathematicscourse.Studentswhohadalowlevel
ofmathematicalanxietyweretaughtusingthetraditionalexpositorymethod.Thesestudentsobtainedamean
scoreof360andastandarddeviationof50onastandardizedtest.Findandinterpretthez–scoreofastudent
whoscored380onthestandardizedtest.
7) Solarenergyisconsideredbymanytobetheenergyofthefuture.Arecentsurveywastakentocomparethe
costofsolarenergytothecostofgasorelectricenergy.Resultsofthesurveyrevealedthatthedistributionof
theamountofthemonthlyutilitybillofa3–bedroomhouseusinggasorelectricenergyhadameanof$119
andastandarddeviationof$14.Assumingthedistributionismound–shapedandsymmetric,wouldyou
expecttoseea3–bedroomhouseusinggasorelectricenergywithamonthlyutilitybillof$203.00?Explain.
MULTIPLECHOICE.Choosetheonealternativethatbestcompletesthestatementoranswersthequestion.
8) Findthez–scoreforthevalue96
,
whenthemeanis92 andthestandarddeviationis3.
A) z=1.33 B) z=1.00 C) z= –1.01 D) z=1.01
9) Ahighlyselectiveboardingschoolwillonlyadmitstudentswhoplaceatleast1.5z–scoresabovethemeanona
standardizedtestthathasameanof110andastandarddeviationof12.Whatistheminimumscorethatan
applicantmustmakeonthetesttobeaccepted?
A) 128 B) 92 C) 122 D) 98
10) Apharmaceuticaltestingcompanywantstotestanewcholesteroldrug.Theaveragecholesterolofthetarget
populationis200mgandtheyhaveastandarddeviationof25mg.Thecompanywishedtotestasampleof
peoplewhofallbetween1.5and3z–scoresabovethemean.Intowhatrangemustacandidateʹscholesterol
levelbeinorderforthecandidatetobeincludedinthestudy?
A) 237.5–275 B) 225–237.5 C) 125–162.5 D) 162.5–275
Page70

2 Interpretpercentiles.
MULTIPLECHOICE.Choosetheonealternativethatbestcompletesthestatementoranswersthequestion.
Provideanappropriateresponse.
1) Whenresultsfromascholasticassessmenttestaresenttotest–takers,thepercentilesassociatedwiththeir
scoresarealsogiven.Supposeatest–takerscoredatthe99thpercentilefortheirverbalgradeandatthe36th
percentilefortheirquantitativegrade.Interprettheseresults.
A) Thisstudentperformedbetterthan99%oftheothertest–takersintheverbalpartandbetterthan36% in
thequantitativepart.
B) Thisstudentperformedbetterthan99%oftheothertest–takersintheverbalpartandbetterthan64%in
thequantitativepart.
C) Thisstudentperformedbetterthan1%oftheothertest–takersintheverbalpartandbetterthan64%in
thequantitativepart.
D) Thisstudentperformedbetterthan1%oftheothertest–takersintheverbalpartandbetterthan36% in
thequantitativepart.
2) Thepercentageofmeasurementsthatareabovethe39thpercentileis
A) 61% B) 39% C) 71% D) cannotdetermine
3) Thepercentageofmeasurementsthatarebelowthe88thpercentileis
A) 88% B) 12% C) 22% D) cannotdetermine
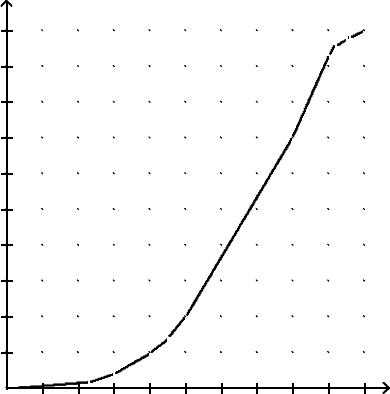
Usetheogivetosolvetheproblem.
4) Thegraphbelowisanogiveofscoresonamathtest.Theverticalaxisinanogiveisthecumulativerelative
frequencyandcanalsobeinterpretedasapercentile.
PercentileRanksofMathTestScores
10 20 30 40 50 60 70 80 90 100
100
90
80
70
60
50
40
30
20
10
Test Score
Percentile
10 20 30 40 50 60 70 80 90 100
100
90
80
70
60
50
40
30
20
10
Test Score
Percentile
Usethegraphtoapproximatethepercentilerankofanindividualwhosetestscoreis60.
A) 37 B) 70 C) 42 D) 65
Page71
5) Thegraphbelowisanogiveofscoresonamathtest.Theverticalaxisinanogiveisthecumulativerelative
frequencyandcanalsobeinterpretedasapercentile.
PercentileRanksofMathTestScores
10 20 30 40 50 60 70 80 90 100
100
90
80
70
60
50
40
30
20
10
Test Score
Percentile
10 20 30 40 50 60 70 80 90 100
100
90
80
70
60
50
40
30
20
10
Test Score
Percentile
Usethegraphtoapproximatethetestscorethatcorrespondstothe40thpercentile?
A) 62 B) 10 C) 56 D) 15
3 Determineandinterpretquartiles.Checkasetofdataforoutliers.
MULTIPLECHOICE.Choosetheonealternativethatbestcompletesthestatementoranswersthequestion.
Provideanappropriateresponse.
1) Thecommutetimes(inminutes)of30employeesarelistedbelow.FindQ3.
31 41 45 48 52 55 56 56 63 65
67 67 69 70 70 74 75 78 79 79
80 81 83 85 85 87 90 92 95 99
A) 83min B) 56min C) 72 min D) 82min
2) Theonewaydistancesfromwork(inmiles)of30employeesarelistedbelow.FindQ3.
25 25 26 26.5 27 27 27.5 28 28 28.5
29 29 30 30 30.5 31 31 32 32.5 32.5
33 33 34 34.5 35 35 37 37 38 38
A) 34mi B) 28mi C) 30.75 mi D) 35mi
3) Healthcareissuesarereceivingmuchattentioninbothacademicandpoliticalarenas.Asociologistrecently
conductedasurveyofcitizensover60yearsofagewhosenetworthistoohightoqualifyforgovernment
healthcarebutwhohavenoprivatehealthinsurance.Theagesof25uninsuredseniorcitizenswereasfollows:
68 73 66 76 86 74 61 89 65 90 69 92 76
62 81 63 68 81 70 73 60 87 75 64 82
FindQ1ofthedata.
A) 65.5 B) 81.5 C) 64.5 D) 66.5
Page72
4) Healthcareissuesarereceivingmuchattentioninbothacademicandpoliticalarenas.Asociologistrecently
conductedasurveyofseniorcitizenswhosenetworthistoohightoqualifyforgovernmenthealthcarebut
whohavenoprivatehealthinsurance.Theagesof25uninsuredseniorcitizenswereasfollows:
71 76 69 79 89 77
64 92 68 93 72 95
79 65 84 66 71 84
73 76 63 90 78 67 85
FindQ1ofthedata.
A) 68.5 B) 68 C) 69 D) 76.5
5) Agroupof79studentswereaskedhowfartheycommutetoworkfromhomeeachtimetheygotoworkfrom
home.Theresultsaregivenbelow.Determinethefirstquartile.
Miles
traveled
Frequency
1 1
2 2
3 12
4 18
5 7
6 10
7 10
8 11
9 5
10 3
A) 4mi B) 3mi C) 5mi D) 6mi
SHORTANSWER.Writethewordorphrasethatbestcompleteseachstatementoranswersthequestion.
6) Theonewaydistancesfromwork(inmiles)of30employeesarelistedbelow.Findtheinterquartilerangeof
the30distanceslistedbelow.
25 25 26 26.5 27 27 27.5 28 28 28.5
29 29 30 30 30.5 31 31 32 32.5 32.5
33 33 34 34.5 35 35 37 37 38 38
MULTIPLECHOICE.Choosetheonealternativethatbestcompletesthestatementoranswersthequestion.
7) Themonthlytelephoneusage(inminutes)of30adultsislistedbelow.Findtheinterquartilerangeforthe
telephoneusageofthe30adults.
154 156 165 165 170 171 172 180 184 185
189 189 190 192 195 198 198 200 200 200
205 205 211 215 220 220 225 238 255 265
A) 31 B) 30 C) 32 D) 29
8) Thefollowingdataaretheyields,inbushels,ofhayfromafarmerʹslast10years:
375,210,150,147,429,189,320,580,407,180.
FindtheIQR.
A) 227 B) 265 C) 253 D) 279
Page73
SHORTANSWER.Writethewordorphrasethatbestcompleteseachstatementoranswersthequestion.
9) Tostudythephysicalfitnessofasampleof28people,thedatabelowwerecollectedrepresentingthenumber
ofsit–upsthatapersoncoulddoinoneminute.
10 12 12 15 15 15 18
20 22 25 25 26 29 30
32 33 40 40 40 45 46
47 48 48 50 52 53 56
Determinethelowerandupperfences.Arethereanyoutliersaccordingtothiscriterion?
10) Thesellingpricesofmutualfundschangedaily.Inordertostudythesechanges,asampleofmutualfundswas
examinedandthedailychangesinpricearelistedbelow.
0.05,0.00,–0.03,–0.01,0.18,0.00,0.02,0.29,0.00,–0.07,0.10,0.07,0.03
Determinethelowerandupperfences.Arethereanyoutliersaccordingtothiscriterion?
MULTIPLECHOICE.Choosetheonealternativethatbestcompletesthestatementoranswersthequestion.
11) Agroupof79studentswereaskedhowfartheycommutetoworkfromhomeeachtimetheygotoworkfrom
home.Theresultsaregivenbelow.Wouldadriveof15milesbeconsideredanoutlier?AnswerYesorNo.
Miles
traveled
Frequency
1 1
2 2
3 12
4 18
5 7
6 10
7 10
8 11
9 5
10 3
A) Yes B) No
SHORTANSWER.Writethewordorphrasethatbestcompleteseachstatementoranswersthequestion.
12) Thenormalmonthlyprecipitation(ininches)forAugustislistedfor20differentU.S.cities.Findanyoutliers
andprovideanexplanationforthem.
0.4 1.0 1.5 1.6 2.0
2.2 2.4 2.7 3.4 3.4
3.5 3.6 3.6 3.7 3.7
3.9 4.1 4.2 4.2 7.0
Page74
3.5 TheFive–NumberSummaryandBoxplots
1 Computethefive–numbersummary.
MULTIPLECHOICE.Choosetheonealternativethatbestcompletesthestatementoranswersthequestion.
Provideanappropriateresponse.
1) Giventhefollowingfive–numbersummary,findtheinterquartilerange.
29, 37, 50, 66, 94
A) 29 B) 50 C) 65 D) 32.5
2) Giventhefollowingfive–numbersummary,findQ3.
2.9, 5.7, 10.0, 13.2, 21.1.
A) 13.2 B) 5.7 C) 10.0 D) 21.1
3) Giventhefollowingfive–numbersummary,findtheIQR.
2.9, 5.7, 10.0, 13.2, 21.1.
A) 7.5 B) 7.1 C) 11.1 D) 18.2
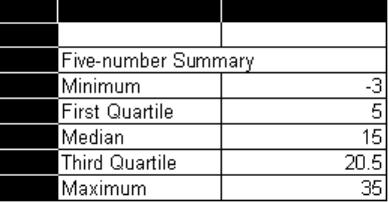
4) AnExcelprintoutofsomedescriptivestatisticsforasetofdataisshownbelow.WhatistheIQR?
A) 15.5 B) 15 C) 38 D) 5.5
SHORTANSWER.Writethewordorphrasethatbestcompleteseachstatementoranswersthequestion.
5) Thefollowingisasampleof19Novemberutilitybills(indollars)fromaneighborhood:
52,62,66,68,72,74,74,76,76,76,78,78,82,84,84,86,88,92,96.Findthefive –numbersummary.
6) Elevenhighschoolteacherswereaskedtogivethenumbersofstudentsintheirclasses.Thesampledata
follows:36,31,30,31,20,19,24,34,21,28,24.Findthefive –numbersummary.
MULTIPLECHOICE.Choosetheonealternativethatbestcompletesthestatementoranswersthequestion.
7) Thefollowingisasampleof19Novemberutilitybills(indollars)fromaneighborhood.Whatisthelargestbill
inthesamplethatwouldnotbeconsideredanoutlier?
52,62,66,68,72,74,76,76,76,78,78,82,84,84,86,88,92,96,110
A) $96 B) $95 C) $88 D) $86
8) Elevenhighschoolteacherswereaskedtogivethenumberofstudentsintheirclasses.Thesampledata
follows.Wouldanyoftheclasssizesbeconsideredanoutlier?AnswerYesorNo.
36,31,30,31,20,19,24,34,21,28,24
A) No B) Yes
Page75
9) Arandomsampleofsalepricesofhomesyieldedthefollowingsummaryinformation:
MIN$41,000 25%:$82,000 Median:$124,000
MAX$276,000 75%:$169,000
Commentonahomethathadasalepriceof$429,000.
A) Thisvaluefallsoutsidetheupperfenceandisconsideredanoutlier.
B) Thissalepricewouldbeexpectedsinceitfallsinsidethelowerandupperfences.
C) Thissalepricefallsbetweenthelowerandupperfences.Itcanbeconsideredapotentialoutlier.
D) Thisvaluefallsoutsideofthethirdquartile,butcannotbeconsideredanoutlier.
2 Drawandinterpretboxplots.
MULTIPLECHOICE.Choosetheonealternativethatbestcompletesthestatementoranswersthequestion.
Provideanappropriateresponse.
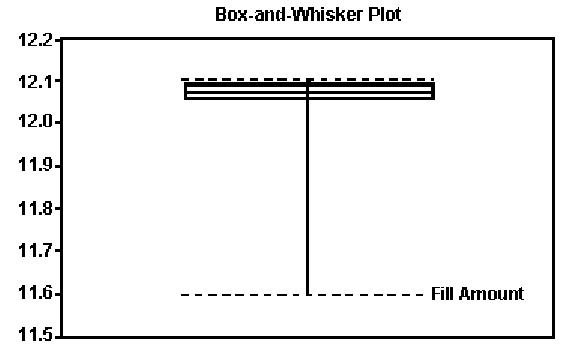
1) TheboxplotshownbelowwasconstructedinExcelfortheamountofsodathatwaspouredbyafilling
machineinto12–ouncesodacansatalocalbottlingcompany.
Basedontheinformationgivenintheboxplotbelow,whatshapedoyoubelievethedatatohave?
A) skewedtotheleft B) approximatelysymmetric
C) skewedtotheright D) cannotbedetermined
SHORTANSWER.Writethewordorphrasethatbestcompleteseachstatementoranswersthequestion.
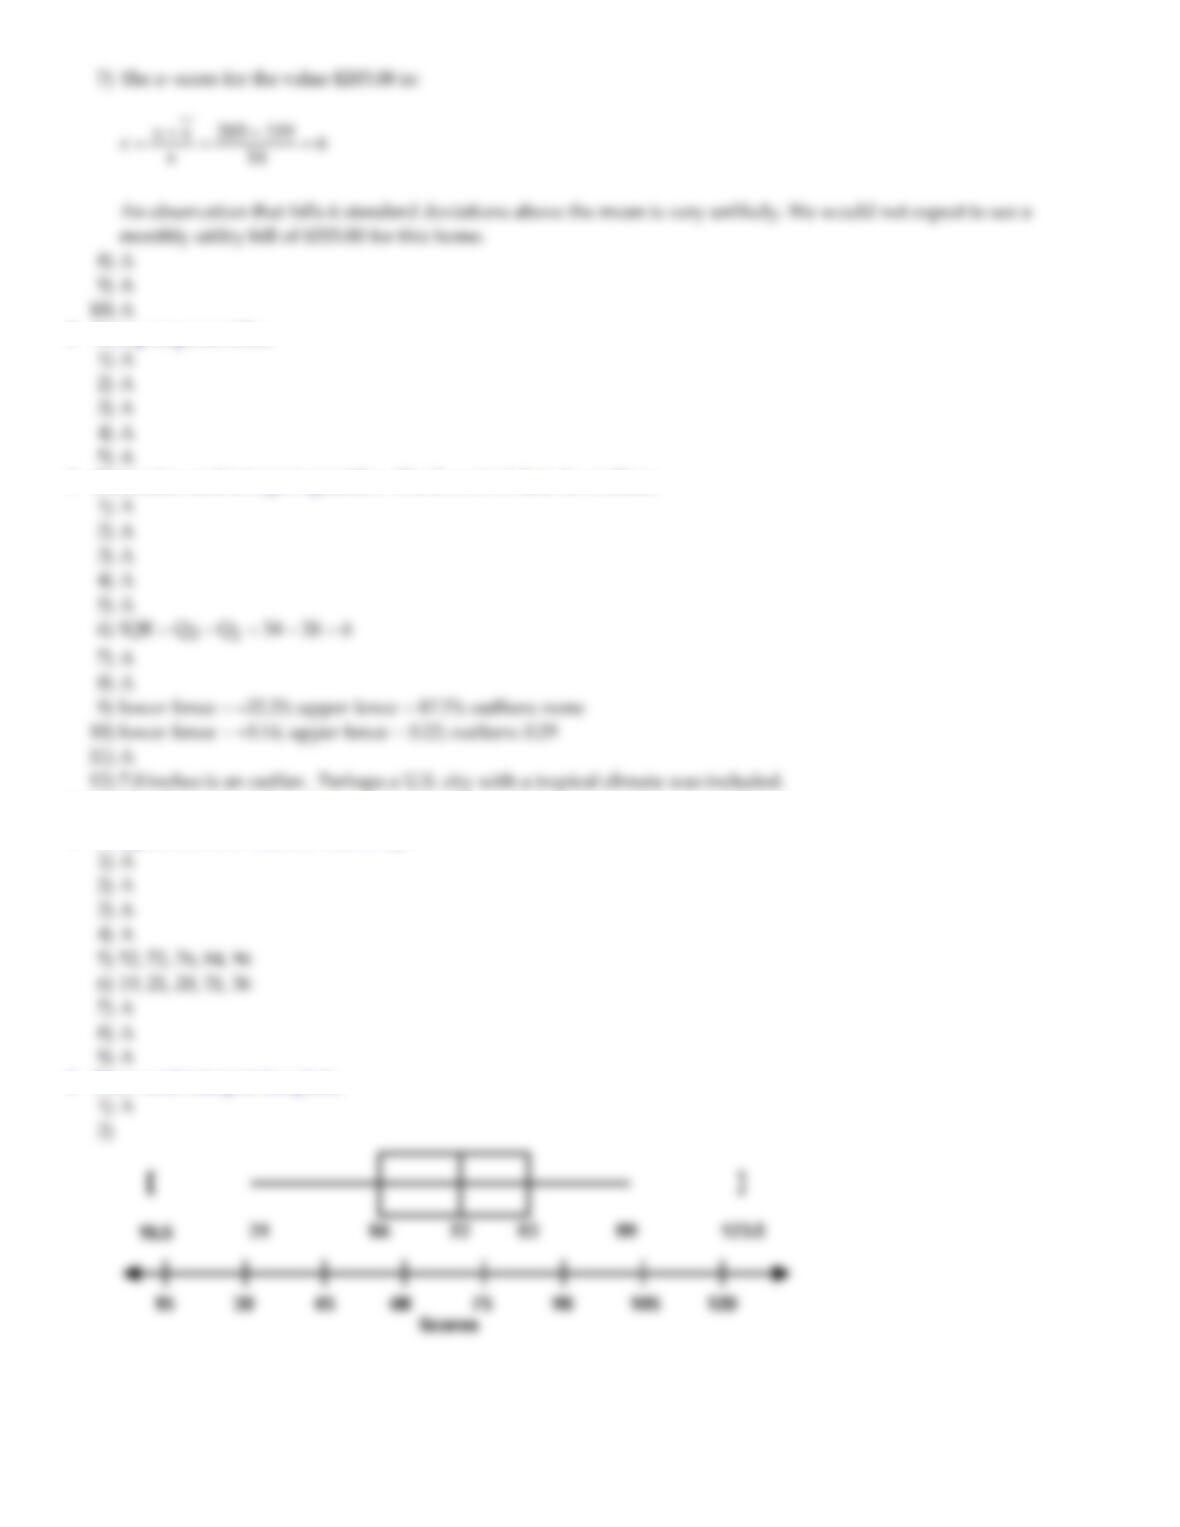
2) Thetestscoresof30studentsarelistedbelow.Drawaboxplotthatrepresentsthedata.
31 41 45 48 52 55 56 56 63 65
67 67 69 70 70 74 75 78 79 79
80 81 83 85 85 87 90 92 95 99
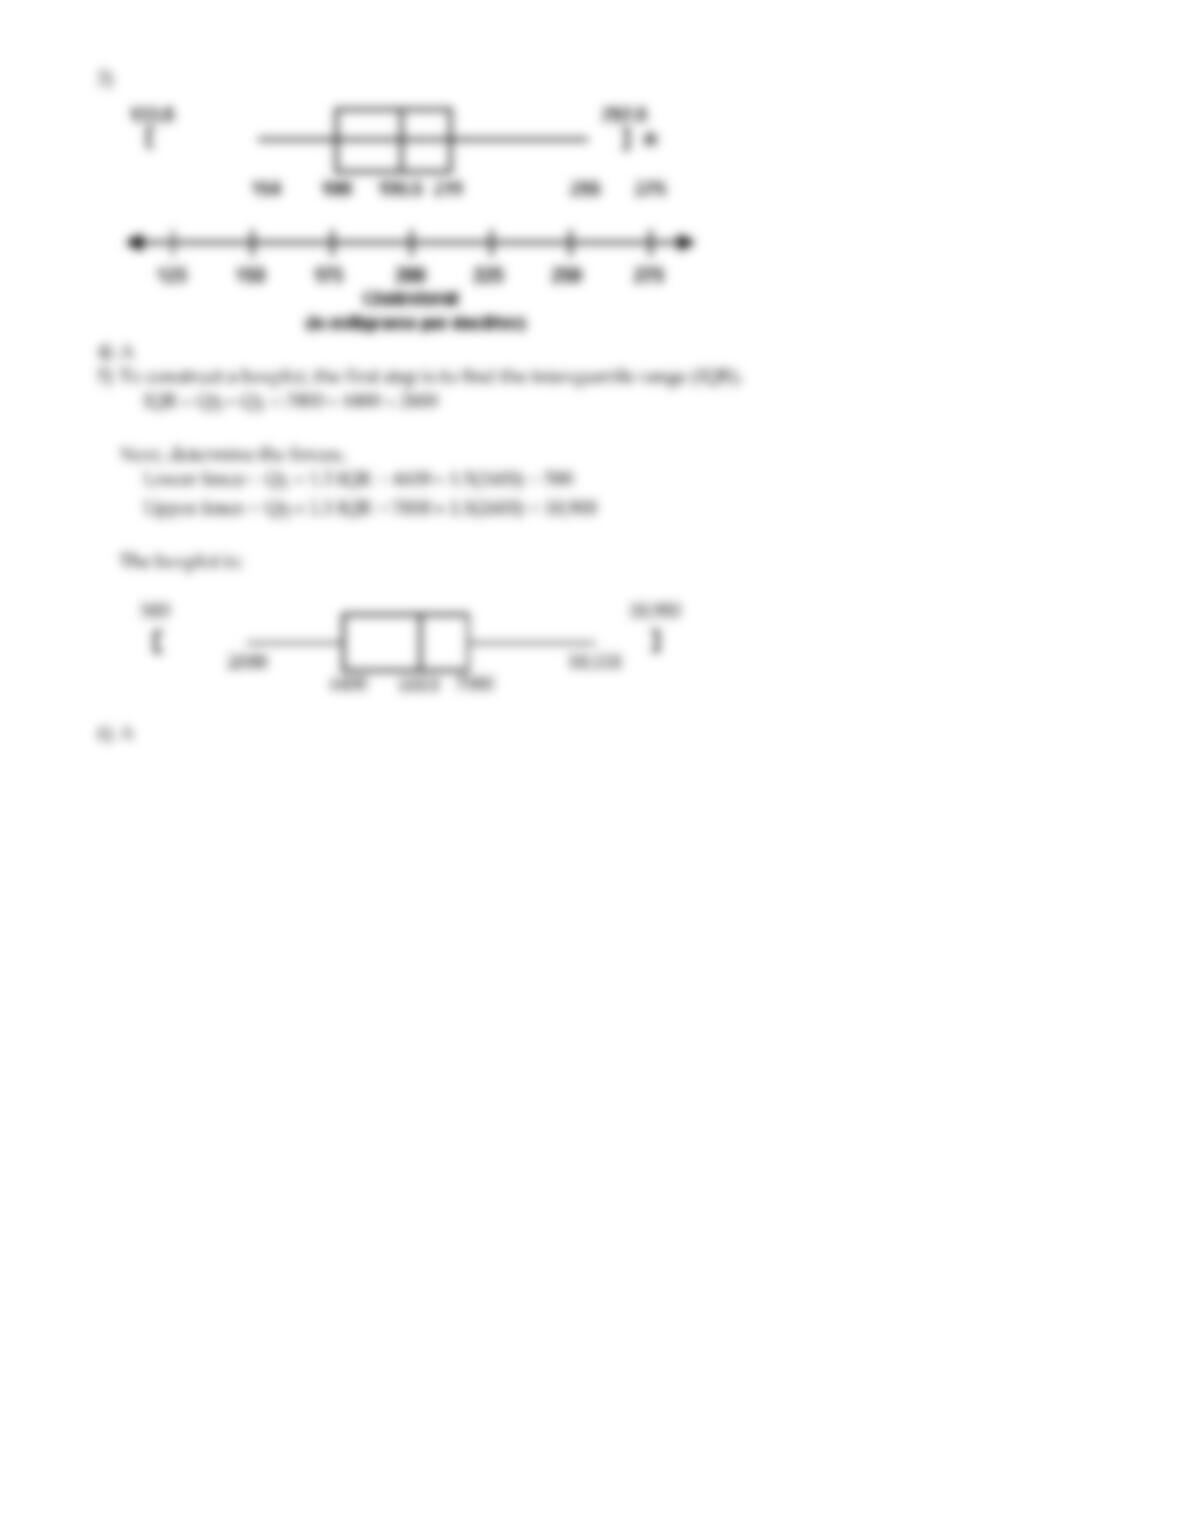
3) Thecholesterollevels(inmilligramsperdeciliter)of30adultsarelistedbelow.Drawaboxplotthatrepresents
thedata.
154 156 165 165 170 171 172 180 184 185
189 189 190 192 195 198 198 200 200 200
205 205 211 215 220 220 225 238 255 275
Page76
MULTIPLECHOICE.Choosetheonealternativethatbestcompletesthestatementoranswersthequestion.
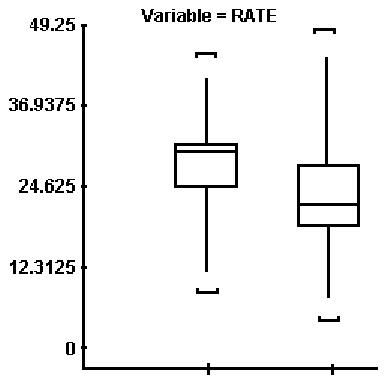
4) SASwasusedtocomparethehighschooldropoutratesforthe30schooldistrictsinonecityin2010and2012.
Theboxplotsgeneratedforthesedropoutratesareshownbelow.
Comparethecenterofthedistributionsandthevariationofthedistributionsforthetwoyears.
YEAR 2010 2012
A) Dropoutrateshadahigheraveragewithlessvariabilityin2010thanin2012.
B) Dropoutrateshadahigheraveragewithmorevariabilityin2010thanin2012.
C) Dropoutrateshadaloweraveragewithmorevariabilityin2010thanin2012.
D) Dropoutrateshadaloweraveragewithlessvariabilityin2010thanin2012.
SHORTANSWER.Writethewordorphrasethatbestcompleteseachstatementoranswersthequestion.
5) Asurveyof200publicuniversitiesindicatedthatthe25thpercentileoftheyearlytuitioncostoftheuniversities
was$4400andthe75thpercentilewas$7000.Theminimumvaluewas$2000,themedianwas$6000,andthe
maximumwas$10,000.Usethisinformationtoconstructaboxplotfortheyearlytuitioncosts.
MULTIPLECHOICE.Choosetheonealternativethatbestcompletesthestatementoranswersthequestion.
6) Ininterpretingaboxplotofadatasetwenotethatthemedianistotheleftofthecenteroftheboxandtheright
lineislongerthantheleftline.Wecanconcludethat
A) Thedataisskewedright.
B) Thedataisskewedleft.
C) Thedataissymmetric.
D) Skewnessorsymmetrycannotbedeterminedbyaboxplot.
Page77
Ch.3 NumericallySummarizingData
AnswerKey
3.1 MeasuresofCentralTendency
1 Determinethearithmeticmean,median,andmodeofavariablefromrawdata.
2 Explainwhatitmeansforastatistictoberesistant.
Page78
3.2 MeasuresofDispersion
1 Determinetherange,standarddeviation,andvarianceofavariablefromrawdata.
2 UsetheEmpiricalRuletodescribedatathatarebellshaped.
Page79
3 UseChebyshevʹsinequalitytodescribeanysetofdata.
3.3 MeasuresofCentralTendencyandDispersionfromGroupedData
1 Approximatethemeanandstandarddeviationofavariablefromgroupeddata.
2 Computetheweightedmean.
3.4 MeasuresofPositionandOutliers
1 Determineandinterpretz–scores.
Page80
2 Interpretpercentiles.
3 Determineandinterpretquartiles.Checkasetofdataforoutliers.
3.5 TheFive–NumberSummaryandBoxplots
1 Computethefive–numbersummary.
2 Drawandinterpretboxplots.
Page81
Page82