
Ch.2 OrganizingandSummarizingData
2.1 OrganizingQualitativeData
1 Organizequalitativedataintables.
SHORTANSWER.Writethewordorphrasethatbestcompleteseachstatementoranswersthequestion.
Provideanappropriateresponse.Roundrelativefrequenciestothousandths.
1) ScottTarnowskiownsapetgroomingshop.Hispricesforgroomingdogsarebasedonthesizeofthedog.His
recordsfromlastyeararesummarizedbelow.Constructafrequencydistributionandarelativefrequency
distribution.Showthepercentagerepresentedbyeachrelativefrequency.
Class Frequency
Large 345
Medium 830
Small 645
2) Theresultsofasurveyaboutarecentjudicialappointmentaregiveninthetablebelow.Constructarelative
frequencydistribution.
Response Frequency
StronglyFavor 25
Favor 26
Neutral 8
Oppose 22
StronglyOppose 119
3) ThepreschoolchildrenatElmwoodElementarySchoolwereaskedtonametheirfavoritecolor.Theresultsare
listedbelow.Constructafrequencydistributionandarelativefrequencydistribution.
yellow yellow blue purple red
red red yellow red blue
red blue purple purple purple
blue red purple red green
MULTIPLECHOICE.Choosetheonealternativethatbestcompletesthestatementoranswersthequestion.
4) TrueorFalse:Thesumofalltherelativefrequenciesofadistributionwillalwaysaddupto1.
A) False B) True
5) TrueorFalse:Relativefrequencyistheproportion(orpercent)ofobservationswithinacategoryandisfound
usingtheformula:relativefrequency=sumofallfrequencies
frequency .
A) False B) True
Page21
2 Constructbargraphs.
MULTIPLECHOICE.Choosetheonealternativethatbestcompletesthestatementoranswersthequestion.
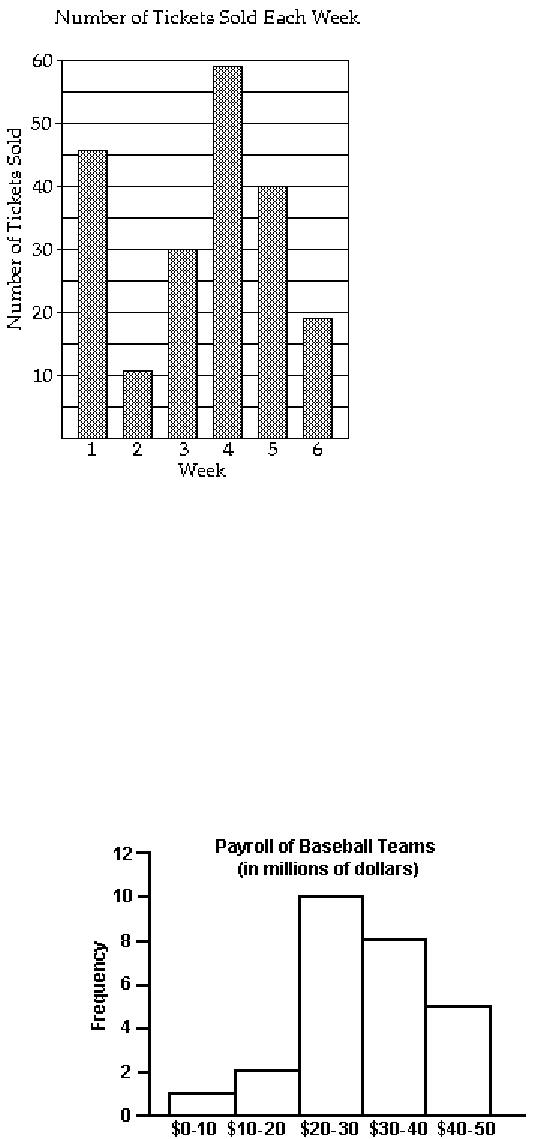
Thebargraphshowsthenumberofticketssoldeachweekbythegardenclubfortheirannualflowershow.
1) Duringwhichweekwasthemostnumberofticketssold?
A) week4 B) week5 C) week2 D) week1
2) Duringwhichweekwasthefewestnumberofticketssold?
A) week2 B) week4 C) week6 D) week5
3) Approximatelyhowmanyticketsweresoldduringweek5?
A) 40tickets B) 19tickets C) 46 tickets D) 11tickets
Provideanappropriateresponse.
4) Thepayrollamountsfor26major–leaguebaseballteamsareshownbelow.Aprroximatelywhatpercentageof
thepayrollswereinthe$30–$40millionrange?Roundtothenearestwholepercent.
A) 31% B) 8% C) 42% D) 19%
Page22
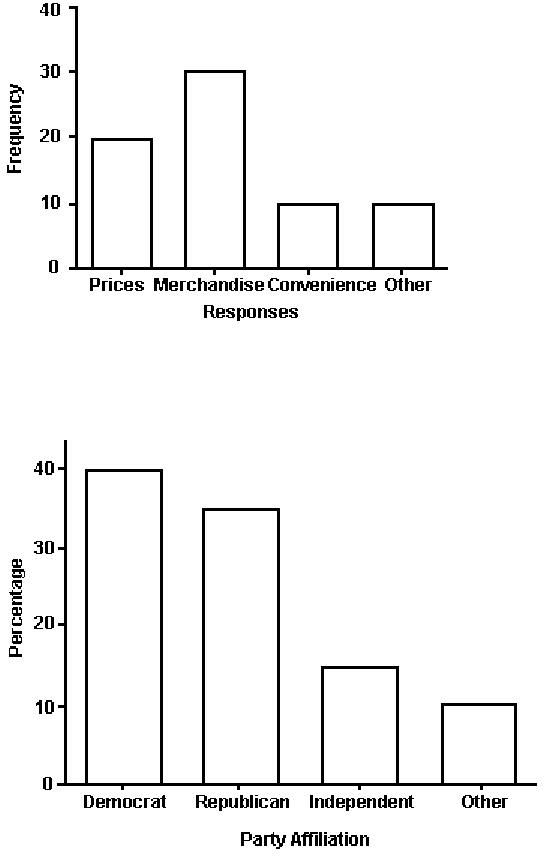
5) Retailersarealwaysinterestedindeterminingwhyacustomerselectedtheirstoretomakeapurchase.A
sportinggoodsretailerconductedacustomersurveytodeterminewhyitscustomersshoppedatthestore.The
resultsareshownbelow.Whatpercentageofthecustomersrespondedthatthemerchandisewasthereason
theyshoppedatthestore?Roundtothenearestwholepercent
A) 43% B) 30% C) 50% D) 29%
6) Thebargraphbelowshowsthepoliticalpartyaffiliationof1000registeredU.S.voters.Whatpercentageofthe
1000registeredU.S.votersbelongedtooneofthetraditionaltwoparties(DemocraticandRepublican)?
A) 75% B) 40% C) 35% D) 25%
Page23
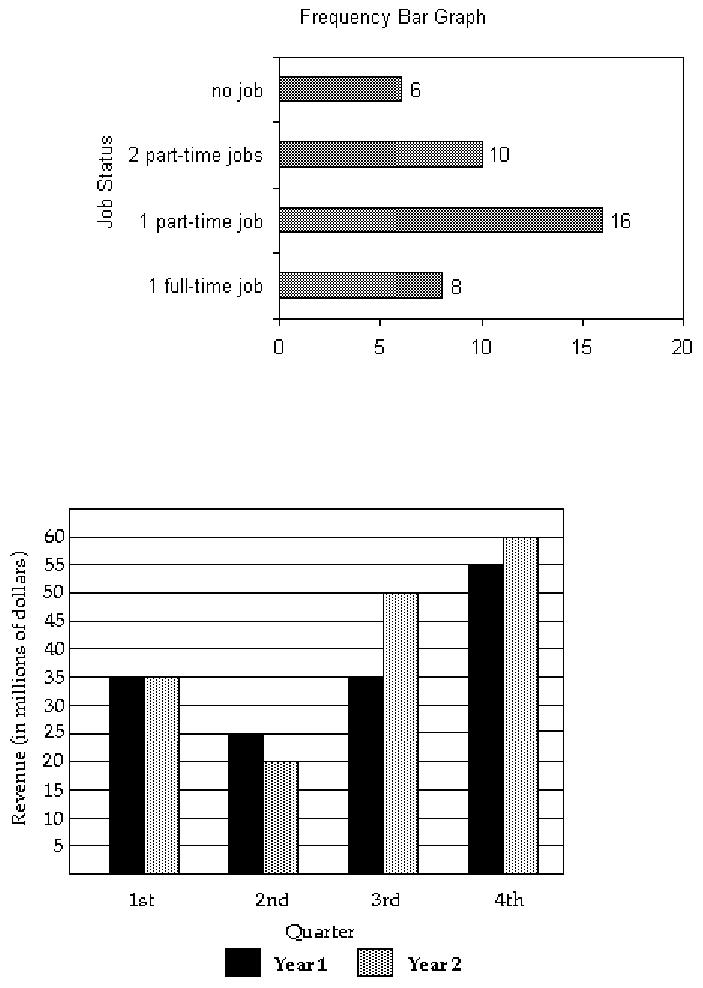
7) TheExcelfrequencybargraphbelowdescribestheemploymentstatusofarandomsampleofU.S.adults.
Whatisthepercentageofthosehavingnojob?
A) 15% B) 20% C) 40% D) cannotdetermine
Thefollowingdouble–bargraphillustratestherevenueforacompanyforthefourquartersoftheyearfortwodifferent
years.Usethegraphtoanswerthequestion.
8) InwhatquarterwastherevenuethegreatestforYear2?
A) fourthquarter B) firstquarter C) secondquarter D) thirdquarter
9) InwhatquarterwastherevenuetheleastforYear2?
A) secondquarter B) firstquarter C) fourthquarter D) thirdquarter
10) WhatwastherevenueforthefirstquarterofYear1?
A) $35million B) $7million C) $20 million D) $4million
Page24

SHORTANSWER.Writethewordorphrasethatbestcompleteseachstatementoranswersthequestion.
Provideanappropriateresponse.
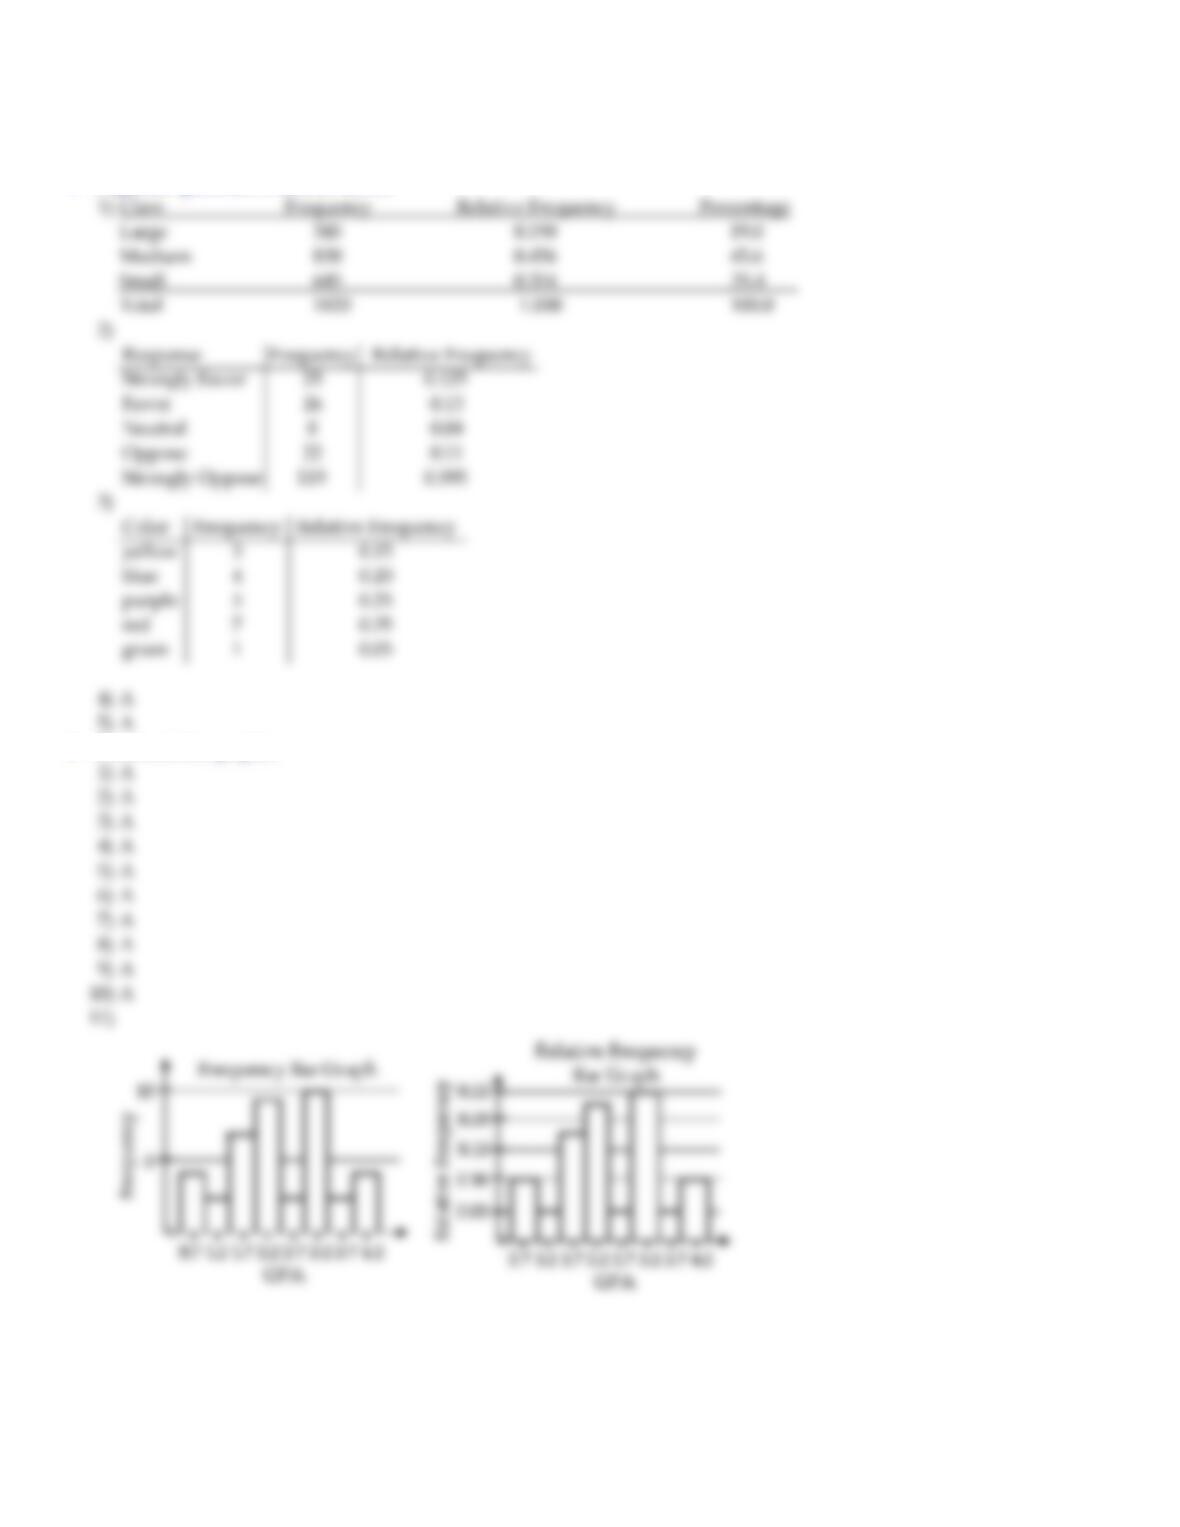
11) Thegradepointaveragesfor40eveningstudentsarelistedbelow.Constructafrequencybargraphanda
relativefrequencybargraph.
GradePointAverage Frequency
0.5–0.9 4
1.0–1.4 2
1.5–1.9 7
2.0–2.4 9
2.5–2.9 2
3.0–3.4 10
3.5–3.9 2
4.0–4.4 4
12) Thelocalpolice,usingradar,checkedthespeeds(inmph)of30motoristsinaconstructionarea.Theresultsare
listedbelow.Constructafrequencybargraphandarelativefrequencybargraph.
Speed Frequency
33–35 3
36–38 6
39–41 6
42–44 6
45–47 3
48–50 6
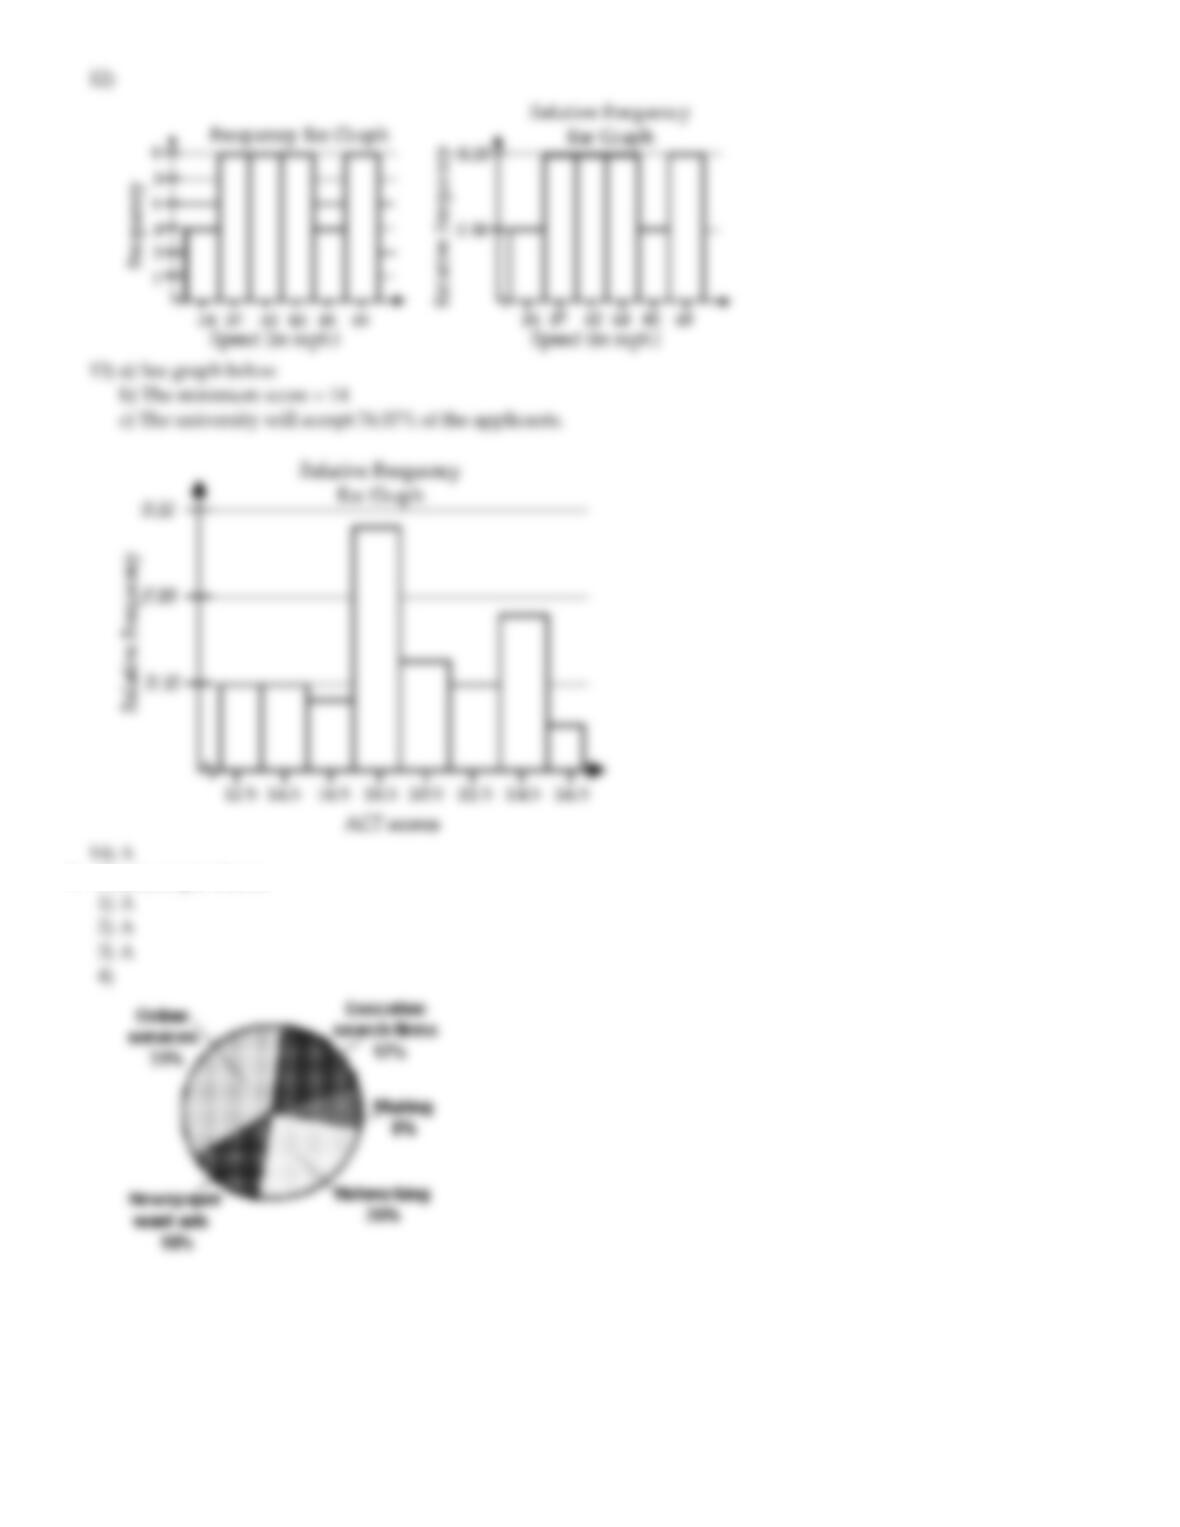
13) ListedbelowaretheACTscoresof40randomlyselectedstudentsatamajoruniversity.
18 22 13 15 24 24 20 19 19 12
16 25 14 19 21 23 25 18 18 13
26 26 25 25 19 17 18 15 13 21
19 19 14 24 20 21 23 22 19 17
a)Constructarelativefrequencybargraphofthedata,usingeightclasses.
b)Iftheuniversitywantstoacceptthetop90%oftheapplicants,whatshouldtheminimumscorebe?
c)Iftheuniversitysetstheminimumscoreat17,whatpercentoftheapplicantswillbeaccepted?
Page25
MULTIPLECHOICE.Choosetheonealternativethatbestcompletesthestatementoranswersthequestion.
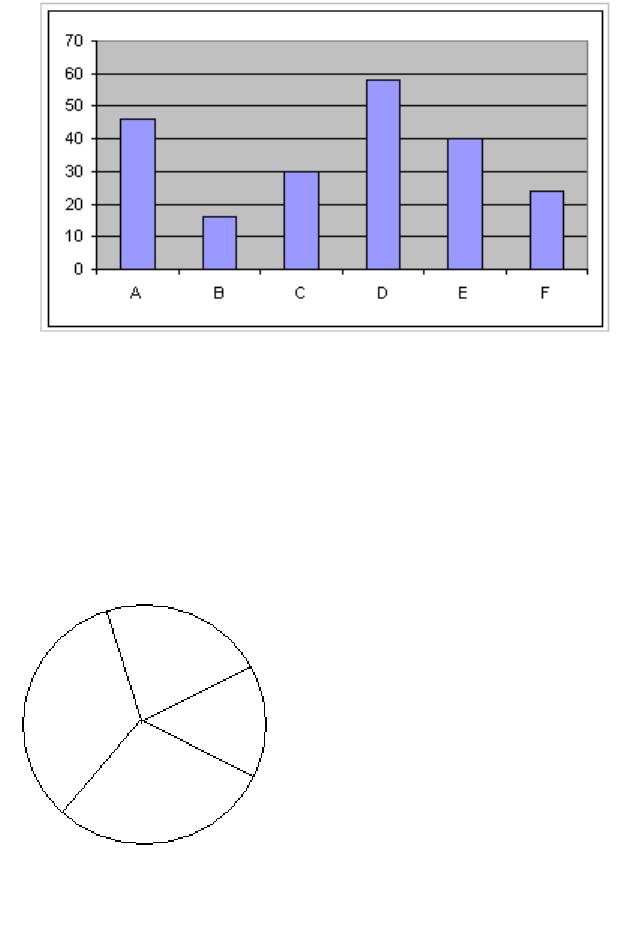
14) Giventhebargraphshownbelow,theParetochartthatwouldbestrepresentthedatashouldhavethebarsin
thefollowingorder.
A) DAECFBB)BFCEADC)CADEFBD)BFEDAC
3 Constructpiecharts.
MULTIPLECHOICE.Choosetheonealternativethatbestcompletesthestatementoranswersthequestion.
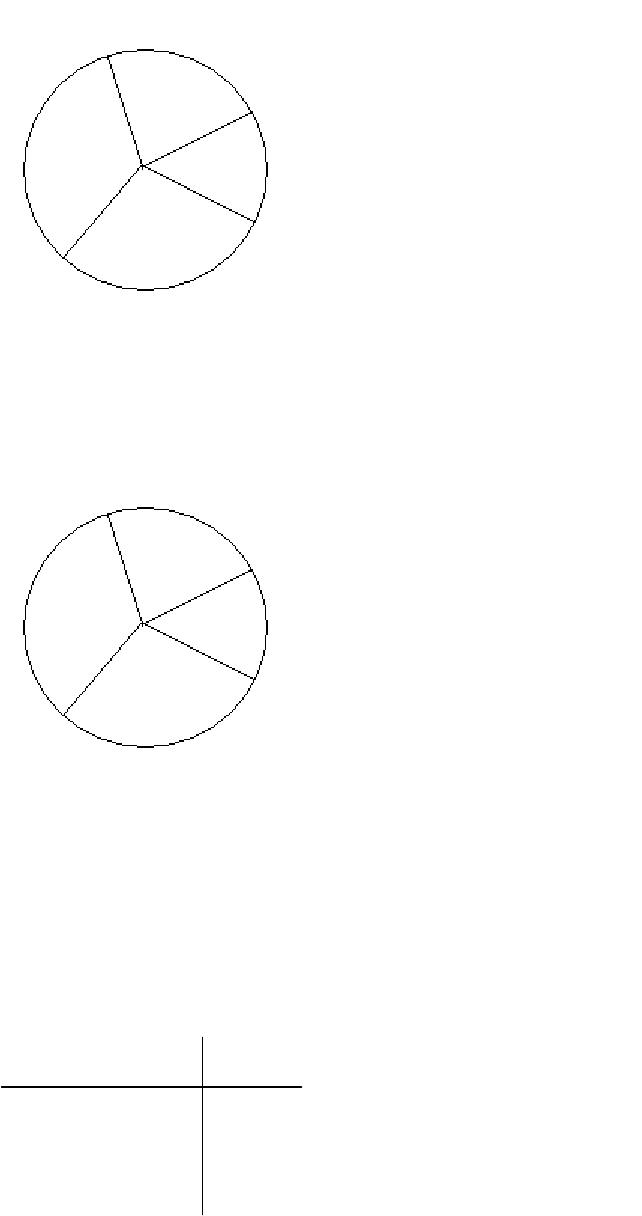
Thepiechartshowsthepercentageofvotesreceivedbyeachcandidateinthestudentcouncilpresidentialelection.Use
thepiecharttoanswerthequestion.
1)
StudentCouncilPresident
Ming
20%
Jim
35% Ann
15%
Matt
30%
700totalvotes
Whogotthemostvotes?
A)
J
im B) Matt C) Ming D) Ann
Page26
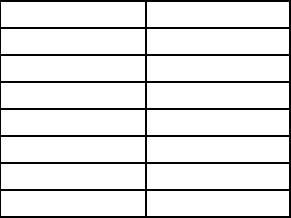
2)
StudentCouncilPresident
Matt
20%
Ted
34% Ann
14%
Ben
32%
400totalvotes
Whogotthefewestvotes?
A) Ann B) Ben C) Matt D) Ted
3)
StudentCouncilPresident
Ann
22%
Matt
35% Jim
17%
Ben
26%
300totalvotes
WhatpercentofthevotesdidJimandAnnreceivetogether?
A) 39% B) 61% C) 17% D) 22%
SHORTANSWER.Writethewordorphrasethatbestcompleteseachstatementoranswersthequestion.
Constructapiechartforthedata.Labeleachcategorywithitspercentage.
4) Astudywasconductedtodeterminehowpeoplegetjobs.Fourhundredsubjectswererandomlyselectedand
theresultsarelistedbelow.Roundpercentstowholenumbers.
JobSourcesof
SurveyRespondents Frequency
Newspaperwantads 72
Onlineservices 124
Executivesearchfirms 69
Mailings 32
Networking 103
Page27

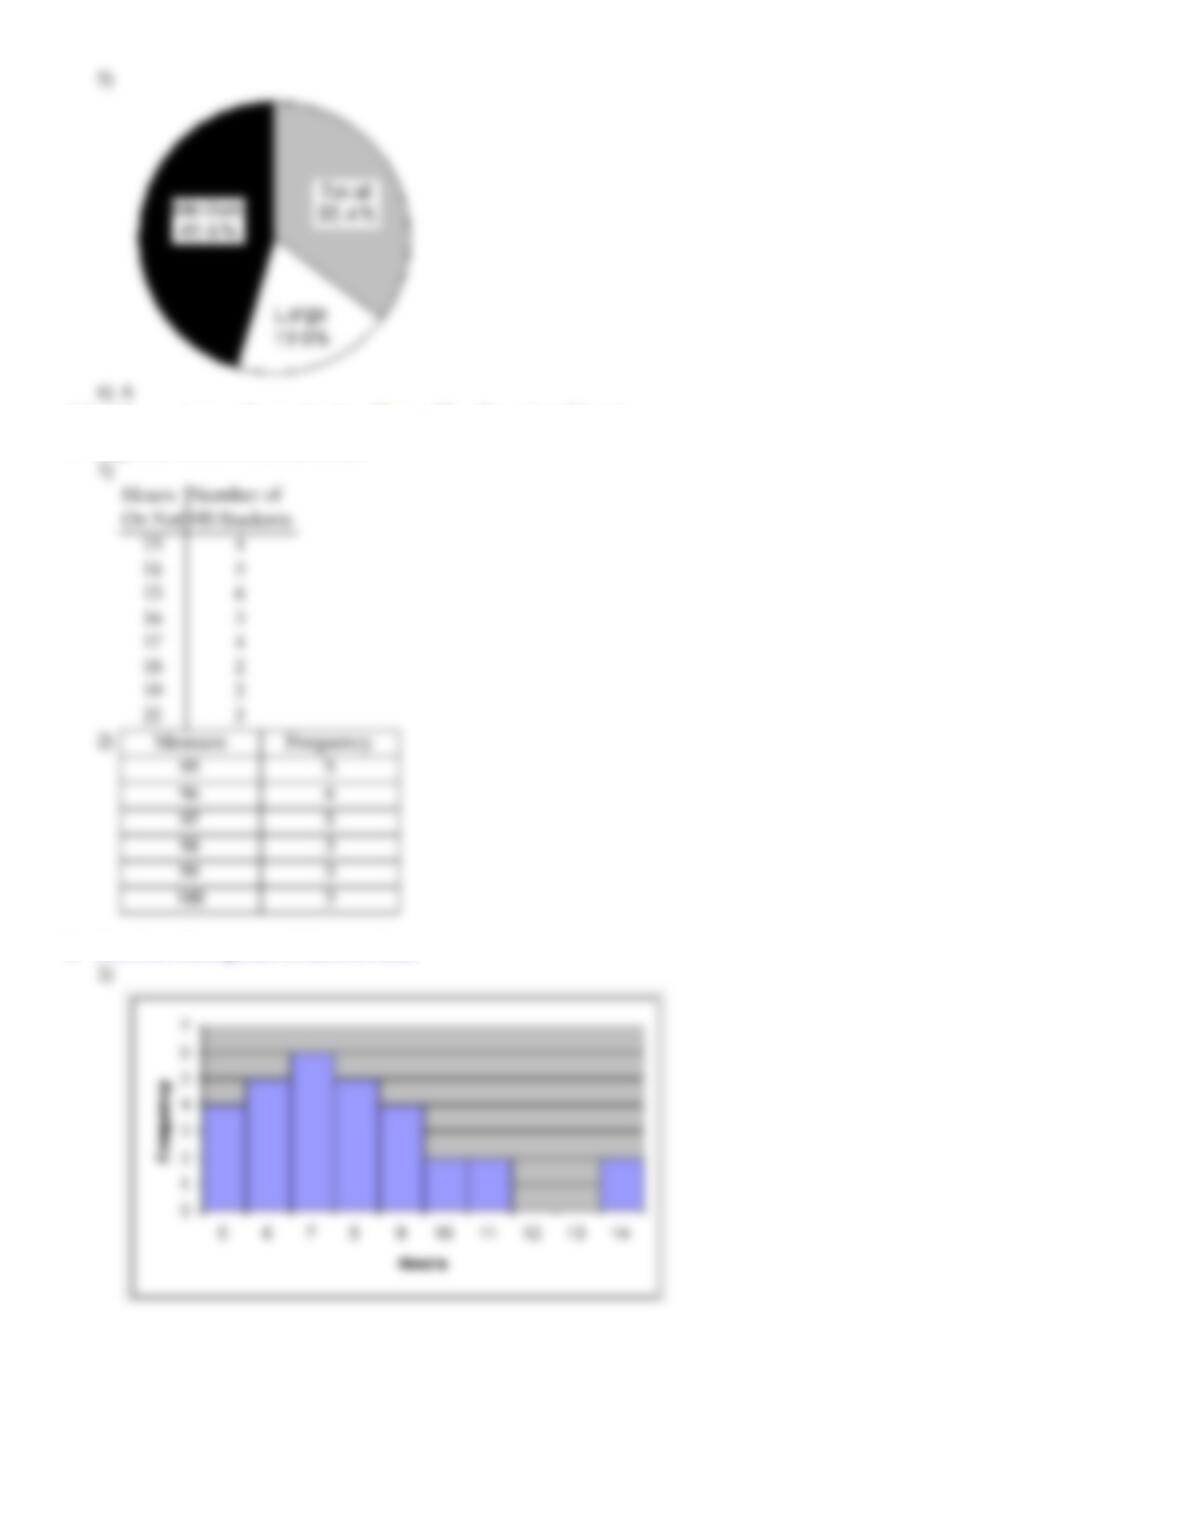
5) ScottTarnowskiownsapetgroomingshop.Hispricesforgroomingdogsarebasedonthesizeofthedog.His
recordsfromlastyeararesummarizedbelow.Roundpercentstowholenumbers.
Class Frequency
Large 345
Medium 830
Small 645
MULTIPLECHOICE.Choosetheonealternativethatbestcompletesthestatementoranswersthequestion.
Provideanappropriateresponse.
6) Atwo–poundbagofassortedcandycontained100caramels,83mintpatties,93chocolatesquares,80nut
clusters,and79peanutbuttertaffypieces.Tocreateapiechartofthisdata,theanglefortheslicerepresenting
eachcandytypemustbecomputed.Whatisthedegreemeasureoftheslicerepresentingthemintpatties
roundedtothenearestdegree?
A) 69° B) 19° C) 5° D) 52°
2.2 OrganizingQuantitativeData:ThePopularDisplays
1 Organizediscretedataintables.
SHORTANSWER.Writethewordorphrasethatbestcompleteseachstatementoranswersthequestion.
Constructafrequencydistributionforthedata.
1) Arandomsampleof30highschoolstudentsisselected.Eachstudentisaskedhowmuchtimeheorshespent
ontheInternetduringthepreviousweek.Thefollowingtimes(inhours)areobtained:
14221619161416151319
17151514171613131815
13152217141814171615
Constructafrequencydistributionforthedata.
2) Asampleof25serviceprojectscoresistakenandisrecordedbelow.Constructafrequencydistributionforthis
data.
9796969596
99979710099
95989596100
95989696100
9597999798
2 Constructhistogramsofdiscretedata.
SHORTANSWER.Writethewordorphrasethatbestcompleteseachstatementoranswersthequestion.
Constructthespecifiedhistogram.
1) Arandomsampleof30highschoolstudentsisselected.Eachstudentisaskedhowmuchtimeheorshespent
ontheInternetduringthepreviousweek.Thefollowingtimes(inhours)arerecorded:
6148118687511
97769855107
571496106987
Constructafrequencyhistogramforthisdata.
Page28

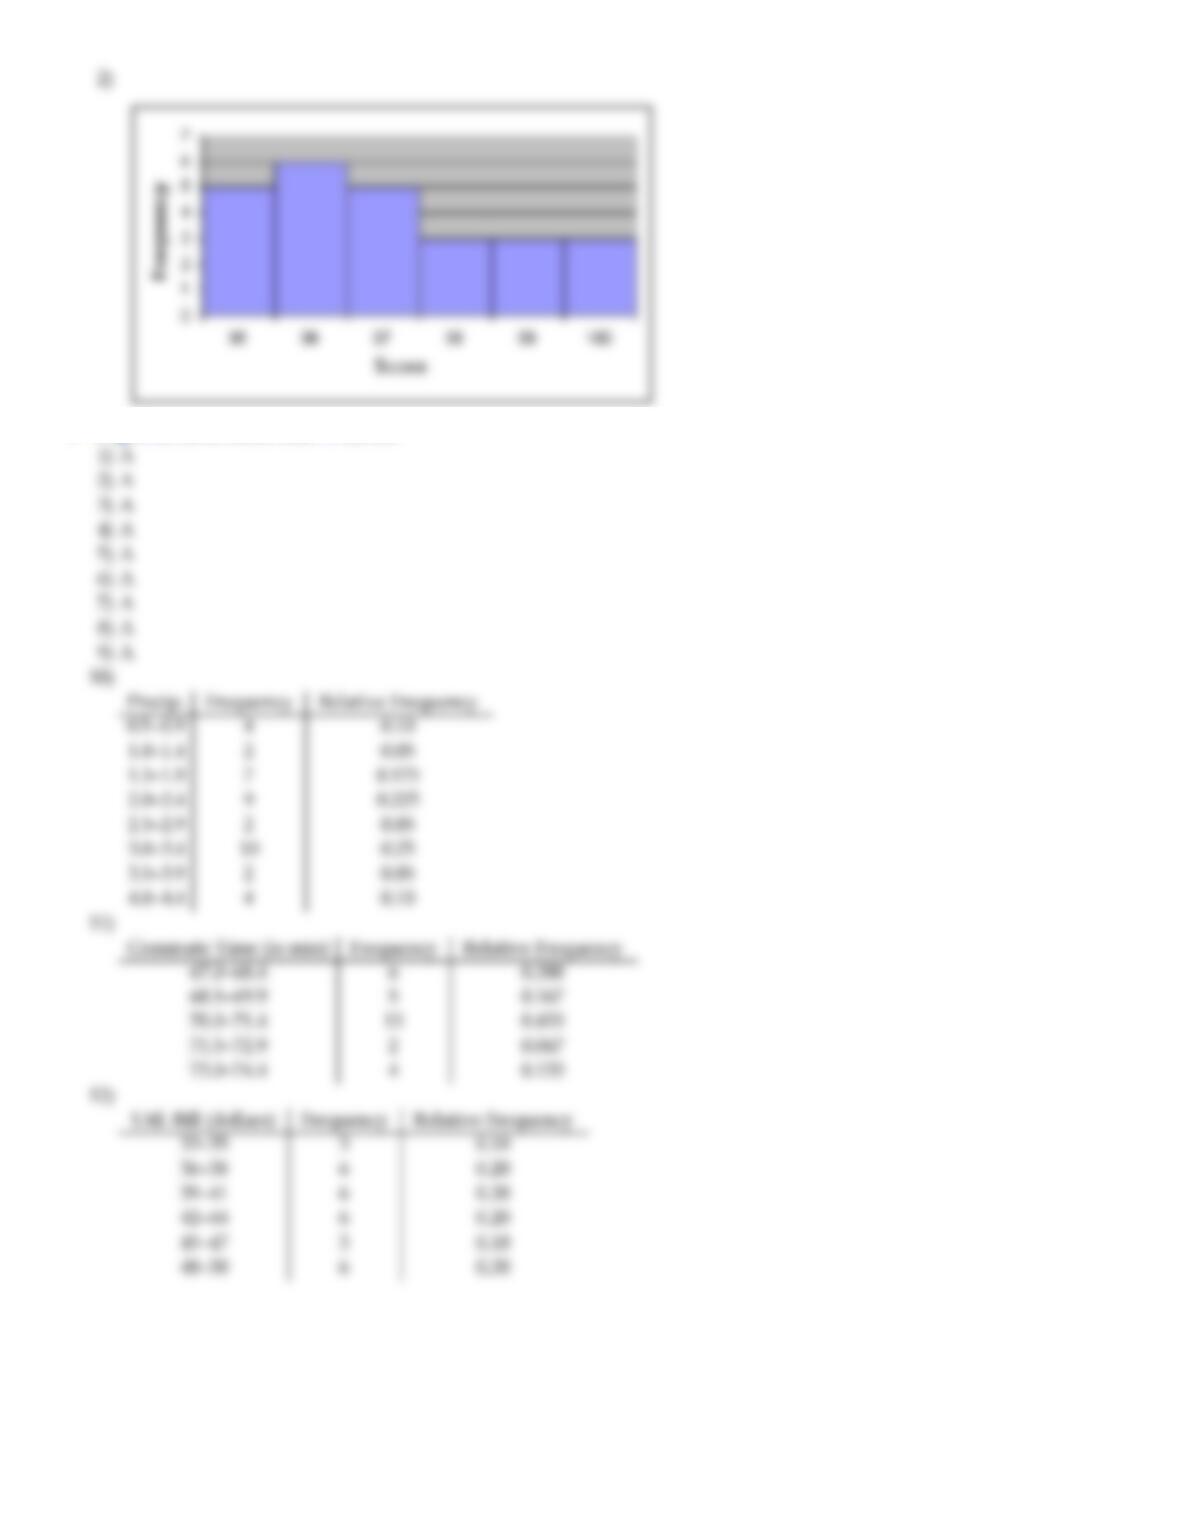
2) Asampleof25communityserviceprojectsisobtainedandthescoresarerecorded.Theresultsareshown
below.Constructafrequencyhistogramforthisdata.
9796969596
99979710099
95989596100
95989696100
9597999798
3 Organizecontinuousdataintables.
MULTIPLECHOICE.Choosetheonealternativethatbestcompletesthestatementoranswersthequestion.
Provideanappropriateresponse.
1) Theclasswidthisthedifferencebetween
A) Twosuccessivelowerclasslimits
B) Thehighandthelowdatavalues
C) Theupperclasslimitandthelowerclasslimitofaclass
D) Thelargestfrequencyandthesmallestfrequency
2) Determinethenumberofclassesinthefrequencytablebelow.
Class Frequency
38–39 7
40–41 2
42–43 6
44–45 4
46–47 1
A) 5 B) 6 C) 20 D) 2
3) Findtheclasswidthforthefrequencytablebelow.
Class Frequency
31–32 3
33–34 1
35–36 3
37–38 6
39–40 2
A) 2 B) 1 C) 1.5 D) 2.5
4) Usethefollowingfrequencydistributiontodeterminetheclasslimitsofthethirdclass.
Class Frequency
9–11 7
12–14 11
15–17 8
18–20 5
21–23 9
24–26 6
A) lowerlimit:15;upperlimit:17 B) lowerlimit:14.5;upperlimit:17.5
C) lowerlimit:15;upperlimit:18 D) lowerlimit:14;upperlimit:18
Page29

5) AresearcherrecordsthenumberofemployeesofeachoftheITcompaniesinthetownofWestmoore.The
resultsaresummarizedinthetable.
NumberofEmployees NumberofITCompanies
0–749 30
750–1499 24
1500–2249 6
2250–2999 5
3000–3749 5
Findtheclasswidth.
A) 750 B) 3749 C) 749.5 D) 5
6) AresearcherrecordsthenumberofemployeesofeachoftheITcompaniesinthetownofWestmoore.The
resultsaresummarizedinthetable.
NumberofEmployees NumberofITCompanies
0–399 36
400–799 22
800–1199 9
1200–1599 6
1600–1999 7
Findtheclasslimitsofthethirdclass.
A) lowerlimit:800;upperlimit:1199 B) lowerlimit:800;upperlimit:1200
C) lowerlimit:799.5;upperlimit:1199.5 D) lowerlimit:799;upperlimit:1200
7) Theweights(inpounds)ofbabiesbornatStMaryʹshospitallastmontharesummarizedinthetable.
Weight(lb) NumberofBabies
5.0–5.8 7
5.9–6.7 18
6.8–7.6 20
7.7–8.5 10
8.6–9.4 5
Findtheclasswidth.
A) 0.9lb B) 0.8lb C) 0.95 lb D) 0.85 lb
8) Theweights(inpounds)ofbabiesbornatStMaryʹshospitallastmontharesummarizedinthetable.
Weight(lb) NumberofBabies
5.0–65
6.1–7.1 19
7.2–8.2 20
8.3–9.3 9
9.4–10.4 4
Findtheclasslimitsforthesecondclass.
A) lowerlimit:6.1;upperlimit:7.1 B) lowerlimit:6.1;upperlimit:7.2
C) lowerlimit:6.05;upperlimit:7.15 D) lowerlimit:6;upperlimit:7.2
Page30
9) Thetablebelowsummarizestheweightsofthealmonds(ingrams)inaone–poundbag.Whatistheclass
width?
Weight(g) Frequency
0.7585–0.8184 1
0.8185–0.8784 1
0.8785–0.9384 1
0.9385–0.9984 3
0.9985–1.0584 157
1.0585–1.1184 171
1.1185–1.1784 8
A) 0.06 B) 0.059 C) 0.408 D) 0.4
SHORTANSWER.Writethewordorphrasethatbestcompleteseachstatementoranswersthequestion.
Constructtherequestedfrequencydistribution.
10) TheJuneprecipitationamounts(ininches)for40citesarelistedbelow.Constructafrequencydistributionand
arelativefrequencydistributionusingeightclasses.
2.0 3.2 1.8 2.9 0.9 4.0 3.3 2.9 3.6 0.8
3.1 2.4 2.4 2.3 1.6 1.6 4.0 3.1 3.2 1.8
2.2 2.2 1.7 0.5 3.6 3.4 1.9 2.0 3.0 1.1
3.0 4.0 4.0 2.1 1.9 1.1 0.5 3.2 3.0 2.2
11) Thecommutetimes(inminutes)of30executivesarelistedbelow.Constructafrequencydistributionanda
relativefrequencydistributionusingfiveclasses.Roundrelativefrequencyvaluestothreedecimalplaces.
70 72 71 70 69 73 69 68 70 71
67 71 70 74 69 68 71 71 71 72
69 71 68 67 73 74 70 71 69 68
12) TheMarchutilitybills(indollars)of30homeownersarelistedbelow.Constructafrequencydistributionanda
relativefrequencydistributionusingsixclasses.
44 38 41 50 36 36 43 42 49 48
35 40 37 41 43 50 45 45 39 38
50 41 47 36 35 40 42 43 48 33
Provideanappropriateresponse.
13) Asampleof15BoyScoutswasselectedandtheirweights(inpounds)wererecordedasfollows:
97 120 137 124 117
108 134 126 123 106
130 110 100 120 140
a.Usingaclasswidthof10,givetheupperandlowerlimitsforfiveclasses,startingwithalowerlimitof95for
thefirstclass.
b.Constructafrequencydistributionforthedata
Page31
4 Constructhistogramsofcontinuousdata.
SHORTANSWER.Writethewordorphrasethatbestcompleteseachstatementoranswersthequestion.
Constructthespecifiedhistogram.
1) Forthedatabelow,constructafrequencydistributionandarelativefrequencydistribution.
Height(ininches) Frequency
50–52 5
53–55 8
56–58 12
59–61 13
62–64 11
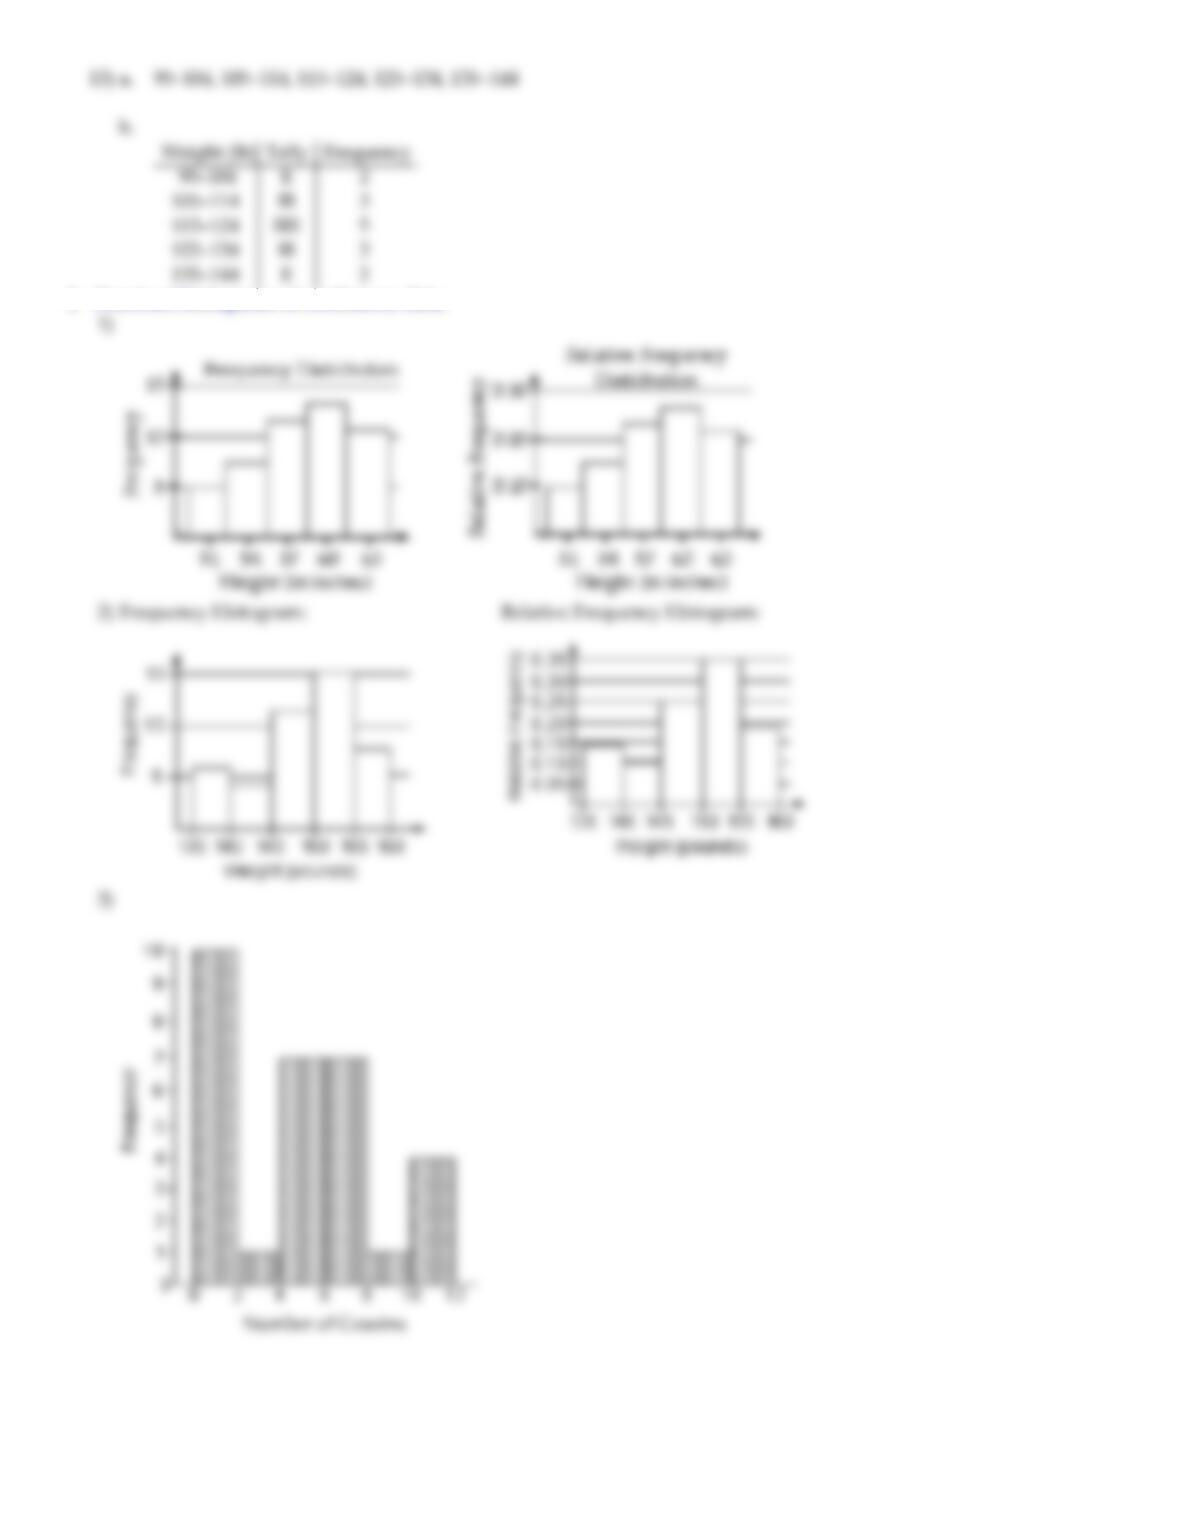
2) Forthedatabelow,constructafrequencyhistogramandarelativefrequencyhistogram.
Weight(inpounds) Frequency
135–139 6
140–144 4
145–149 11
150–154 15
155–159 8
3) The30studentsinMrsHarrisonʹsliteratureclasswereaskedhowmanycousinstheyhad.Theresultsare
shownbelow.Createafrequencyhistogramforthedatausingaclasswidthof2.
1013547
5109111
5417711
066157
1011560
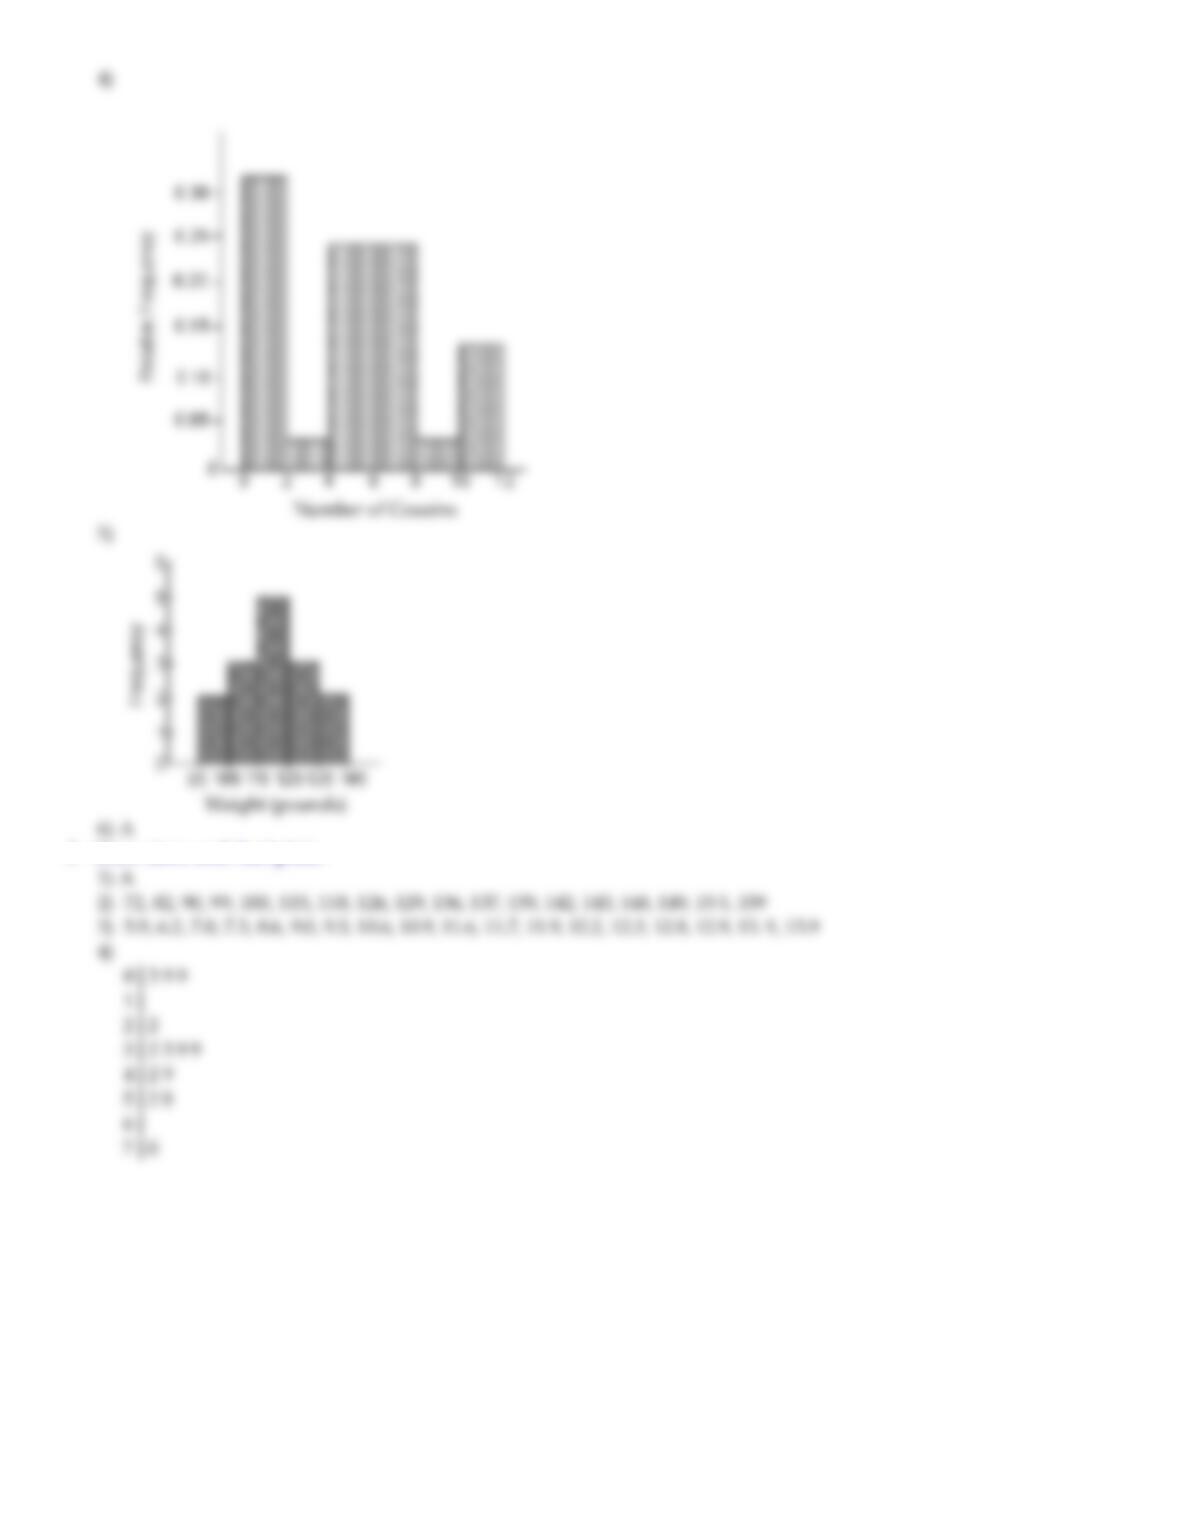
4) The30studentsinMrsHarrisonʹsliteratureclasswereaskedhowmanycousinstheyhad.Theresultsare
shownbelow.Constructarelative–frequencyhistogramusingaclasswidthof2.
1013547
5109111
5417711
066157
1011560
5) Asampleof15GirlScoutswasselectedandtheirweights(inpounds)wererecorded.Theresultsarelisted
below.Constructafrequencyhistogramforthedatausingaclasswidthof10andusing95asthelowerlimit
ofthefirstclass.
97 120 137 124 117
108 134 126 123 106
130 110 100 120 140
MULTIPLECHOICE.Choosetheonealternativethatbestcompletesthestatementoranswersthequestion.
Provideanappropriateresponse.
6) Whatisthedifferencebetweenabarchartandahistogram?
A) Thebarsonabarchartdonottouchwhilethebarsofahistogramdotouch.
B) Thebarsinabarchartmaybeofvariouswidthswhilethebarsofahistogramareallthesamewidth.
C) Thebarsinabarchartareallthesamewidthwhilethebarsofahistogrammaybeofvariouswidths.
D) Thereisnodifferencebetweenthesetwographicaldisplays.
Page32
5 Drawstem–and–leafplots.
MULTIPLECHOICE.Choosetheonealternativethatbestcompletesthestatementoranswersthequestion.
Provideanappropriateresponse.
1) Forthestem–and–leafplotbelow,whatarethemaximumandminimumentries?
105
1666789
20112344566
277788999
3011234455
366678899
409
A) max:49;min:10 B) max:38;min:7 C) max:47;min:15 D) max:40;min:10
SHORTANSWER.Writethewordorphrasethatbestcompleteseachstatementoranswersthequestion.
Determinetheoriginalsetofdata.
2)
Stem Leaves
72
82
909
10 0
11 58
12 69
13 679
14 2389
15 59
Legend:5 2represents52
3)
Stem Leaves
59
62
705
86
903
10 69
11 679
12 2389
13 99
Legend:5 9represents5.9
Constructastem–and–leafplotforthedata.
4) ThenumberofhomerunsthatMarkMcGwirehitinthefirst13yearsofhismajorleaguebaseballcareerare
listedbelow.(Source:MajorLeagueHandbook)Constructastem–and–leafplotforthisdata.
349 32 33 39 22 42 9939 52 58 70
Page33
5) ThenumbersofrunsbattedinbyMarkMcLemoreinthefirst13yearsofhismajorleaguebaseballcareerare
listedbelow.(Source:MajorLeagueHandbook)Constructastem–and–leafplotforthisdata.
0102 56 25 9956 165 88 122 150 91 114
6) Theheights(ininches)of30mechanicsarelistedbelow.Constructastem –and–leafplotforthedata.
70 72 71 70 69 73 69 68 70 71
67 71 70 74 69 68 71 71 71 72
69 71 68 67 73 74 70 71 69 68
7) TheMarchutilitybills(indollars)of30homeownersarelistedbelow.Constructastem–and–leafplotforthe
data.
44 38 41 50 36 36 43 42 49 48
35 40 37 41 43 50 45 45 39 38
50 41 47 36 35 40 42 43 48 33
8) Thescoresforaneconomicstestarelistedbelow.Createastem–and–leafplotforthedata.
87 76 95 77 94 90 88 85 66 89
79 99 50 91 83 88 82 56 19 69
6 Drawdotplots.
SHORTANSWER.Writethewordorphrasethatbestcompleteseachstatementoranswersthequestion.
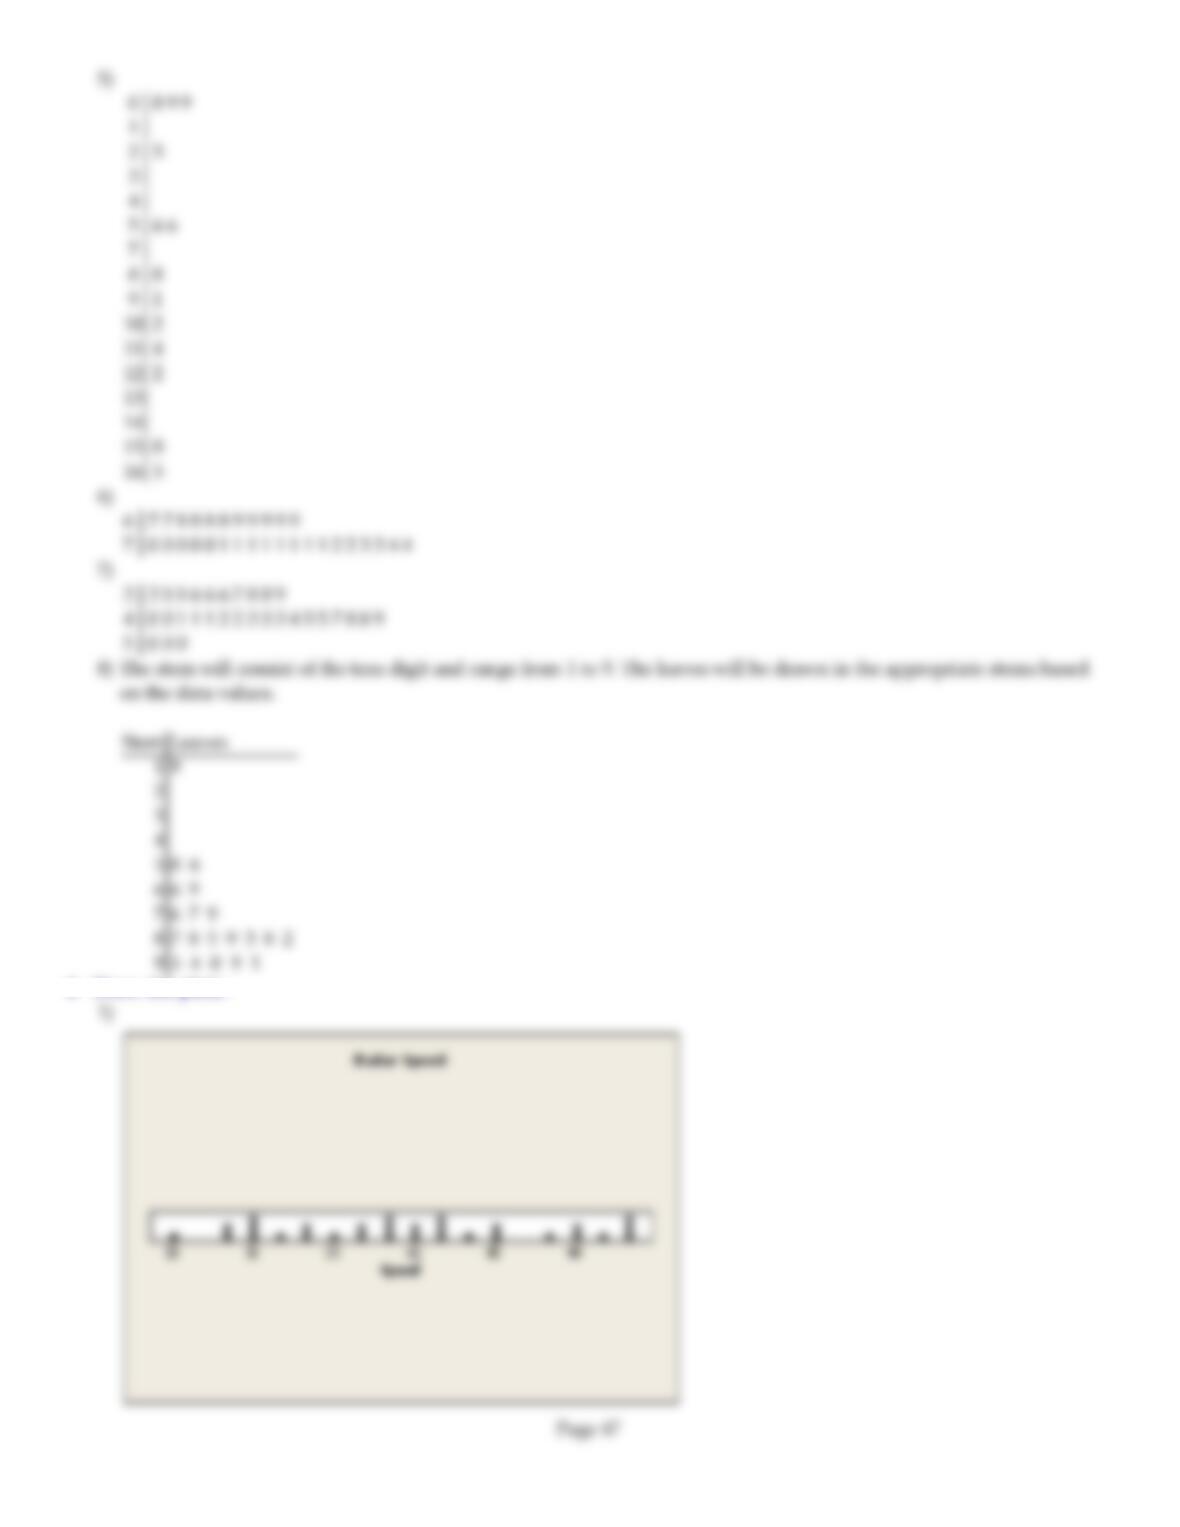
Constructadotplotforthedata.
1) Thelocalpolice,usingradar,checkedthespeeds(inmph)of30motoristsatabusyintersection.Theresultsare
listedbelow.Constructadotplotforthedata.
44 38 41 50 36 36 43 42 49 48
35 40 37 41 43 50 45 45 39 38
50 41 47 36 35 40 42 43 48 33
2) Theheights(ininches)of30mechanicsarelistedbelow.Constructadotplotforthedata.
70 72 71 70 69 73 69 68 70 71
67 71 70 74 69 68 71 71 71 72
69 71 68 67 73 74 70 71 69 68
7 Identifytheshapeofadistribution.
MULTIPLECHOICE.Choosetheonealternativethatbestcompletesthestatementoranswersthequestion.
Constructafrequencydistributionforthedatausingfiveclasses.Describetheshapeofthedistribution.
1) Thedataset:PickThreeLotteryOutcomesfor10ConsecutiveWeeks
3676061784
1575915399
2230884024
A) uniform B)
b
ellshaped
C) skewedtotheleft D) skewedtotheright
2) Thedataset:agesofdishwashers(inyears)in20randomlyselectedhouseholds
12 64911 17898
913 515 768821
A)
b
ellshaped B) uniform
C) skewedtotheleft D) skewedtotheright
Page34
3) Thedataset:weeklygrocerybills(indollars)for20randomlyselectedhouseholds
135 120 115 132 136 124 119 145 98 110
125 120 115 130 140 105 116 121 125 108
A)
b
ellshaped B) uniform
C) skewedtotheleft D) skewedtotheright
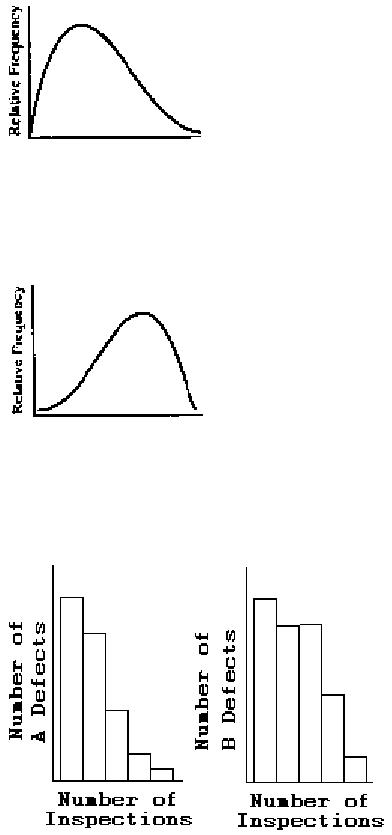
Describetheshapeofthedistribution.
4)
A) skewedtotheright B) skewedtotheleft
C) uniform D)
b
ellshaped
5)
A) skewedtotheleft B) skewedtotheright
C) uniform D)
b
ellshaped
Usethehistogramsshowntoanswerthequestion.
6)
Iseitherhistogramsymmetric?
A) Neitherissymmetric.
B) Thefirstissymmetric,butthesecondisnotsymmetric.
C) Thesecondissymmetric,butthefirstisnotsymmetric.
D) Botharesymmetric.
Page35
SHORTANSWER.Writethewordorphrasethatbestcompleteseachstatementoranswersthequestion.
Describetheshapeofthedistribution.
7) Asampleof15LittleLeagueplayerswasselectedandtheirweights(inpounds)wererecordedasfollows:
97 120 137 124 117
108 134 126 123 106
130 110 100 120 140
2.3 AdditionalDisplaysofQuantitativeData
1 Constructfrequencypolygons.
SHORTANSWER.Writethewordorphrasethatbestcompleteseachstatementoranswersthequestion.
Constructafrequencypolygonforthedata.
1)
Height(ininches) Frequency
50–52 5
53–55 8
56–58 12
59–61 13
62–64 11
2)
Weight(inpounds) Frequency
135–139 6
140–144 4
145–149 11
150–154 15
155–159 8
3) Thegradepointaveragesfor40eveningstudentsarelistedbelow.Constructafrequencypolygonusingeight
classes.
2.0 3.2 1.8 2.9 0.9 4.0 3.3 2.9 3.6 0.8
3.1 2.4 2.4 2.3 1.6 1.6 4.0 3.1 3.2 1.8
2.2 2.2 1.7 0.5 3.6 3.4 1.9 2.0 3.0 1.1
3.0 4.0 4.0 2.1 1.9 1.1 0.5 3.2 3.0 2.2
4) Thelocalpolice,usingradar,checkedthespeeds(inmph)of30motoristsinaconstructionarea.Theresultsare
listedbelow.Constructafrequencypolygonusingsixclassesandaclasswidthof3.
44 38 41 50 36 36 43 42 49 48
35 40 37 41 43 50 45 45 39 38
50 41 47 36 35 40 42 43 48 33
MULTIPLECHOICE.Choosetheonealternativethatbestcompletesthestatementoranswersthequestion.
Determinewhetherthestatementistrueorfalse.
5) Afrequencypolygonalwaysbeginsandendswithafrequencyofzero.
A) True B) False
Page36
6) Theclassmidpointcanbedeterminedbyaddingtothelowerclasslimitone–halfoftheclasswidth.
A) True B) False
2 Createcumulativefrequencyandrelativefrequencytables.
SHORTANSWER.Writethewordorphrasethatbestcompleteseachstatementoranswersthequestion.
Constructtherequestedfrequencydistribution.
1) TheAprilprecipitationamounts(ininches)for40citiesarelistedbelow.Constructafrequencydistribution,a
relativefrequencydistribution,acumulativefrequencydistribution,andarelativecumulativefrequency
distributionusingeightclasses.
2.0 3.2 1.8 2.9 0.9 4.0 3.3 2.9 3.6 0.8
3.1 2.4 2.4 2.3 1.6 1.6 4.0 3.1 3.2 1.8
2.2 2.2 1.7 0.5 3.6 3.4 1.9 2.0 3.0 1.1
3.0 4.0 4.0 2.1 1.9 1.1 0.5 3.2 3.0 2.2
2) Thecommutetime(inminutes)of30executivesarelistedbelow.Constructafrequencydistribution,arelative
frequencydistribution,acumulativefrequencydistribution,andarelativecumulativefrequencydistribution
usingfiveclasses.
70 72 71 70 69 73 69 68 70 71
67 71 70 74 69 68 71 71 71 72
69 71 68 67 73 74 70 71 69 68
3) Thelocalpolice,usingradar,checkedthespeeds(inmph)of30motoristsinaconstructionarea.Theresultsare
listedbelow.Constructafrequencydistribution,arelativefrequencydistribution,acumulativefrequency
distribution,andarelativecumulativefrequencydistributionusingsixclasses.
44 38 41 50 36 36 43 42 49 48
35 40 37 41 43 50 45 45 39 38
50 41 47 36 35 40 42 43 48 33
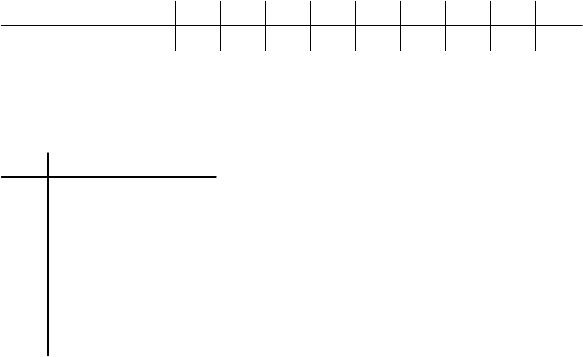
3 Constructfrequencyandrelativefrequencyogives.
SHORTANSWER.Writethewordorphrasethatbestcompleteseachstatementoranswersthequestion.
Constructtherequestedogive.
1) Thegradepointaveragesfor40eveningstudentsarelistedbelow.Constructafrequencyogiveusing
eightclasses.
2.0 3.2 1.8 2.9 0.9 4.0 3.3 2.9 3.6 0.8
3.1 2.4 2.4 2.3 1.6 1.6 4.0 3.1 3.2 1.8
2.2 2.2 1.7 0.5 3.6 3.4 1.9 2.0 3.0 1.1
3.0 4.0 4.0 2.1 1.9 1.1 0.5 3.2 3.0 2.2
2) Theheights(ininches)of30lawyersarelistedbelow.Constructafrequencyogiveusingfiveclasses.
70 72 71 70 69 73 69 68 70 71
67 71 70 74 69 68 71 71 71 72
69 71 68 67 73 74 70 71 69 68
3) Thelocalpolice,usingradar,checkedthespeeds(inmph)of30motoristsonaruralroad.Theresultsarelisted
below.Constructafrequencyogiveusingsixclasses.
44 38 41 50 36 36 43 42 49 48
35 40 37 41 43 50 45 45 39 38
50 41 47 36 35 40 42 43 48 33
Page37
4) Thegradepointaveragesfor40eveningstudentsarelistedbelow.Constructarelativefrequencyogiveusing
eightclasses.
2.0 3.2 1.8 2.9 0.9 4.0 3.3 2.9 3.6 0.8
3.1 2.4 2.4 2.3 1.6 1.6 4.0 3.1 3.2 1.8
2.2 2.2 1.7 0.5 3.6 3.4 1.9 2.0 3.0 1.1
3.0 4.0 4.0 2.1 1.9 1.1 0.5 3.2 3.0 2.2
5) Theheights(ininches)of30lawyersarelistedbelow.Constructarelativefrequencyogiveusingfiveclasses.
70 72 71 70 69 73 69 68 70 71
67 71 70 74 69 68 71 71 71 72
69 71 68 67 73 74 70 71 69 68
6) Thelocalpolice,usingradar,checkedthespeeds(inmph)of30motoristsonaruralroad.Theresultsarelisted
below.Constructarelativefrequencyogiveusingsixclasses.
44 38 41 50 36 36 43 42 49 48
35 40 37 41 43 50 45 45 39 38
50 41 47 36 35 40 42 43 48 33
MULTIPLECHOICE.Choosetheonealternativethatbestcompletesthestatementoranswersthequestion.
Provideanappropriateresponse.
7) Anogiveisagraphthatrepresentscumulativefrequenciesorcumulativerelativefrequencies.Thepoints
labeledonthehorizontalaxisarethe
A) Upperclasslimits B) Lowerclasslimits C) Midpoints D) Frequencies
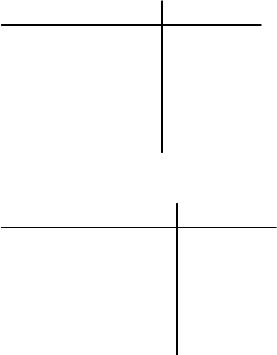
4 Drawtime–seriesgraphs.
SHORTANSWER.Writethewordorphrasethatbestcompleteseachstatementoranswersthequestion.
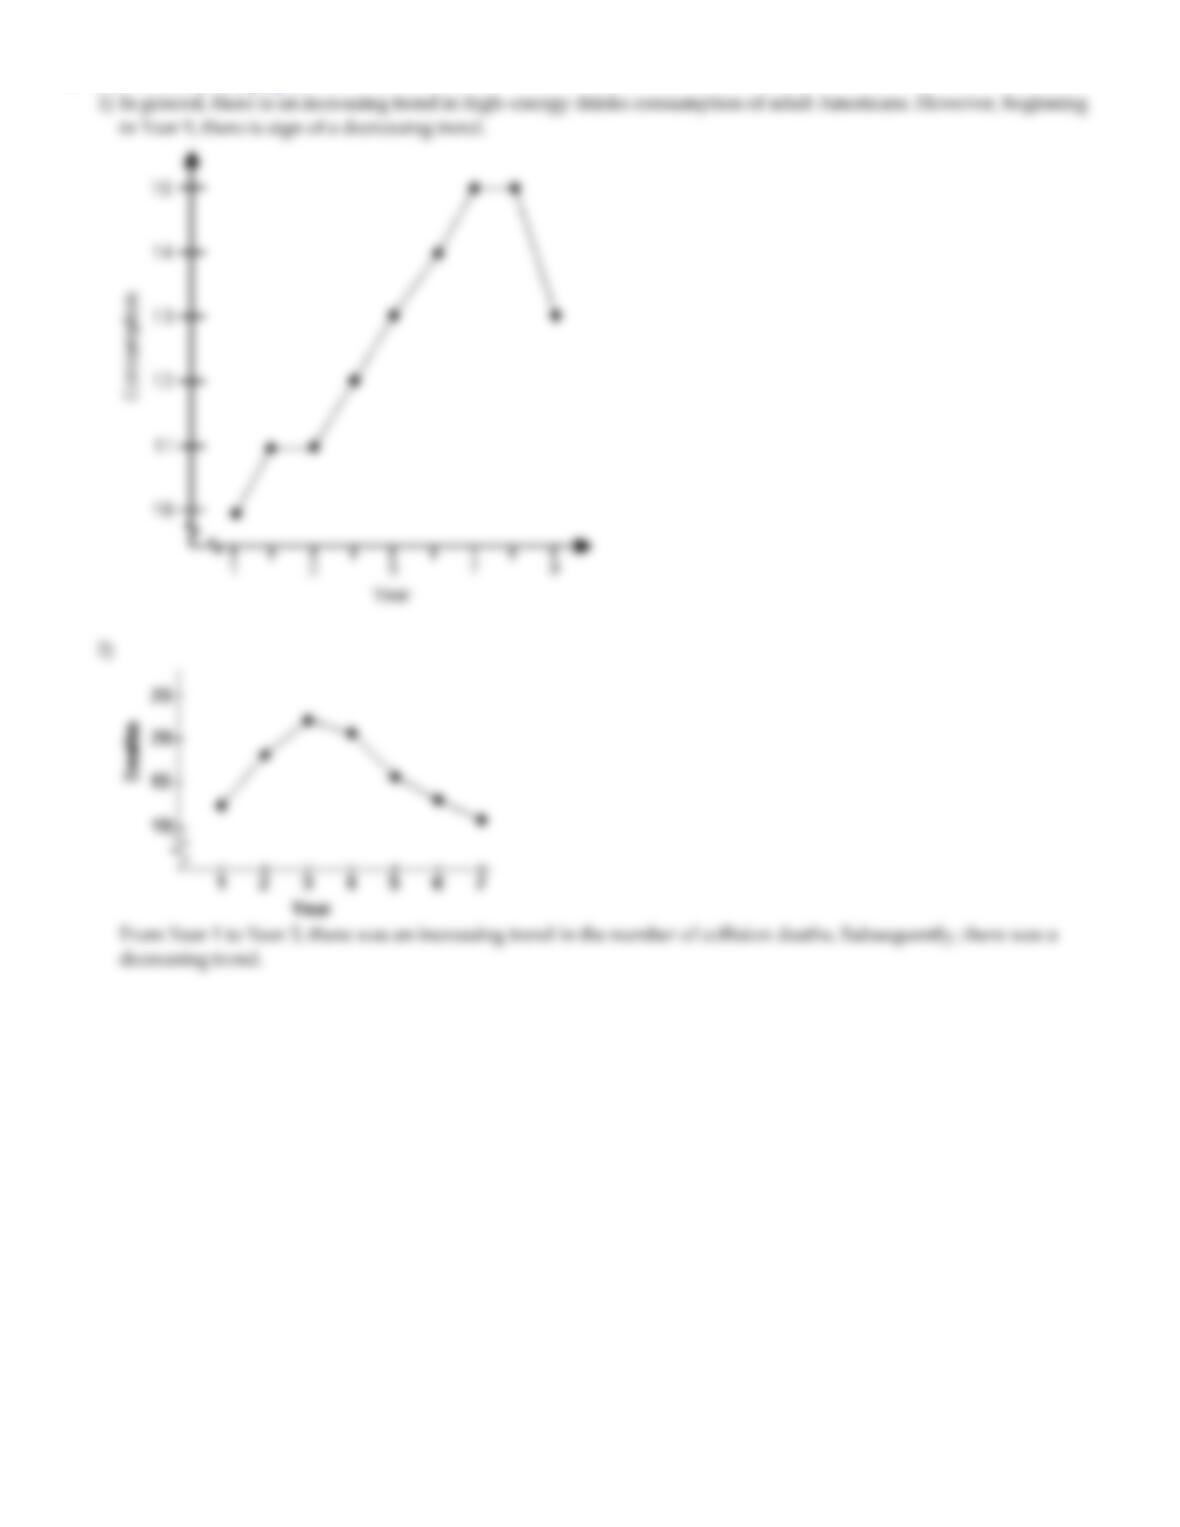
Useatimeseriesplottodisplaythedata.Commentonthetrend,
1) Thedatabelowrepresenttheconsumptionofhigh–energydrinks (ingallons)byadultAmericansovera
nine–yearperiod.
Year 123456789
Consumption(gal) 10 11 11 12 13 14 15 15 13
2) Atransportationengineerwishestousethefollowingdatatoillustratethenumberofdeathsfromthecollision
ofpassengercarswithmotorcyclesonaparticularhighway.
Year NumberofDeaths
112
217
322
421
516
613
711
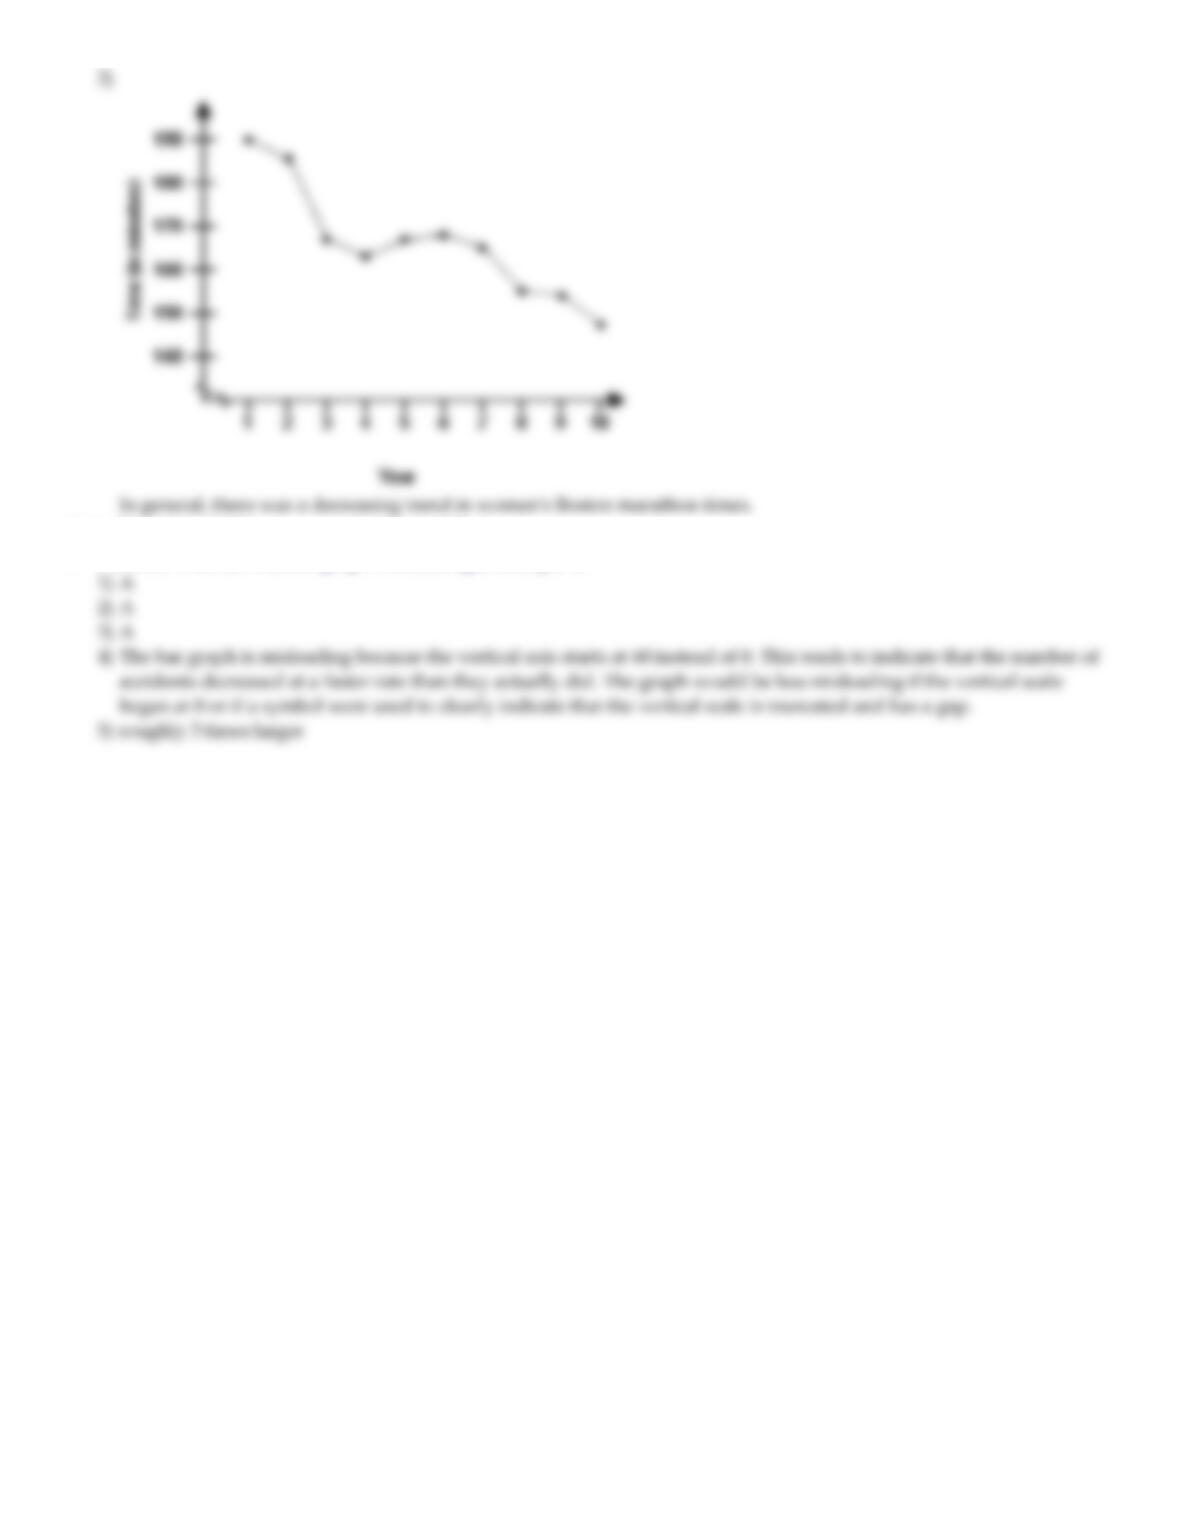
3) WomenwereallowedtoentertheBostonMarathonforthefirsttimein1972.Listedbelowarethewinning
womenʹstimes(inminutes)forthefirst10years.
Year
Time
12345678910
190 186 167 162 167 168 165 155 154 147
Page38
2.4 GraphicalMisrepresentationsofData
1 Describewhatcanmakeagraphmisleadingordeceptive.
MULTIPLECHOICE.Choosetheonealternativethatbestcompletesthestatementoranswersthequestion.
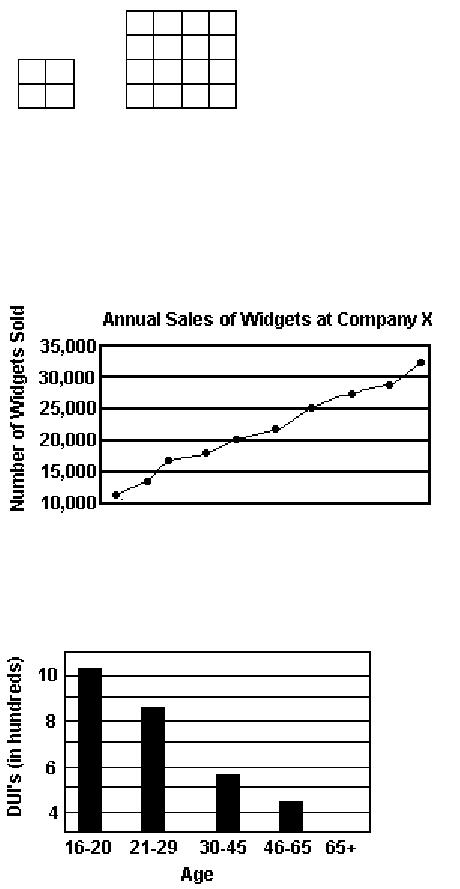
Explainwhatismisleadingaboutthegraphic.
1)
Thevolumeofoursaleshasdoubled!!!
A) Thelengthofasidehasdoubled,buttheareahasbeenmultipliedby4.
B) Thelengthofasidehasdoubled,buttheareahasbeenmultipliedby8.
C) Thelengthofasidehasdoubled,buttheareahasbeenunchanged.
D) Thegraphicisnotmisleading.
2)
2004 2006 2008 2010 2012
A) Theverticalscaledoesnotbeginatzero. B) Thehorizontallabelisincomplete.
C) Thetrendisdepictedinthewrongdirection. D) Thegraphicisnotmisleading.
3) 2012DUIFiguresforStateCounty
A) Thegraphicmaygivetheimpressionthatdriversoverage65hadnoDUIʹsin2012.
B) Thegraphiconlyincludesinformationforoneyear.
C) Thehorizontalscaledoesnotbeginatzero.
D) Thegraphicisnotmisleading.
Page39
SHORTANSWER.Writethewordorphrasethatbestcompleteseachstatementoranswersthequestion.
Provideanappropriateresponse.
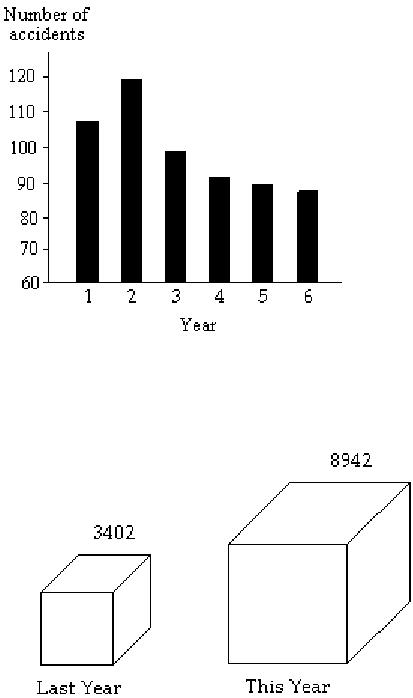
4) Thefollowinggraphshowsthenumberofcaraccidentsoccurringinonecityineachoftheyears2006through
2011(Year1=2006,Year2=2007etc).Thenumberofaccidentsdroppedin2008afteranewspeedlimitwas
imposed.Howisthebargraphmisleading?Howwouldyouredesignthegraphtobelessmisleading?
5) Aparceldeliverystorefindsthattheirdeliveryratesincreasedoverthepastyear.Lastyearitdelivered3402
parcels.Thisyearitdelivered8942parcels.
Howmanytimeslargershouldthegraphicforthisyearbethanthegraphicforlastyear?
Page40
Ch.2 OrganizingandSummarizingData
AnswerKey
2.1 OrganizingQualitativeData
1 Organizequalitativedataintables.
2 Constructbargraphs.
Page41
3 Constructpiecharts.
Page42
2.2 OrganizingQuantitativeData:ThePopularDisplays
1 Organizediscretedataintables.
2 Constructhistogramsofdiscretedata.
Page43
3 Organizecontinuousdataintables.
Page44
4 Constructhistogramsofcontinuousdata.
Page45
5 Drawstem–and–leafplots.
Page46
6 Drawdotplots.
7 Identifytheshapeofadistribution.
2.3 AdditionalDisplaysofQuantitativeData
1 Constructfrequencypolygons.
Page48
2 Createcumulativefrequencyandrelativefrequencytables.
Page49
3 Constructfrequencyandrelativefrequencyogives.
Page50
Page51
4 Drawtime–seriesgraphs.
Page52
2.4 GraphicalMisrepresentationsofData
1 Describewhatcanmakeagraphmisleadingordeceptive.
Page53