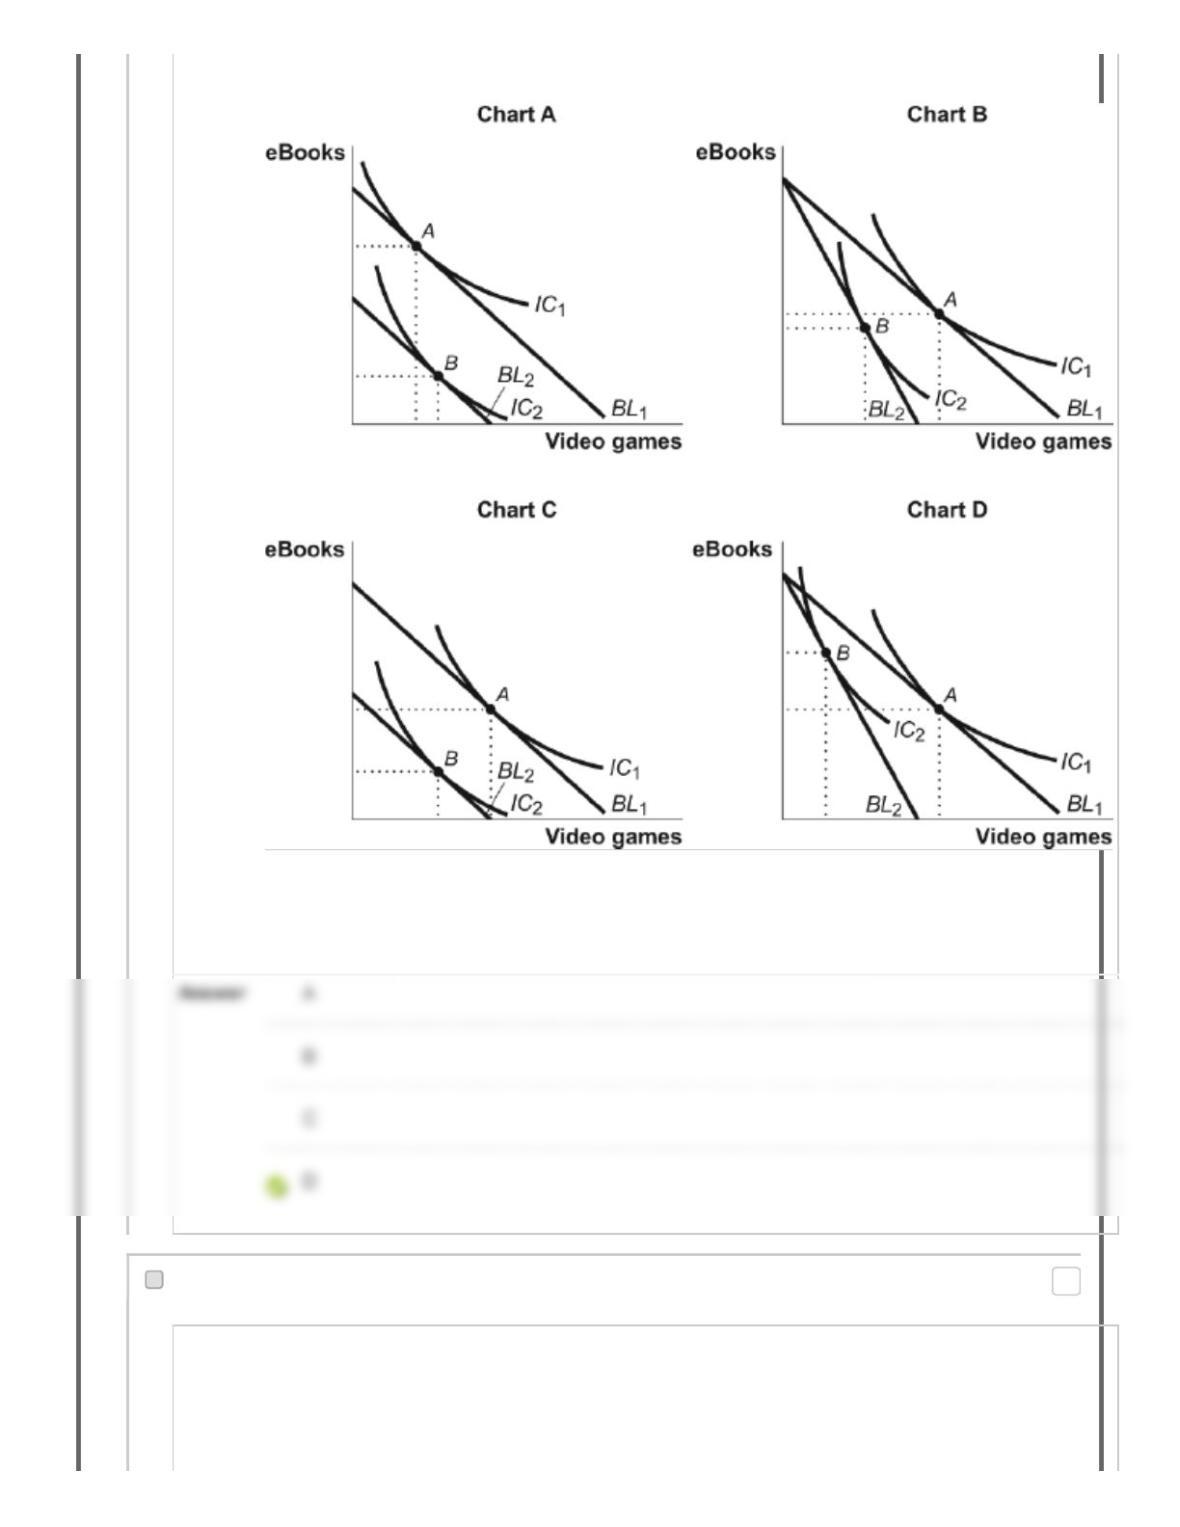
Figure: The Consumption of Video Games and eBooks
Reference: Ref 10-13
(Figure: The Consumption of Video Games and eBooks) Look at the figure The Consumption of
Video Games and eBooks. Which chart in the figure shows the effects of an increase in the
price of video games when video games and eBooks are substitutes?
159. Multiple Choice: Figure: The Consumption of Video Game...
Question
Points: 0
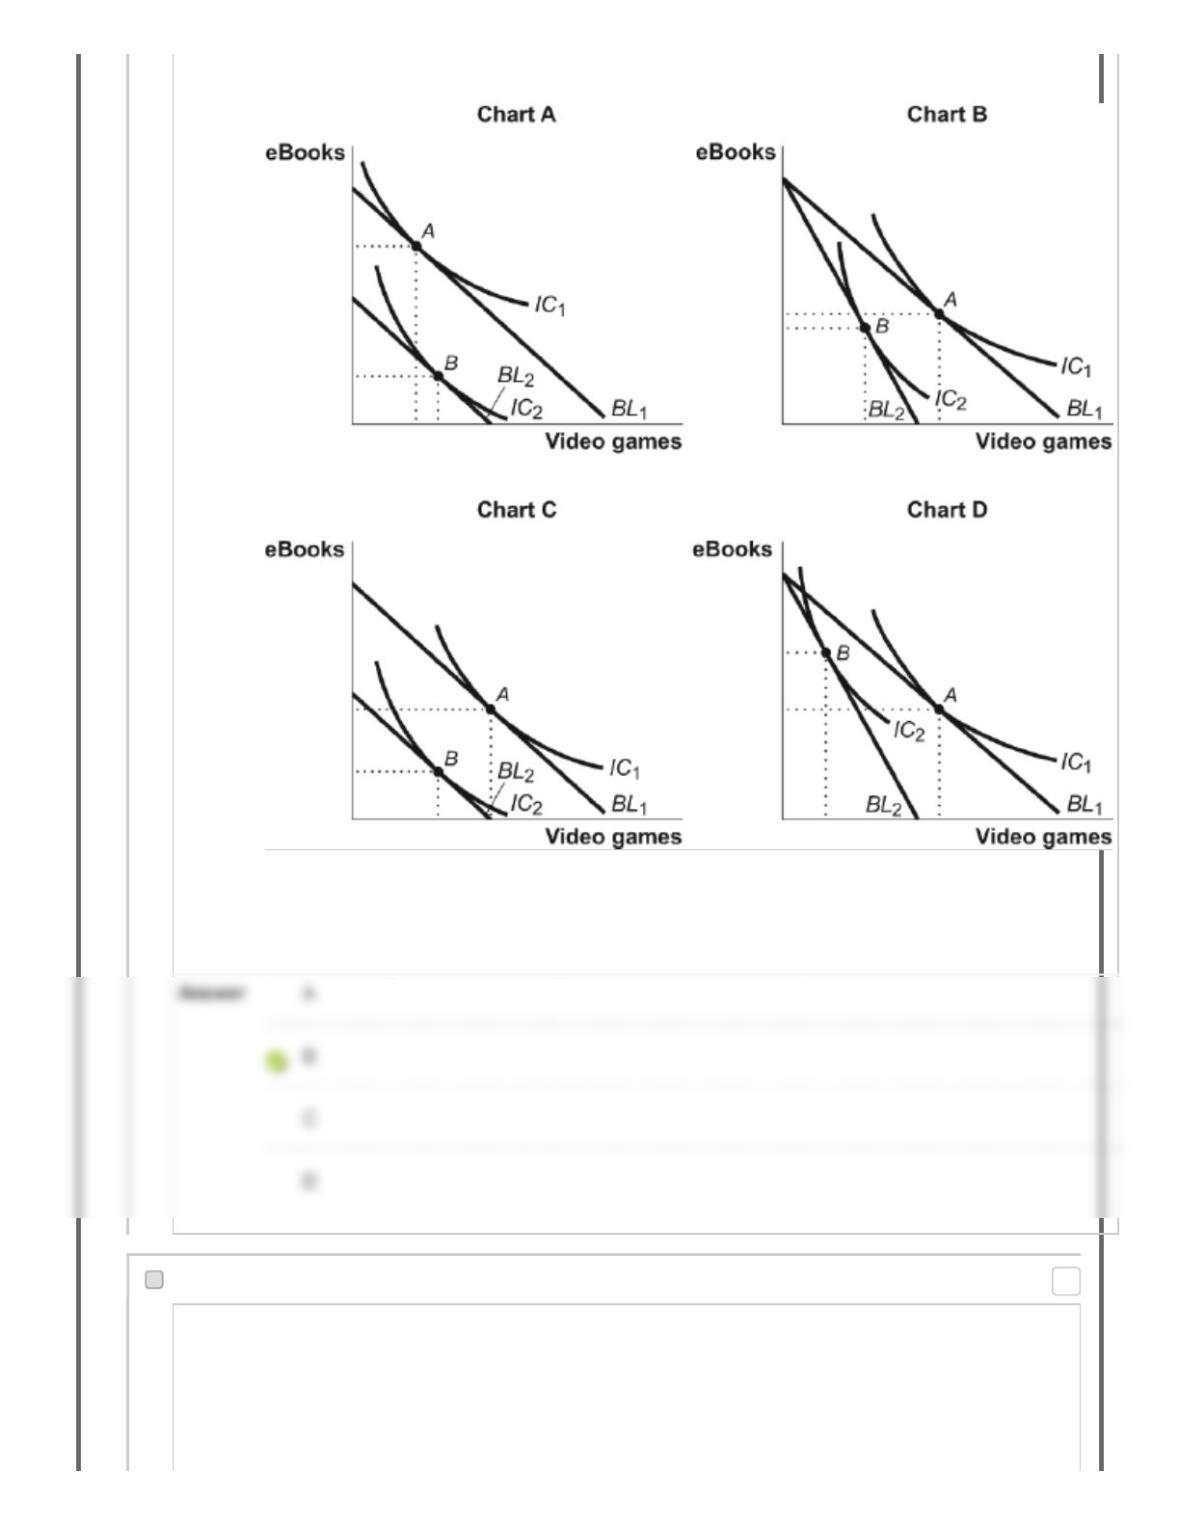
Figure: The Consumption of Video Games and eBooks
Reference: Ref 10-13
(Figure: The Consumption of Video Games and eBooks) Look at the figure The Consumption of
Video Games and eBooks. Which chart in the figure shows the effects of an increase in the
price of video games when video games and eBooks are complements?
160. Multiple Choice: Figure: Harold‘s Indifference CurvesT…
Question
Points: 0
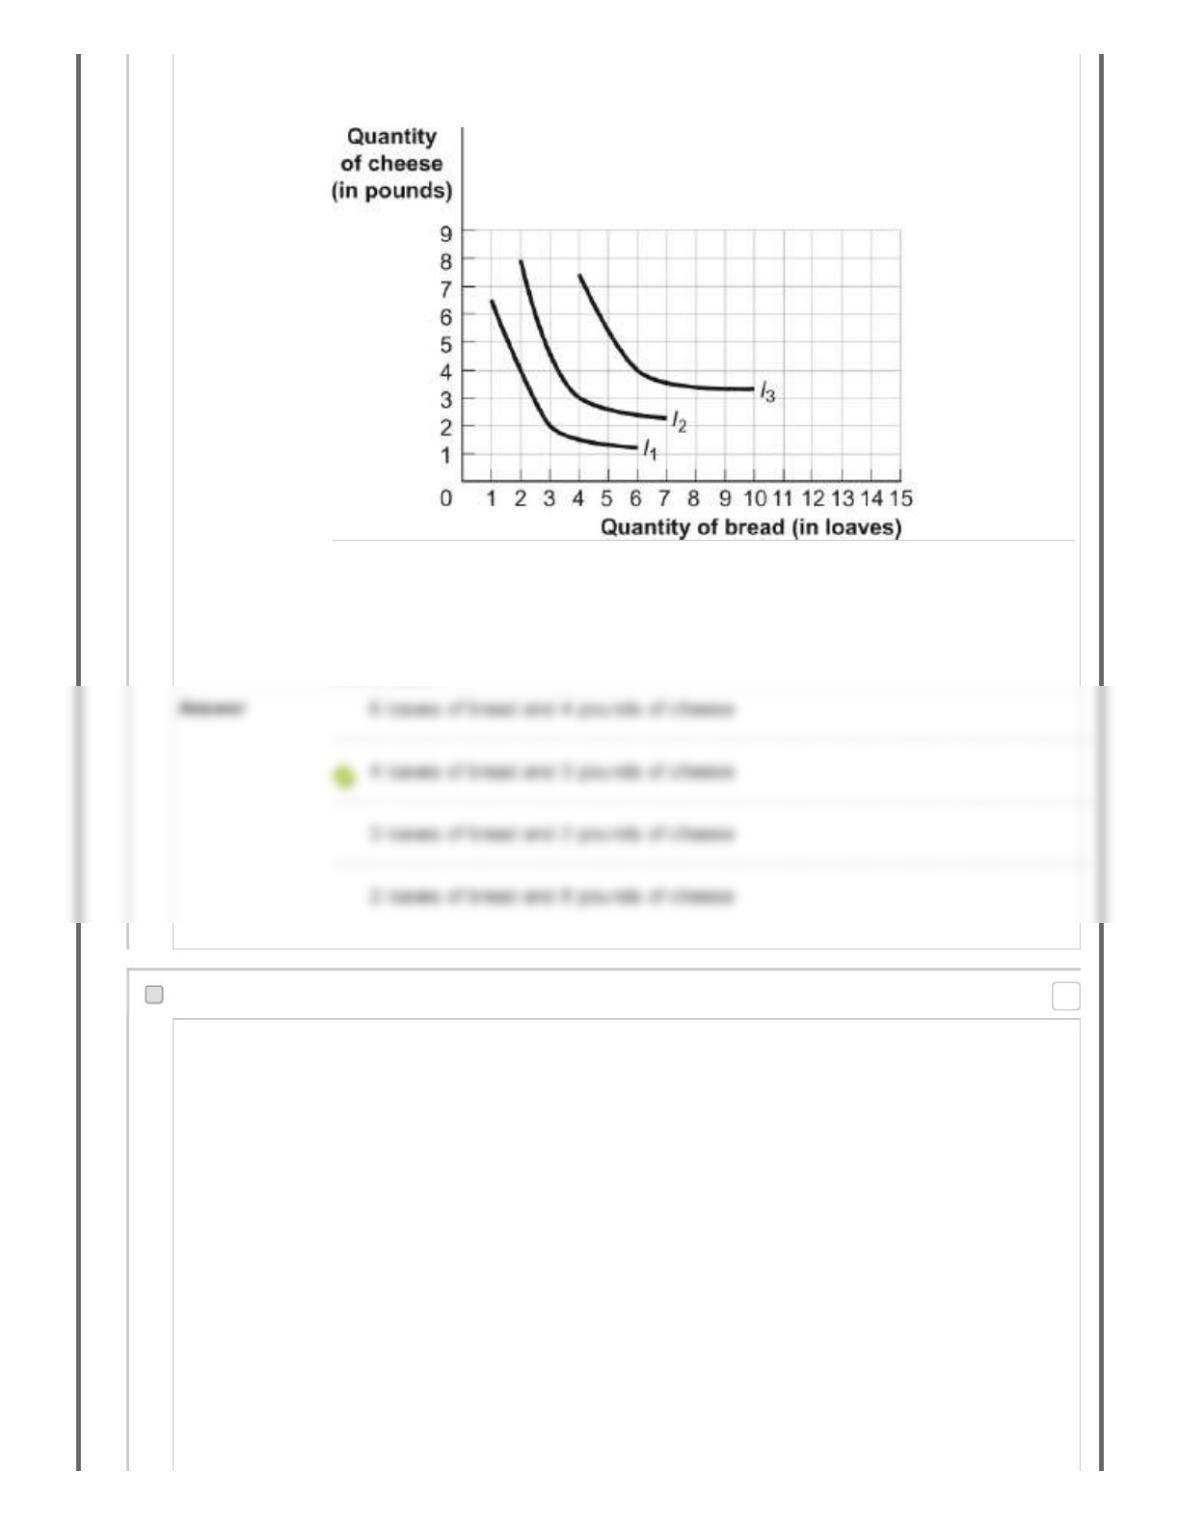
Figure: Harold’s Indifference Curves
The figure shows three of Harold’s indifference curves for bread and cheese.
Reference: Ref 10-14
(Figure: Harold‘s Indifference Curves) Look at the figure Harold‘s Indifference Curves.
If the price of bread is $1 per loaf, the price of cheese is $2, and Harold has $10 to
spend on bread and cheese, what is Harold’s optimal consumption bundle of bread
and cheese?
161. Multiple Choice: Figure: Harold‘s Indifference CurvesT…
Question
Points: 0

Figure: Harold’s Indifference Curves
The figure shows three of Harold’s indifference curves for bread and cheese.
Reference: Ref 10-14
(Figure: Harold‘s Indifference Curves) Look at the figure Harold‘s Indifference Curves.
If the price of bread is $1 per loaf, the price of cheese is $2, and Harold has $14 to
spend on bread and cheese, what is Harold’s optimal consumption bundle of bread
and cheese?
162. Multiple Choice: Figure: Harold‘s Indifference CurvesT…
Question
Points: 0
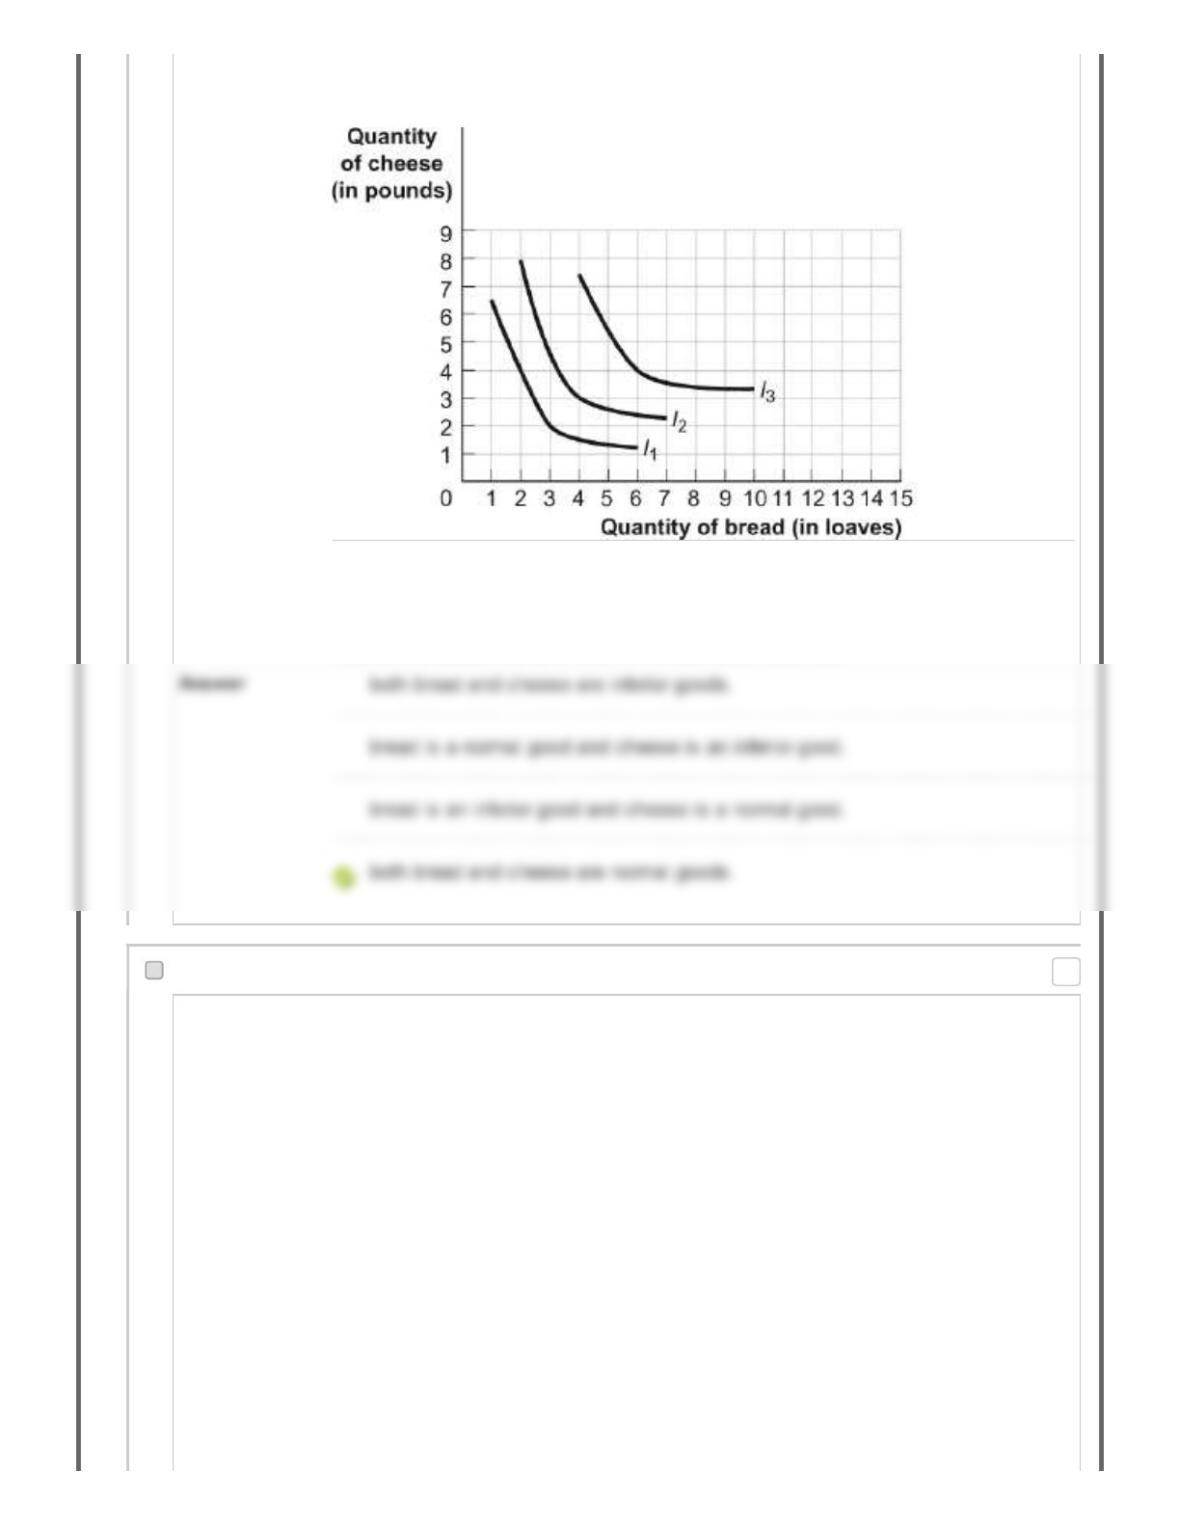
Figure: Harold’s Indifference Curves
The figure shows three of Harold’s indifference curves for bread and cheese.
Reference: Ref 10-14
(Figure: Harold‘s Indifference Curves) Look at the figure Harold‘s Indifference Curves.
Given that the price of bread is $1 per loaf and the price of cheese is $2, as Harold‘s
income increases from $10 to $14, we can determine that:
163. Multiple Choice: Figure: Harold‘s Indifference CurvesT…
Question
Points: 0
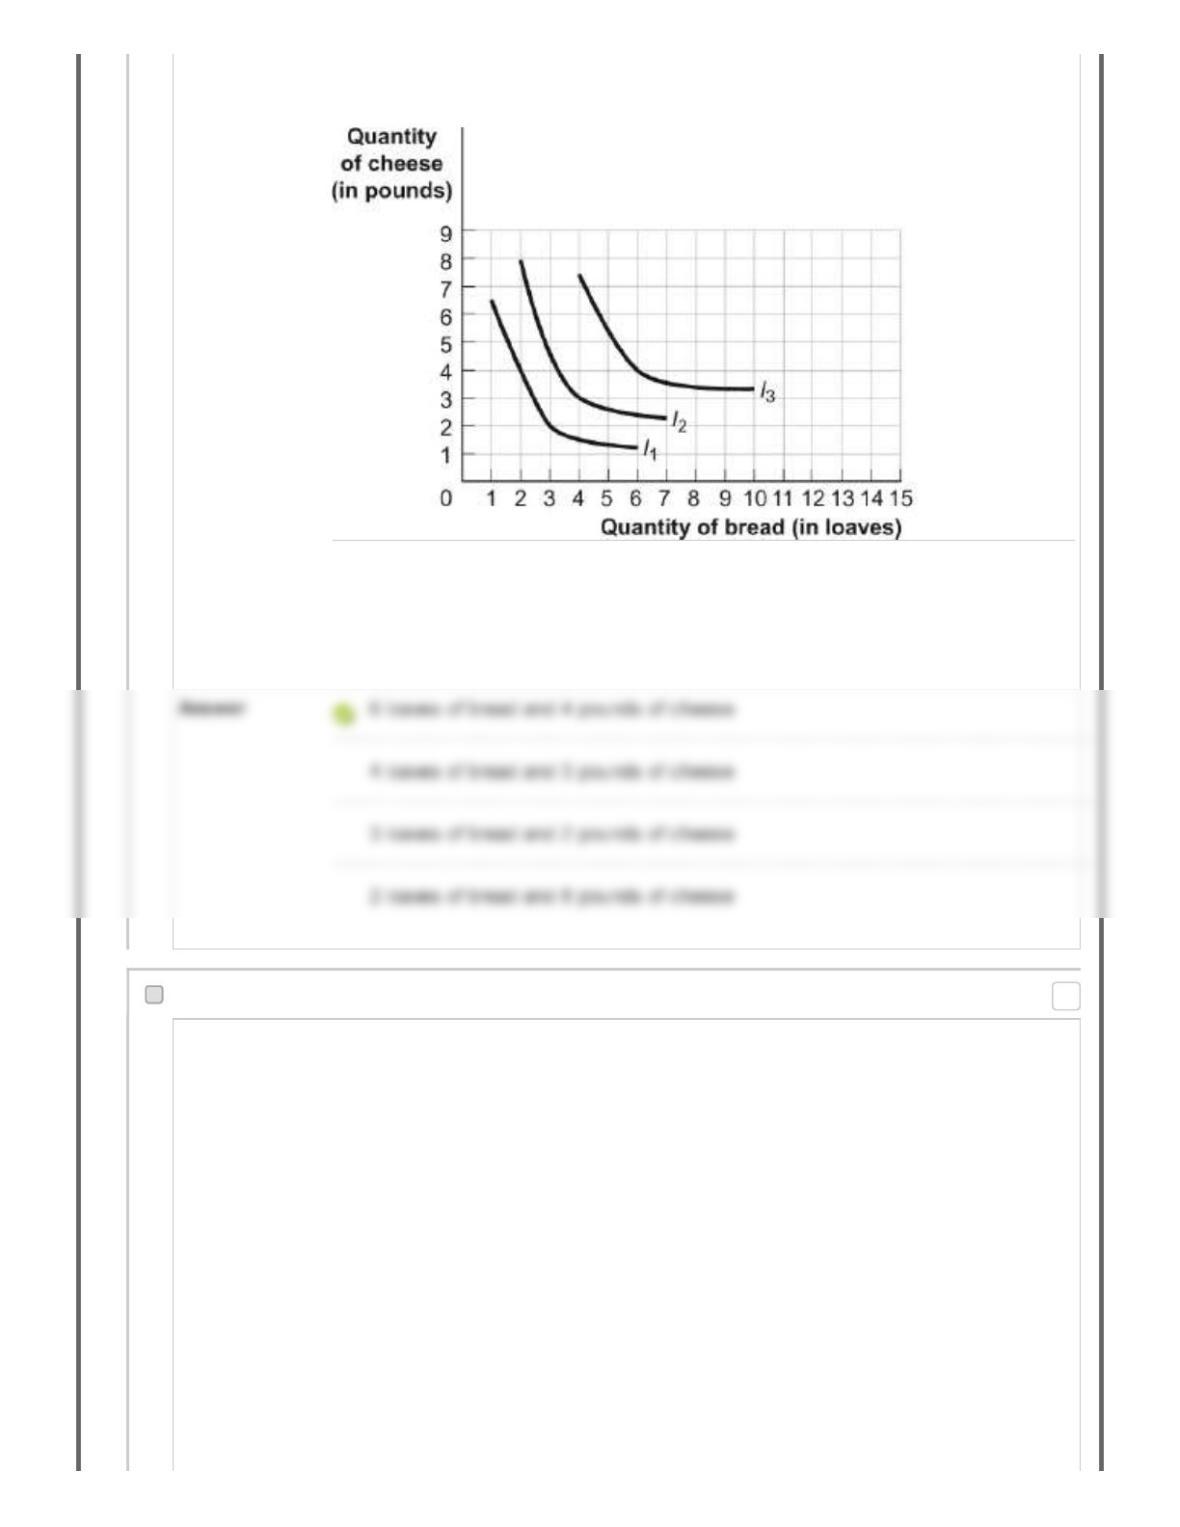
Figure: Harold’s Indifference Curves
The figure shows three of Harold’s indifference curves for bread and cheese.
Reference: Ref 10-14
(Figure: Harold‘s Indifference Curves) Look at the figure Harold‘s Indifference Curves.
If the price of bread is $2 per loaf, the price of cheese is $4, and Harold has $28 to
spend on bread and cheese, what is Harold’s optimal consumption bundle of bread
and cheese?
164. Multiple Choice: Figure: Harold‘s Indifference CurvesT…
Question
Points: 0

Figure: Harold’s Indifference Curves
The figure shows three of Harold’s indifference curves for bread and cheese.
Reference: Ref 10-14
(Figure: Harold‘s Indifference Curves) Look at the figure Harold‘s Indifference Curves.
If the price of bread is $0.50 per loaf, the price of cheese is $1, and Harold has $7 to
spend on bread and cheese, what is Harold’s optimal consumption bundle of bread
and cheese?
165. Multiple Choice: Figure: Harold‘s Indifference CurvesT…
Question
Points: 0

Figure: Harold’s Indifference Curves
The figure shows three of Harold’s indifference curves for bread and cheese.
Reference: Ref 10-14
(Figure: Harold‘s Indifference Curves) Look at the figure Harold‘s Indifference Curves.
If the price of bread is $2 per loaf, the price of cheese is $2, and Harold has $10 to
spend on bread and cheese, what is Harold’s optimal consumption bundle of bread
and cheese?
166. Multiple Choice: Figure: Harold‘s Indifference CurvesT…
Question
Points: 0
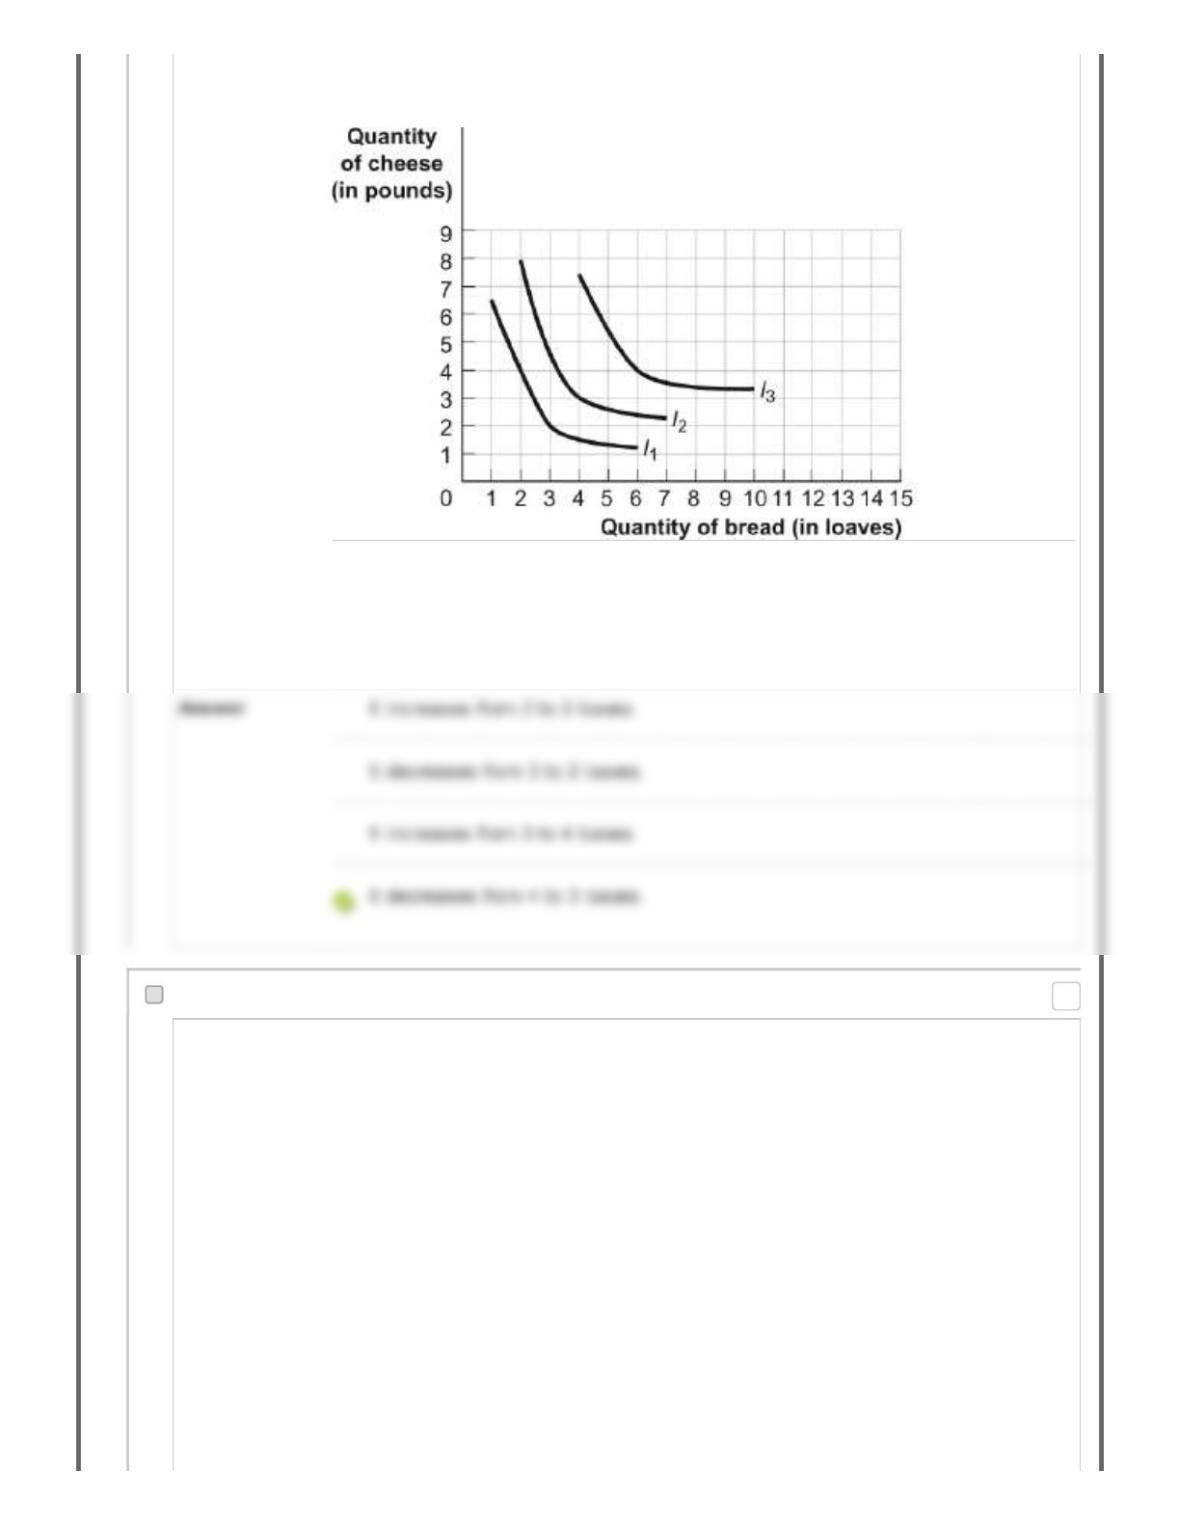
Figure: Harold’s Indifference Curves
The figure shows three of Harold’s indifference curves for bread and cheese.
Reference: Ref 10-14
(Figure: Harold‘s Indifference Curves) Look at the figure Harold‘s Indifference Curves.
If the price of cheese is $2 per pound and Harold has $10 to spend on bread and
cheese, how does Harold‘s consumption of bread change as the price of bread rises
from $1 per loaf to $2 per loaf?
167. Multiple Choice: Figure: Harold‘s Indifference CurvesT…
Question
Points: 0
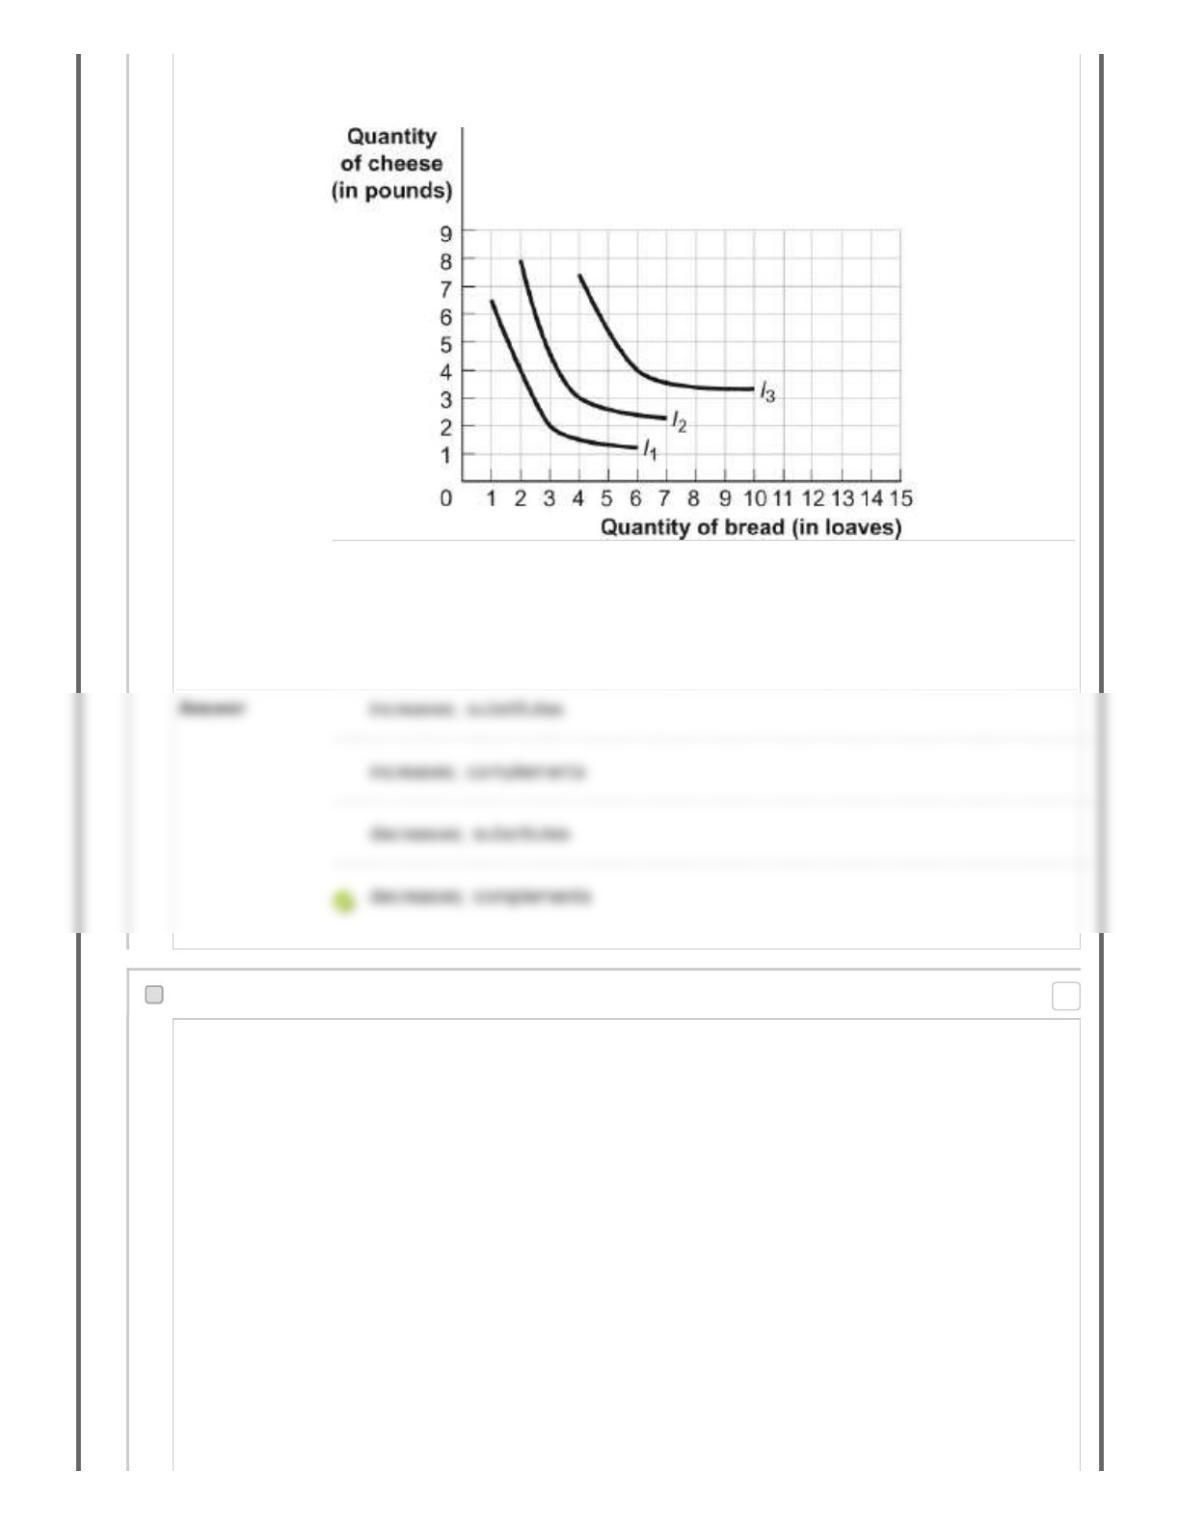
Figure: Harold’s Indifference Curves
The figure shows three of Harold’s indifference curves for bread and cheese.
Reference: Ref 10-14
(Figure: Harold‘s Indifference Curves) Look at the figure Harold‘s Indifference Curves.
If the price of cheese is $2 per pound and Harold has $10 to spend on bread and
cheese, Harold ________ his consumption of cheese as the price of bread rises
from $1 per loaf to $2 per loaf indicating that bread and cheese are ________.
168. Multiple Choice: Figure: The Optimal Consumption Bundl...
Question
Points: 0
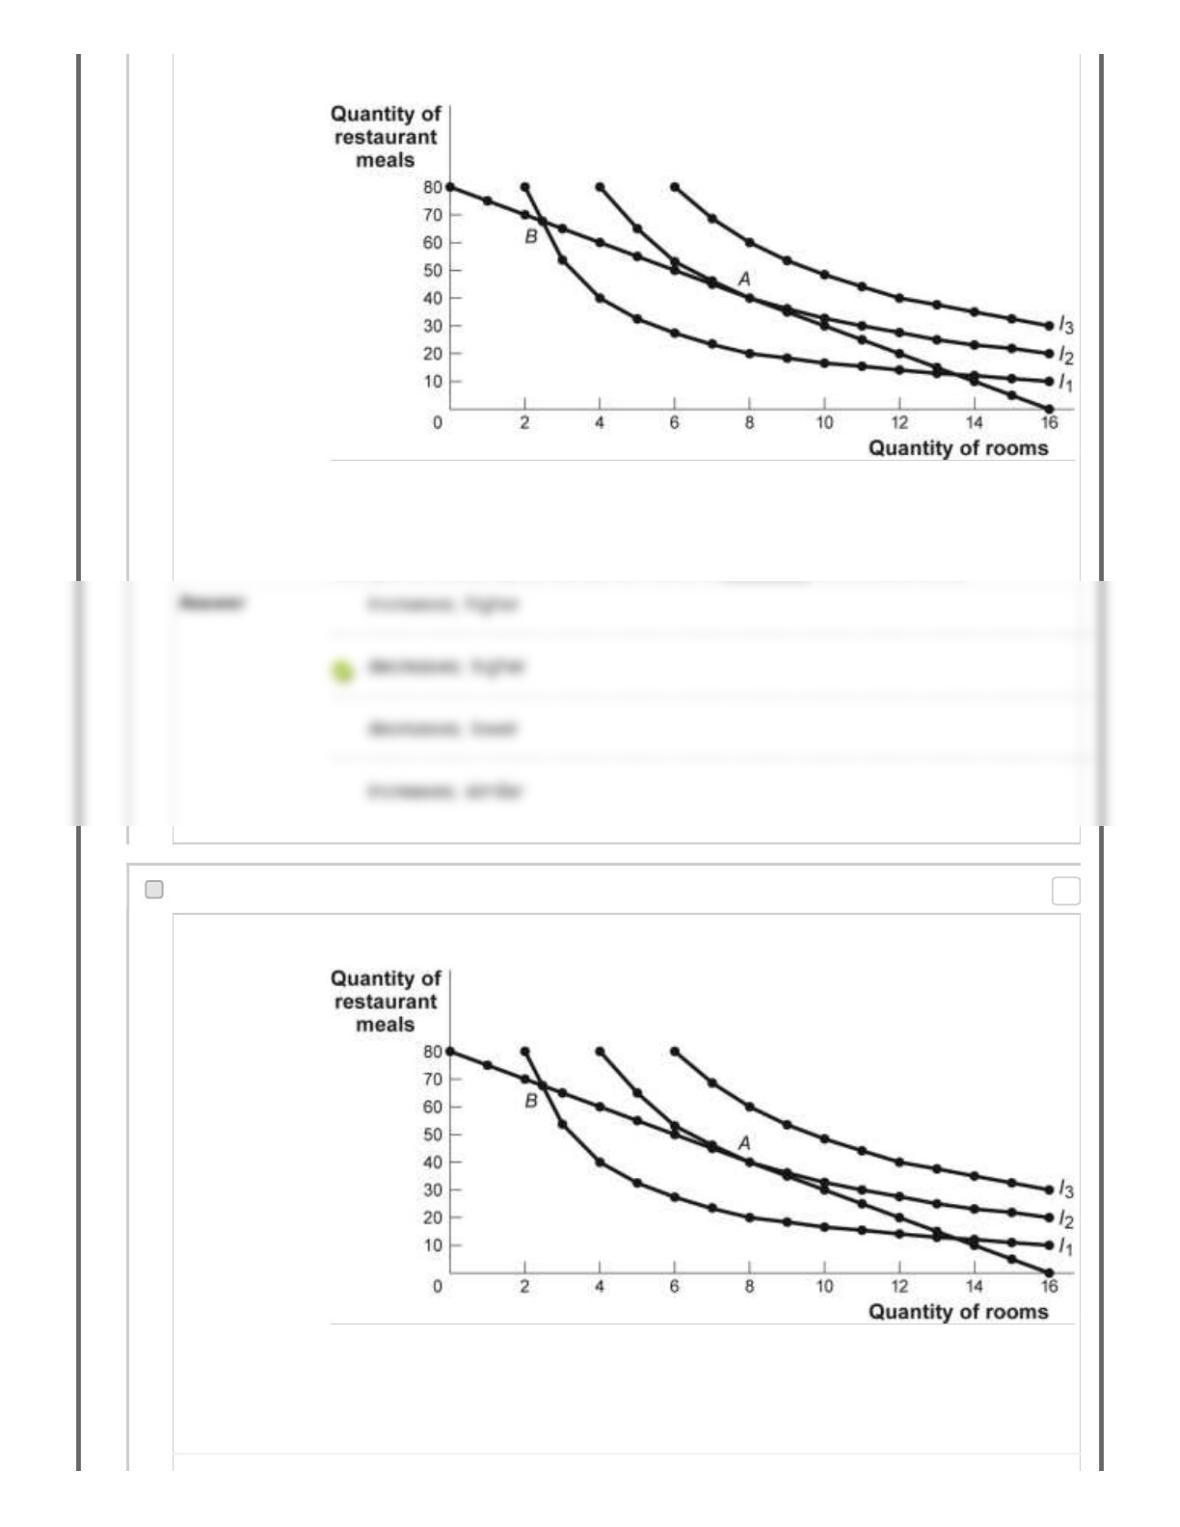
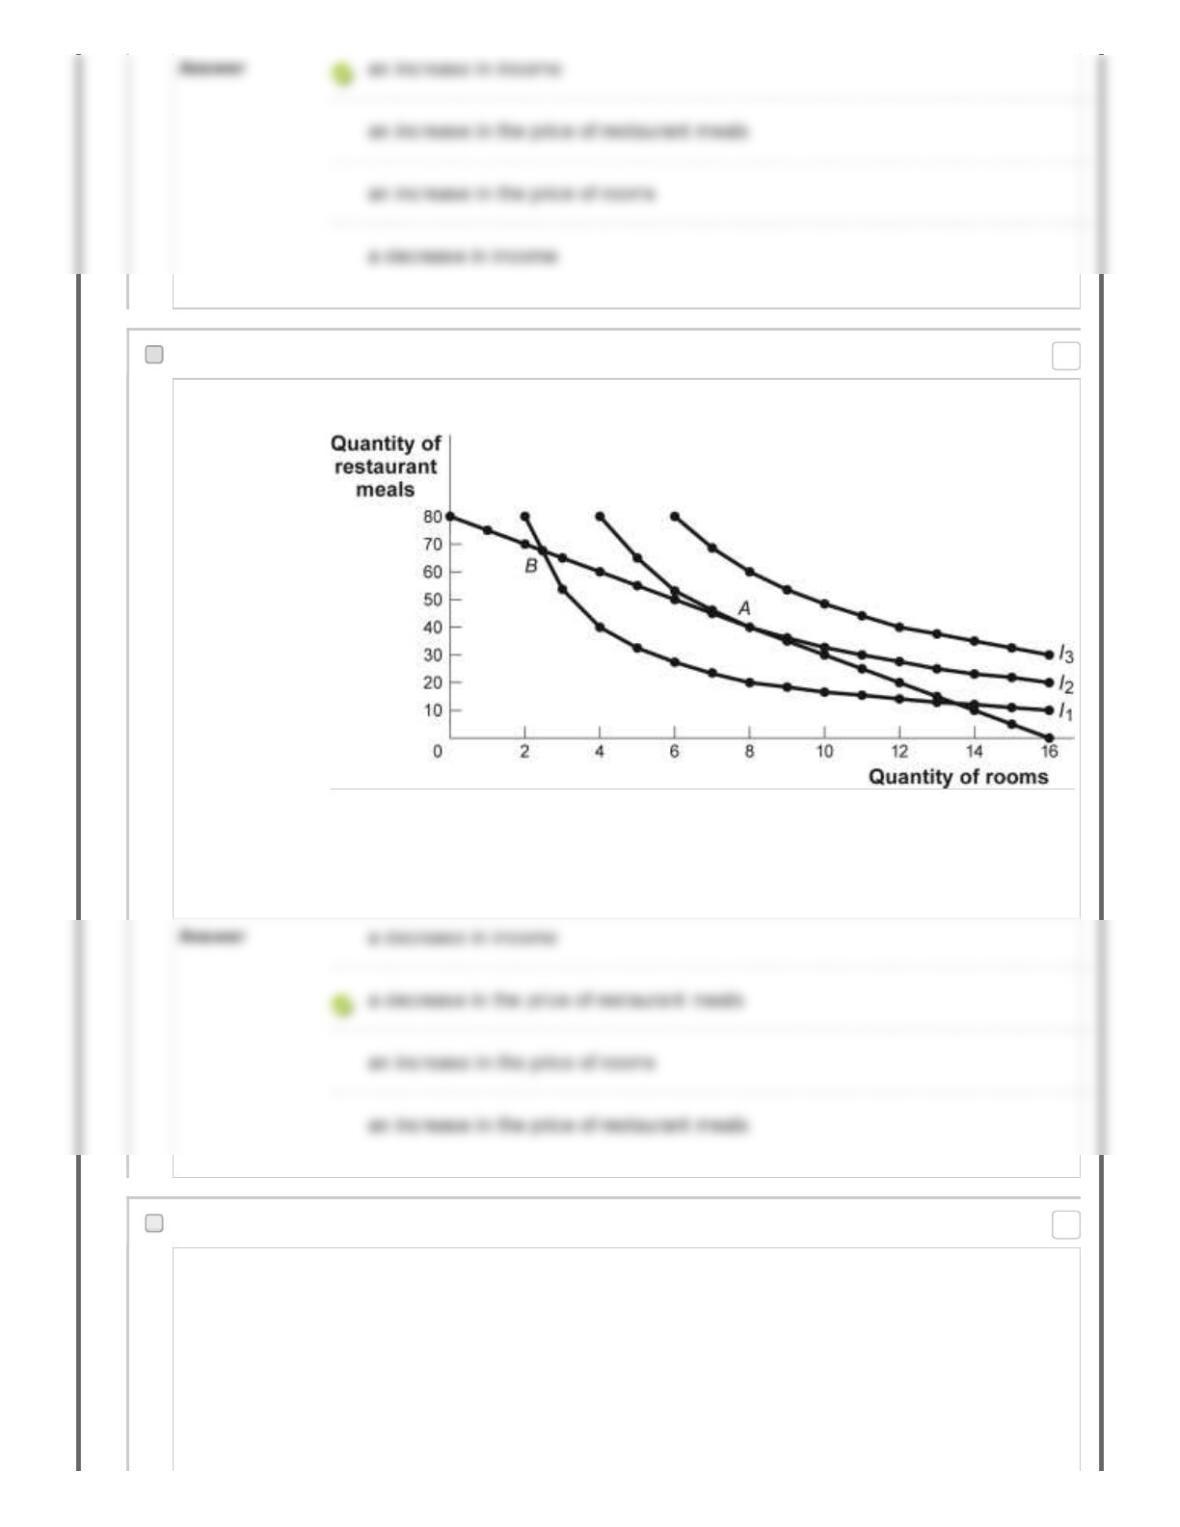
Figure: The Optimal Consumption Bundle
Reference: Ref 10-15
(Figure: The Optimal Consumption Bundle) Look at the figure The Optimal
Consumption Bundle. In the figure, if the price of restaurant meals ________, then
the optimal consumption bundle will be on a ________ indifference curve.
169. Multiple Choice: Figure: The Optimal Consumption Bundl...
Question Figure: The Optimal Consumption Bundle
Reference: Ref 10-15
(Figure: The Optimal Consumption Bundle) Look at the figure The Optimal
Consumption Bundle. In the figure, which of the following could lead to an optimal
consumption bundle on indifference curve I3?
Points: 0
170. Multiple Choice: Figure: The Optimal Consumption Bundl...
Question Figure: The Optimal Consumption Bundle
Reference: Ref 10-15
(Figure: The Optimal Consumption Bundle) Look at the figure The Optimal
Consumption Bundle. In the figure, which of the following could lead to an optimal
consumption bundle on indifference curve I3?
171. Multiple Choice: Figure: The Optimal Consumption Bundl...
Question
Points: 0
Points: 0
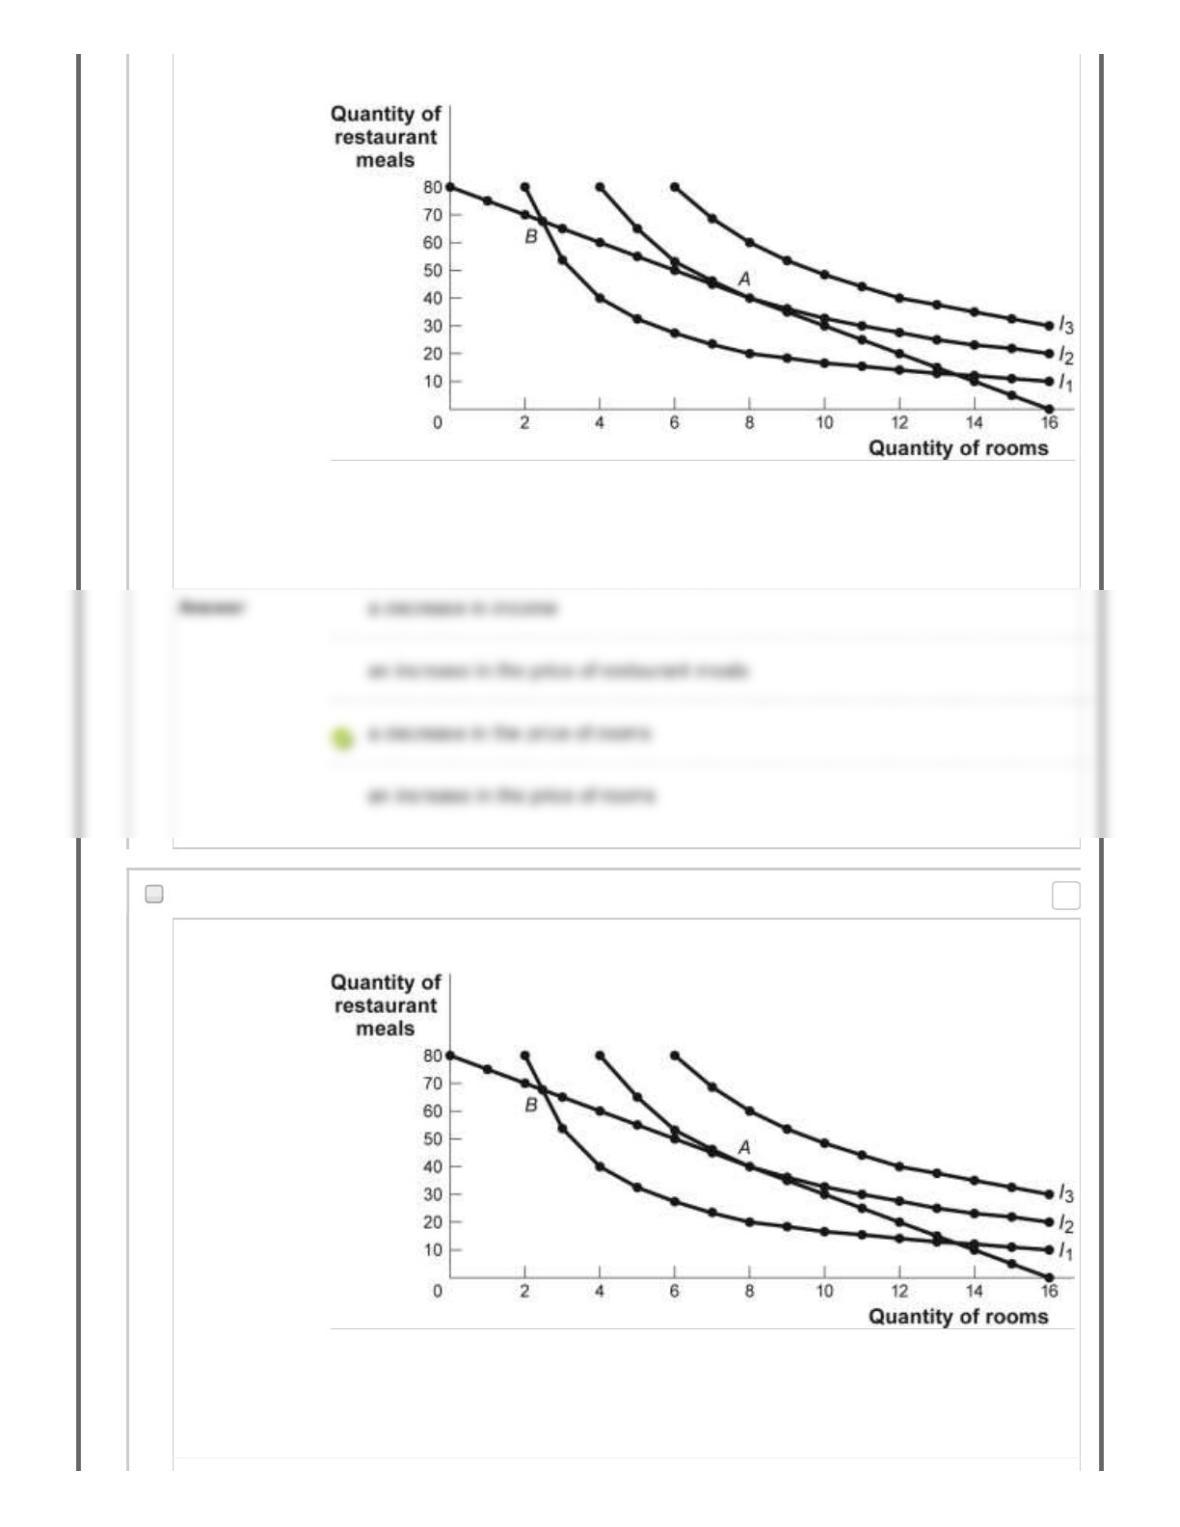
Figure: The Optimal Consumption Bundle
Reference: Ref 10-15
(Figure: The Optimal Consumption Bundle) Look at the figure The Optimal
Consumption Bundle. In the figure, which of the following could lead to an optimal
consumption bundle on indifference curve I3?
172. Multiple Choice: Figure: The Optimal Consumption Bundl...
Question Figure: The Optimal Consumption Bundle
Reference: Ref 10-15
(Figure: The Optimal Consumption Bundle) Look at the figure The Optimal
Consumption Bundle. In the figure, which of the following could lead to an optimal
consumption bundle on indifference curve I1?
Points: 0
173. Multiple Choice: Figure: The Optimal Consumption Bundl...
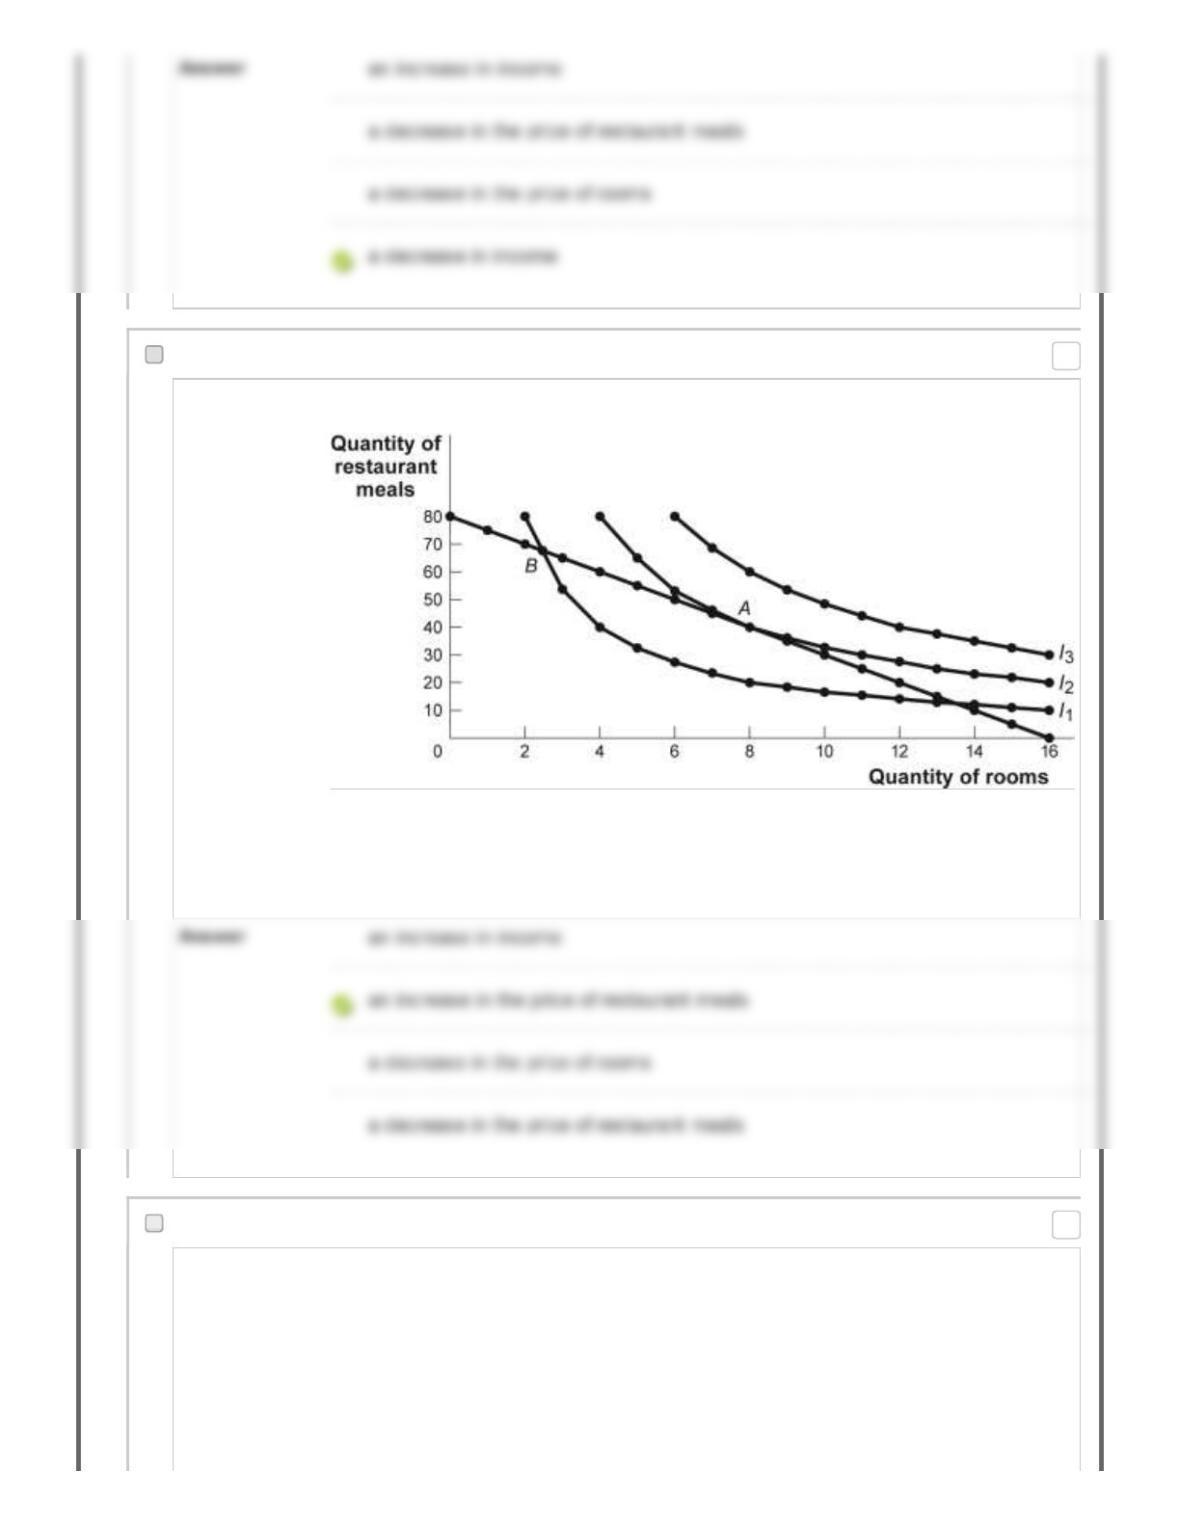
Question Figure: The Optimal Consumption Bundle
Reference: Ref 10-15
(Figure: The Optimal Consumption Bundle) Look at the figure The Optimal
Consumption Bundle. In the figure, which of the following could lead to an optimal
consumption bundle on indifference curve I1?
174. Multiple Choice: Figure and Table: The Changing Slope ...
Question
Points: 0
Points: 0
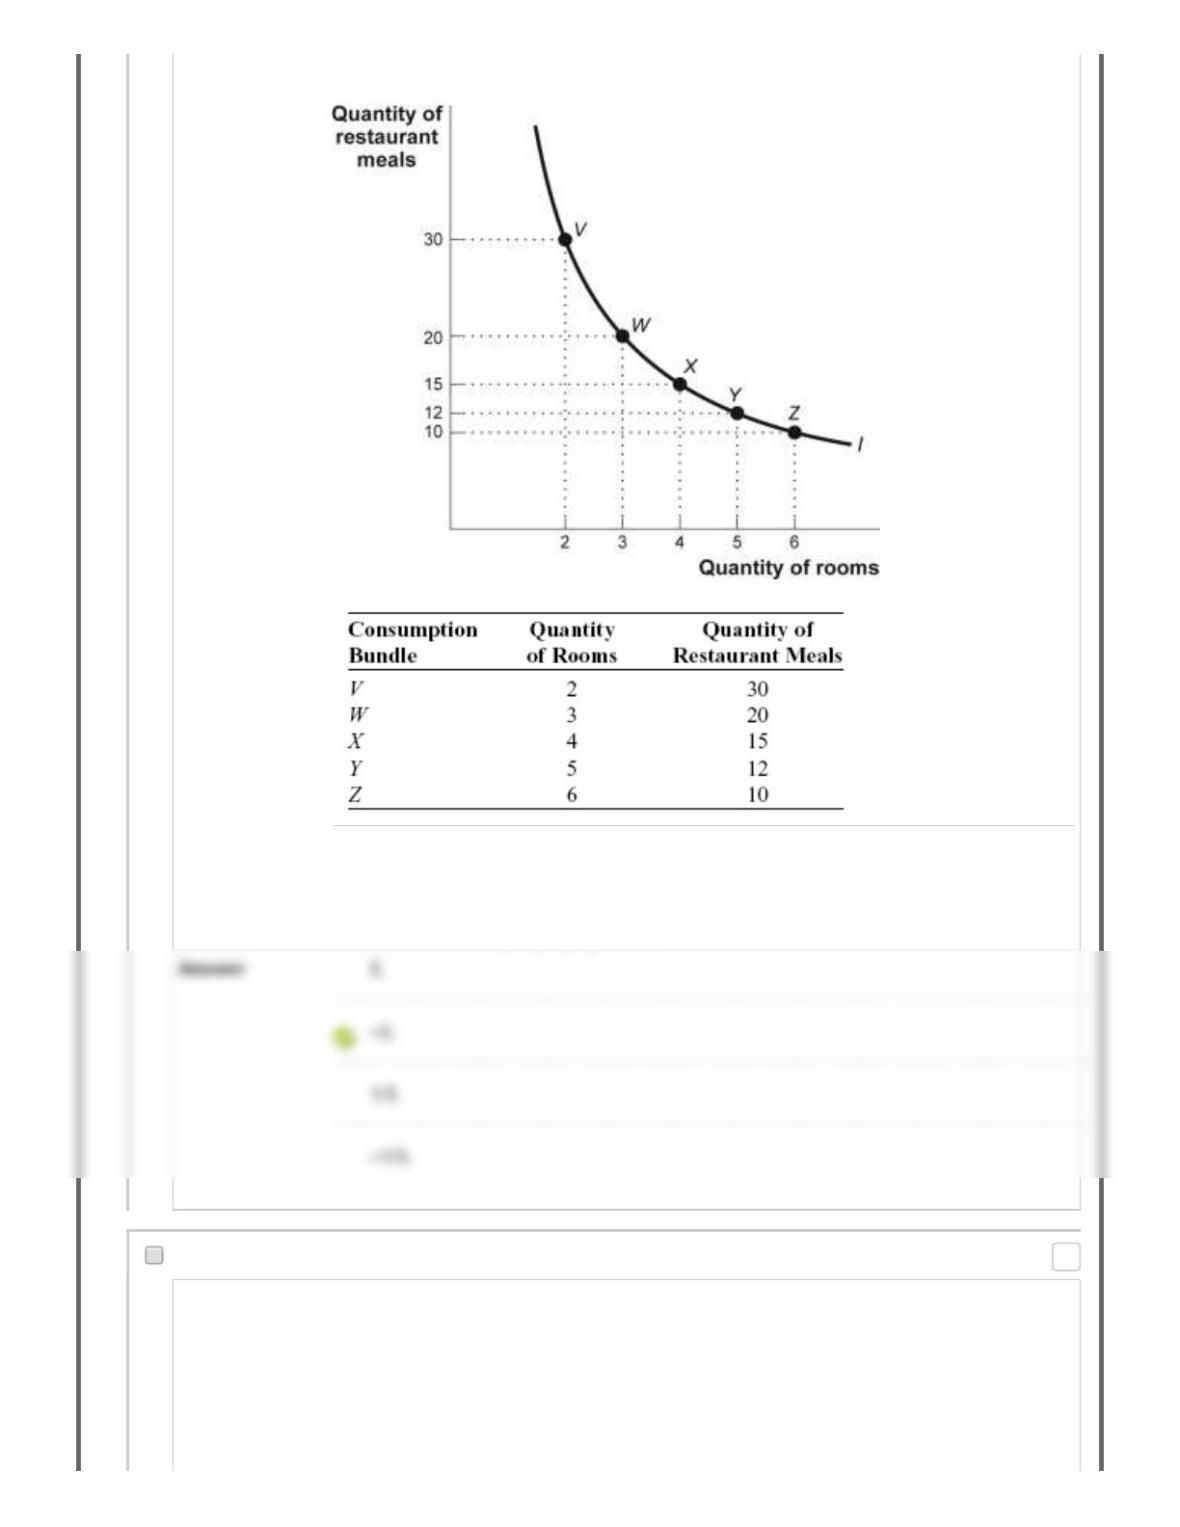
Figure and Table: The Changing Slope of an Indifference Curve
Reference: Ref 10-16
(Figure and Table: The Changing Slope of an Indifference Curve) Look at the figure
and table The Changing Slope of an Indifference Curve. The slope between points W
and X in the accompanying figure is:
175. Multiple Choice: Figure and Table: The Changing Slope ...
Question
Points: 0
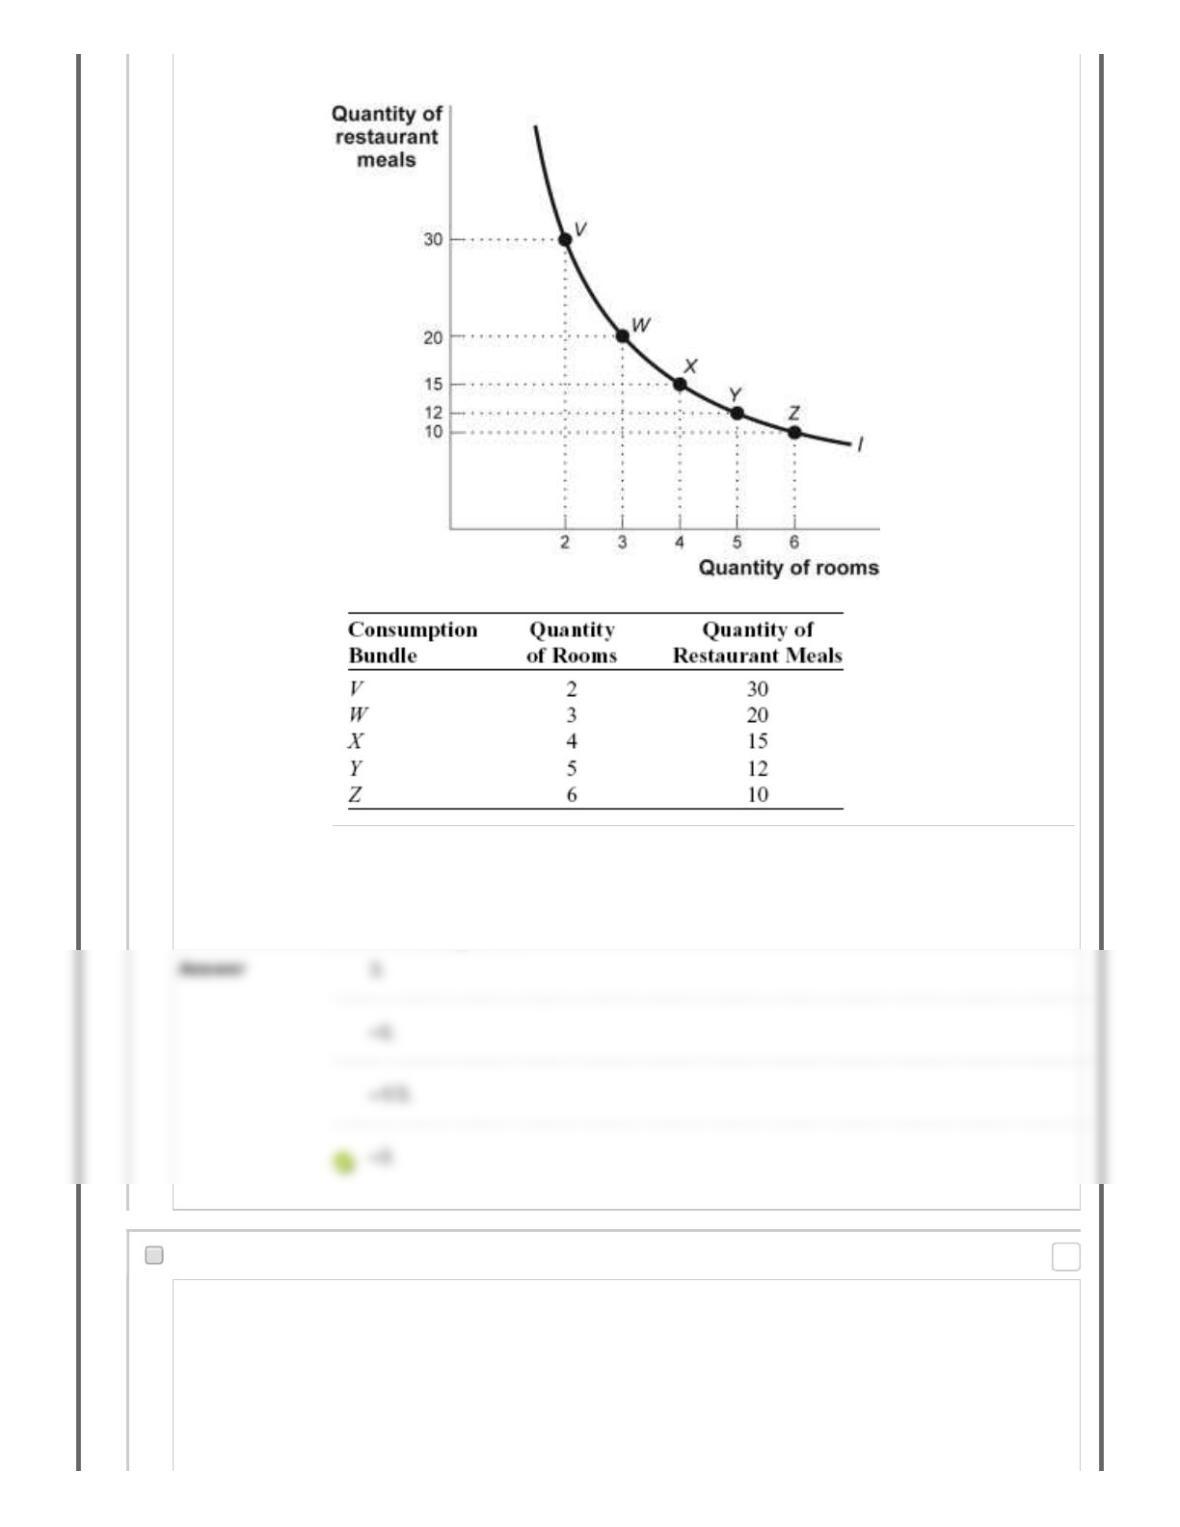
Figure and Table: The Changing Slope of an Indifference Curve
Reference: Ref 10-16
(Figure and Table: The Changing Slope of an Indifference Curve) Look at the figure
and table The Changing Slope of an Indifference Curve. The slope between points X
and Y in the figure is:
176. Multiple Choice: Figure and Table: The Changing Slope ...
Question
Points: 0
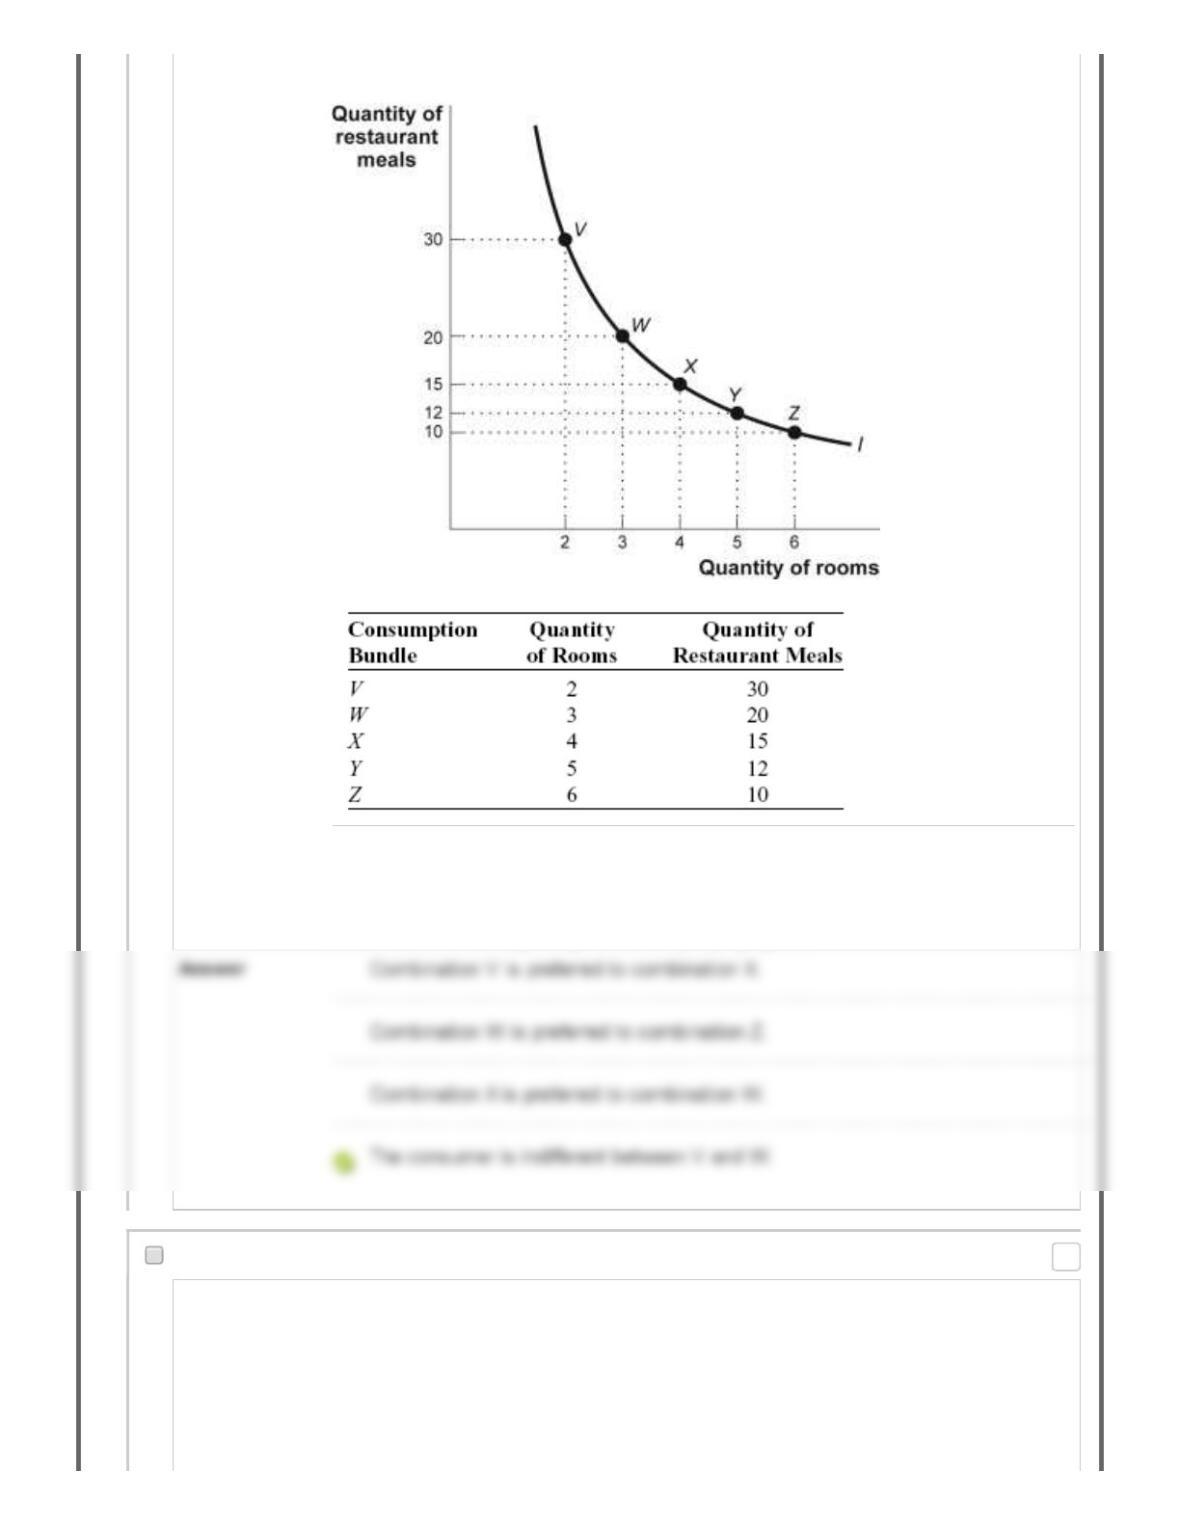
Figure and Table: The Changing Slope of an Indifference Curve
Reference: Ref 10-16
(Figure and Table: The Changing Slope of an Indifference Curve) Look at the figure
and table The Changing Slope of an Indifference Curve. Which of the following
statements is true regarding the accompanying figure?
177. Multiple Choice: Figure: Consumer Equilibrium II Refer…
Question
Points: 0
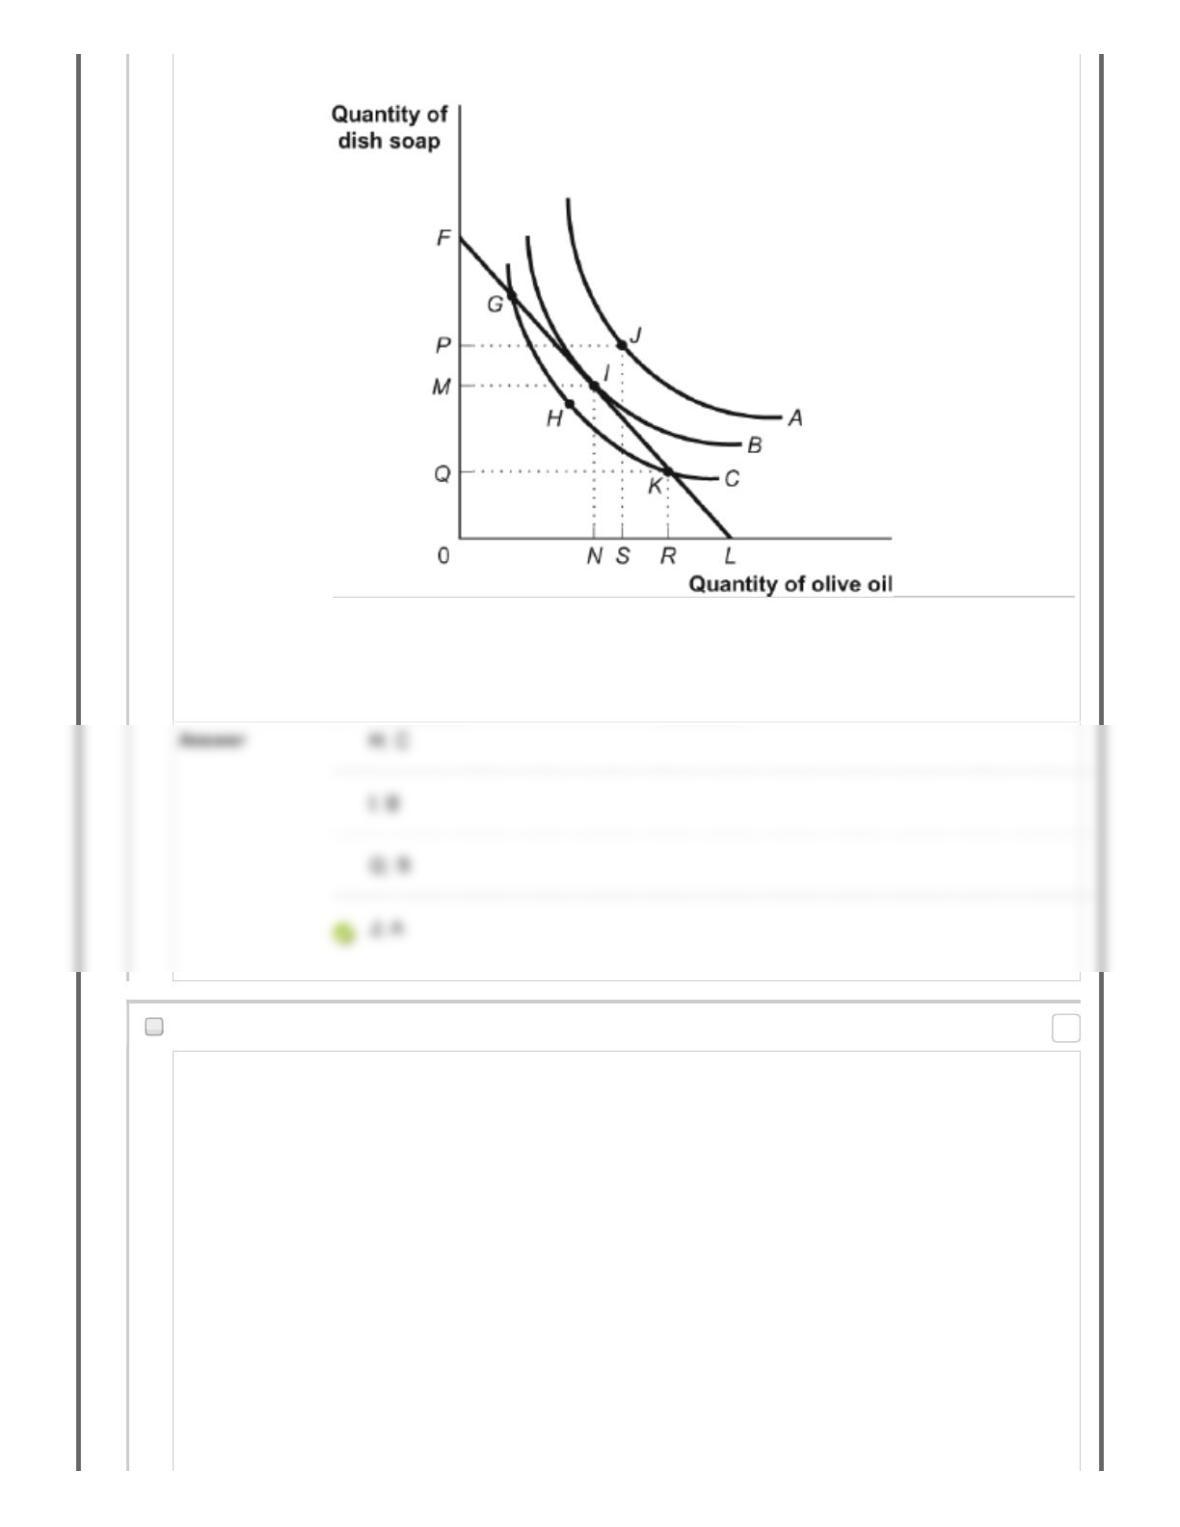
Figure: Consumer Equilibrium II
Reference: Ref 10-17
(Figure: Consumer Equilibrium II) Look at the figure Consumer Equilibrium II. Given
the indifference curves in the figure, the highest level of total utility is associated with
point ________ on indifference curve ________.
178. Multiple Choice: Figure: Consumer Equilibrium II Refer…
Question
Points: 0

Figure: Consumer Equilibrium II
Reference: Ref 10-17
(Figure: Consumer Equilibrium II) Look at the figure Consumer Equilibrium II. The
lowest level of total utility shown in the figure is associated with point ________ on
curve ________.
179. Multiple Choice: Figure: Consumer Equilibrium II Refer…
Question
Points: 0
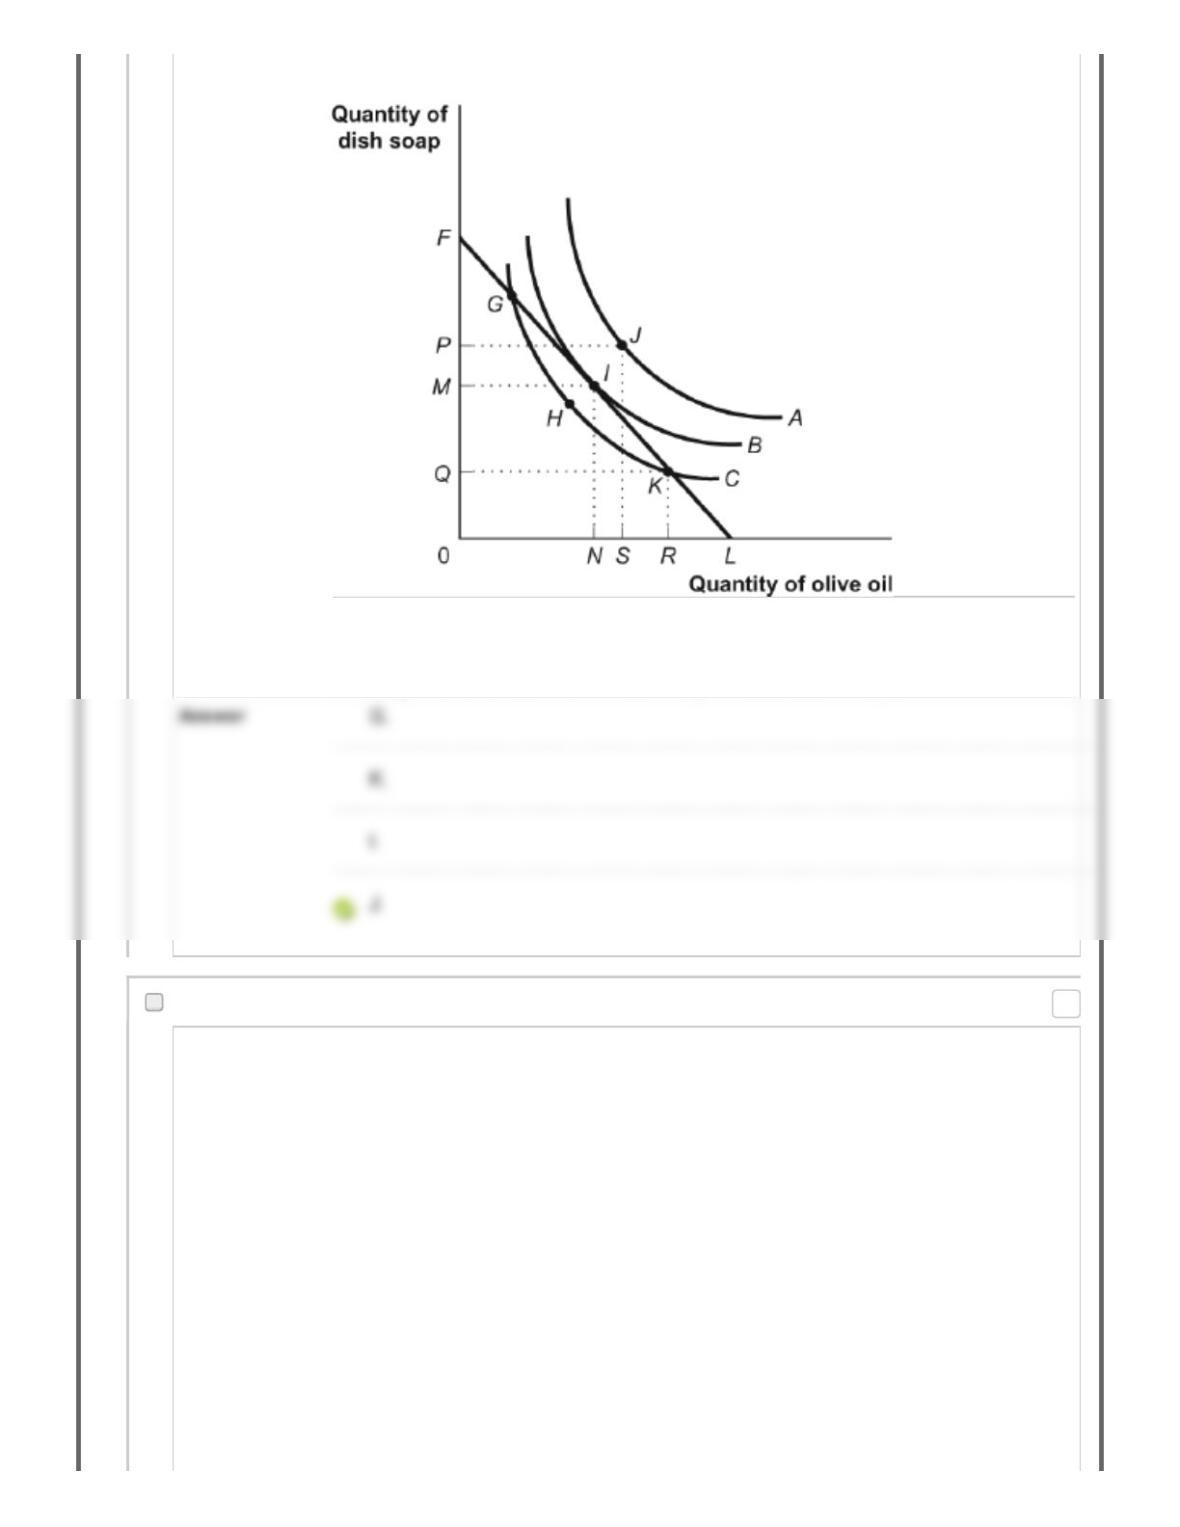
Figure: Consumer Equilibrium II
Reference: Ref 10-17
(Figure: Consumer Equilibrium II) Look at the figure Consumer Equilibrium II. Given
the budget constraint, a level of total utility not attainable is at point:
180. Multiple Choice: Figure: Consumer Equilibrium II Refer…
Question
Points: 0