Figure: Seasonally Adjusted Unemployment Rate
Source: Bureau of Labor Statistics, 2008.
Reference: Ref 2-16
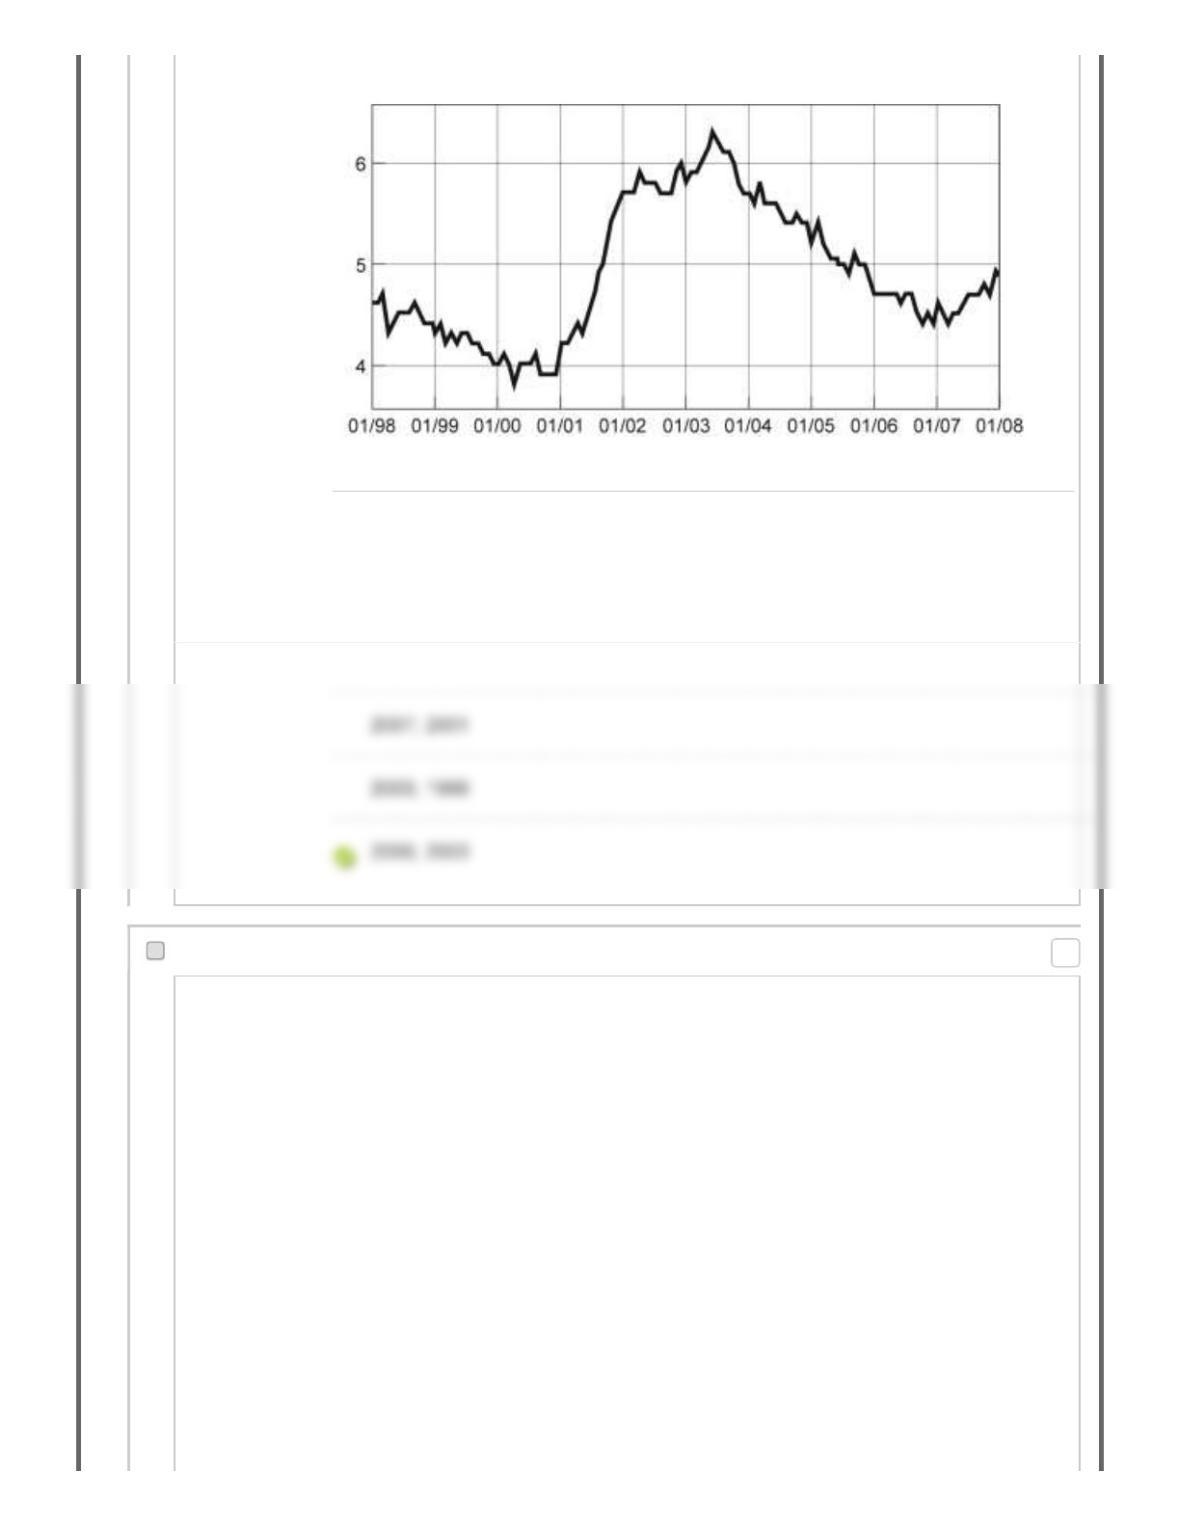
(Figure: Seasonally Adjusted Unemployment Rate) Look again at the figure
Seasonally Adjusted Unemployment Rate. The distance between each labeled
point on the horizontal axis is one year. Using this graph, the unemployment rate
was at a minimum in ________ and a maximum in ________.
Answer 2003; 2000
55. Multiple Choice: Figure: Labor Force Participation Rat...
Question
Points: 0
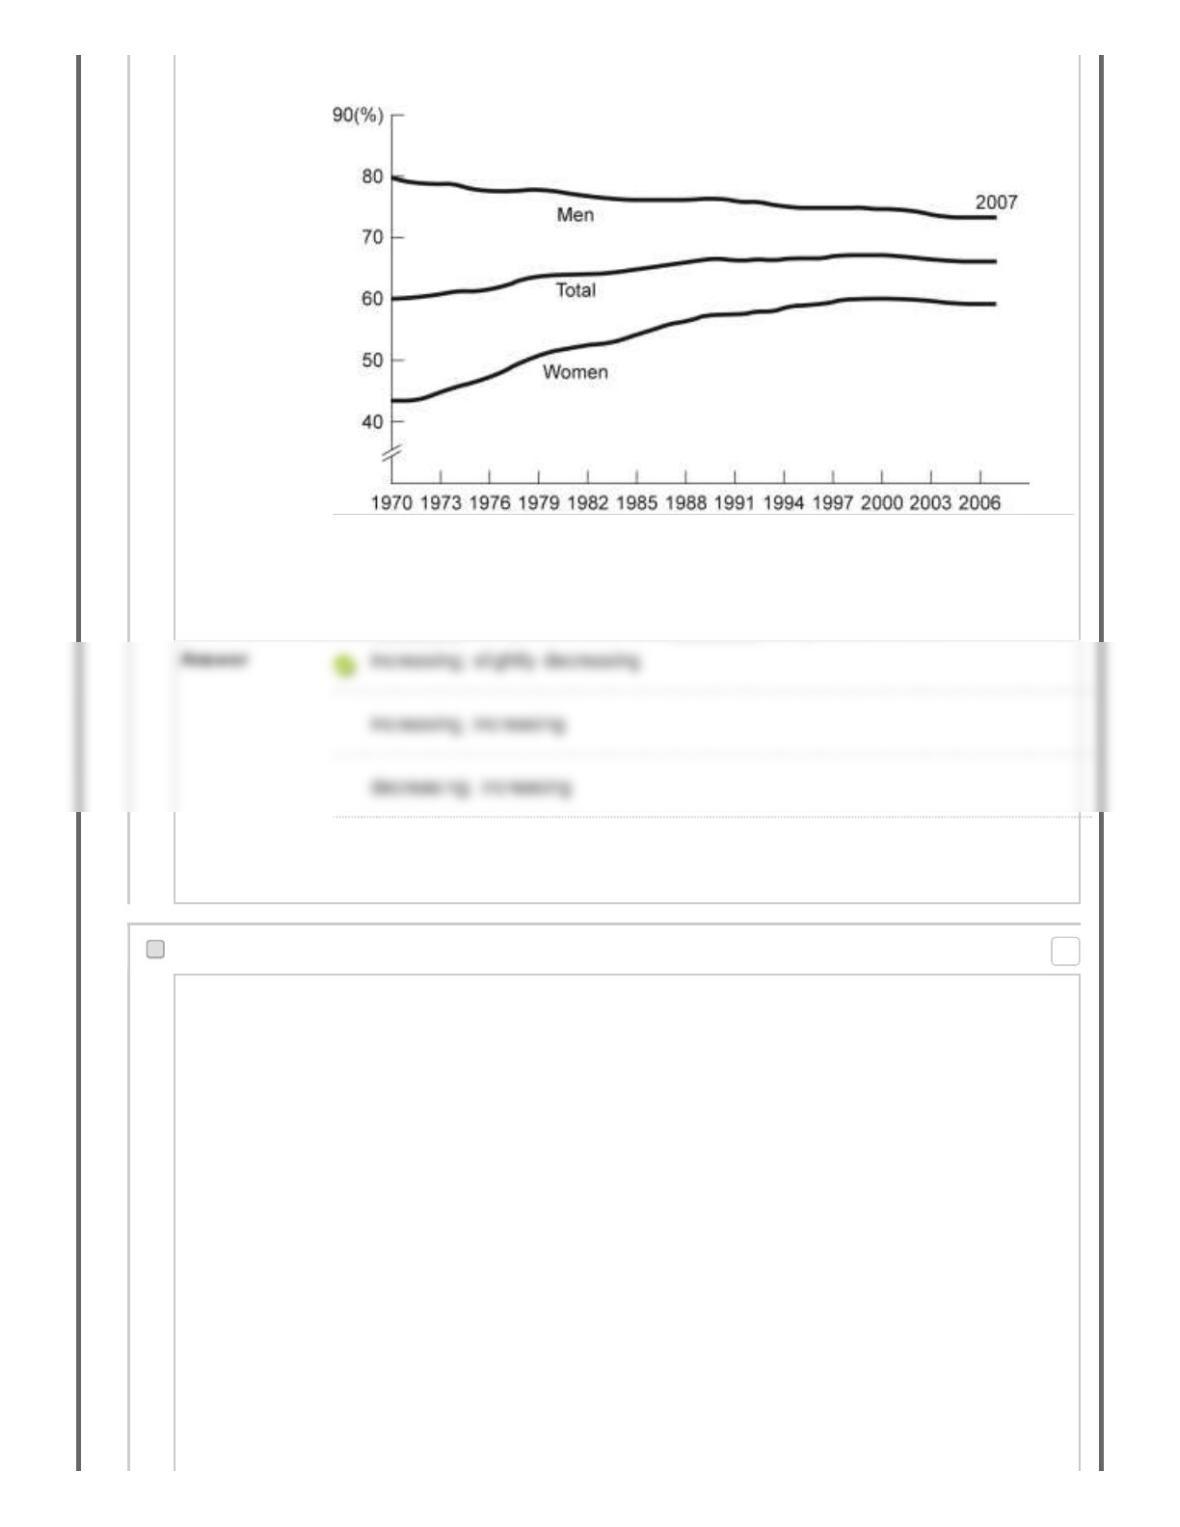
Figure: Labor Force Participation Rate
Reference: Ref 2-17
(Figure: Labor Force Participation Rate) Look at the figure Labor Force
Participation Rate. Using the figure, the labor force participation rate for women
was ________ during 1970–1985 and ________ during 1998–2006.
decreasing; constant
56. Multiple Choice: Figure: Labor Force Participation Rat...
Question
Points: 0
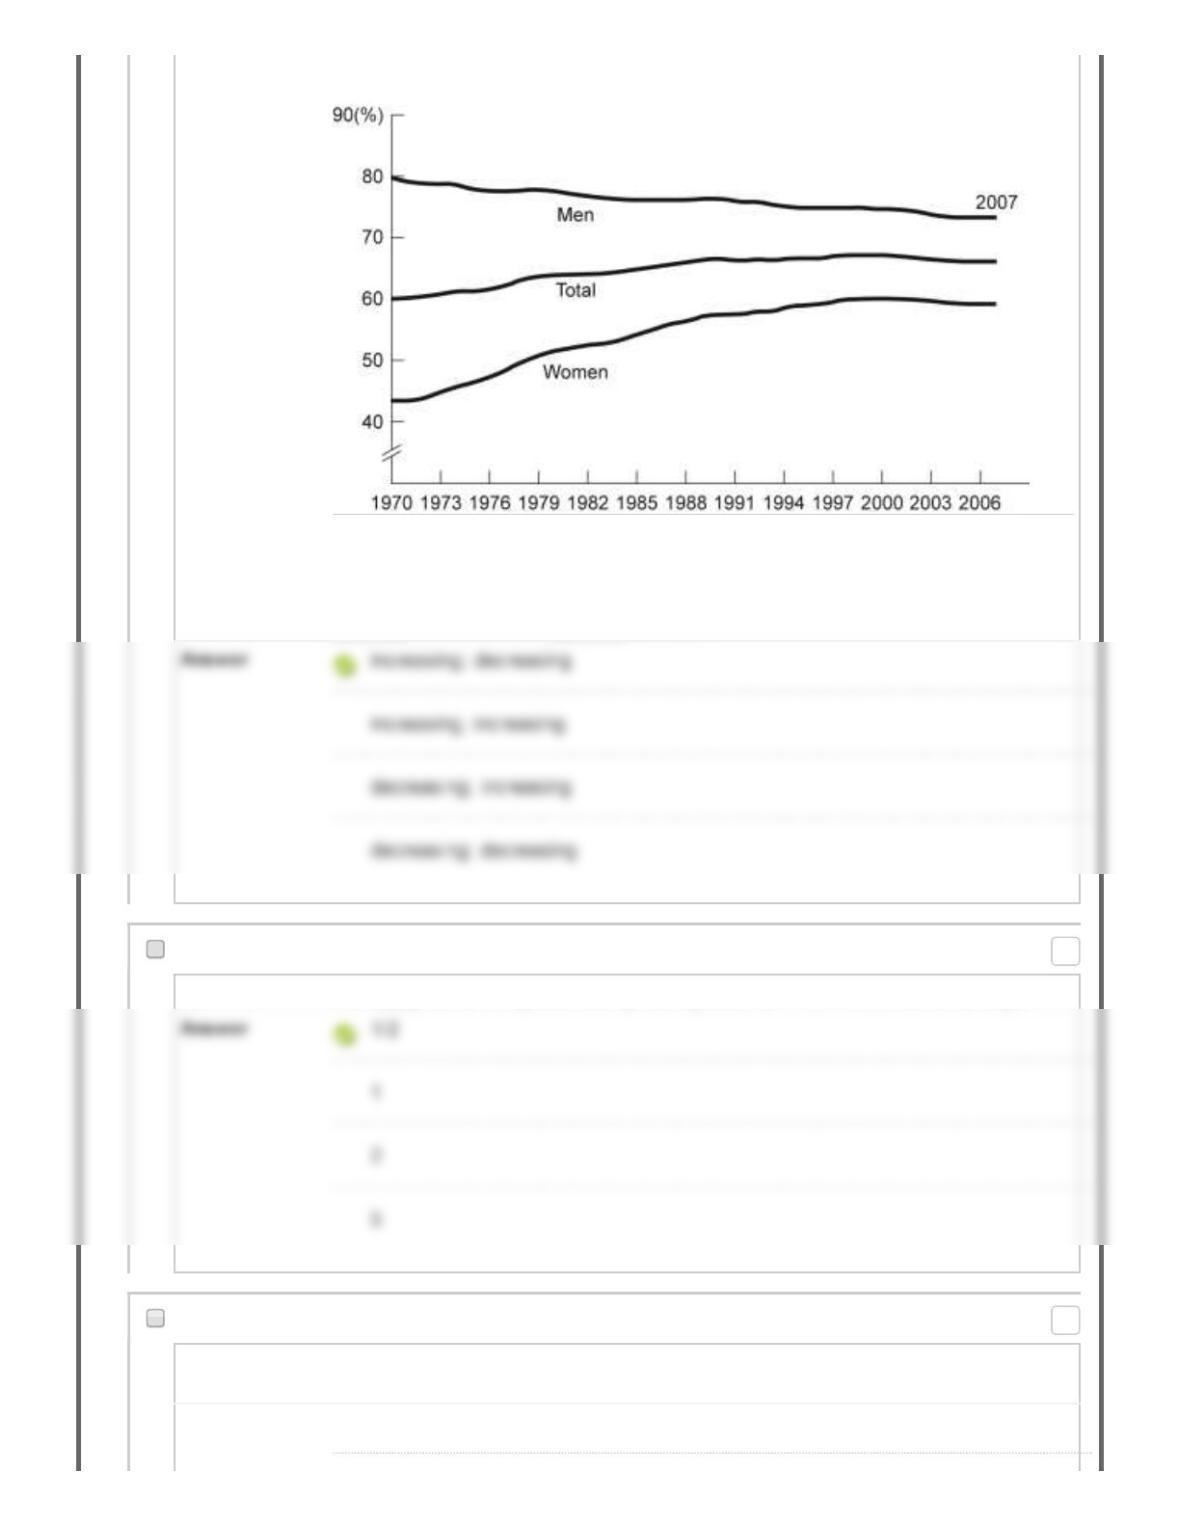
Figure: Labor Force Participation Rate
Reference: Ref 2-17
(Figure: Labor Force Participation Rate) Look at the figure Labor Force
Participation Rate. During 1970–1985, the labor force participation rate was
_______ for women and _______ for men.
57. Multiple Choice: If a supply curve is represented by t...
Question If a supply curve is represented by the equation Q = 10 + 2P, what is its slope?
58. Multiple Choice: Your boss asks you to graph company p...
Question Your boss asks you to graph company profits for the past 10 years. The best way
to show this information is with:
Answer a scatter diagram.
Points: 0
Points: 0

59. Multiple Choice: The owner of the Dismal Philosopher, ...
Question The owner of the Dismal Philosopher, one of five bookstores on College Road, asks
you to make a graph showing each bookstore’s share of all book purchases on
College Road. The best way to show this information is with:
Answer a scatter diagram.
60. Multiple Choice: Professor Macro wants to use a numeri...
Question Professor Macro wants to use a numerical graph to show the percentage of
government spending accounted for by its various components. Which of the
following graphs is most suitable for this purpose?
Answer bar graph
61. Multiple Choice: A positive relationship between swims...
Question A positive relationship between swimsuits purchased and ice cream purchased
could be the result of:
Answer reverse causality.
Points: 0
Points: 0
Points: 0
62. Multiple Choice: Taylor sees a bar graph showing the a...
Question Taylor sees a bar graph showing the average weight of adult males over the past
200 years and concludes that men get more obese over time. Taylor‘s conclusion
may be wrong, since she did not consider:
Answer the features of construction.
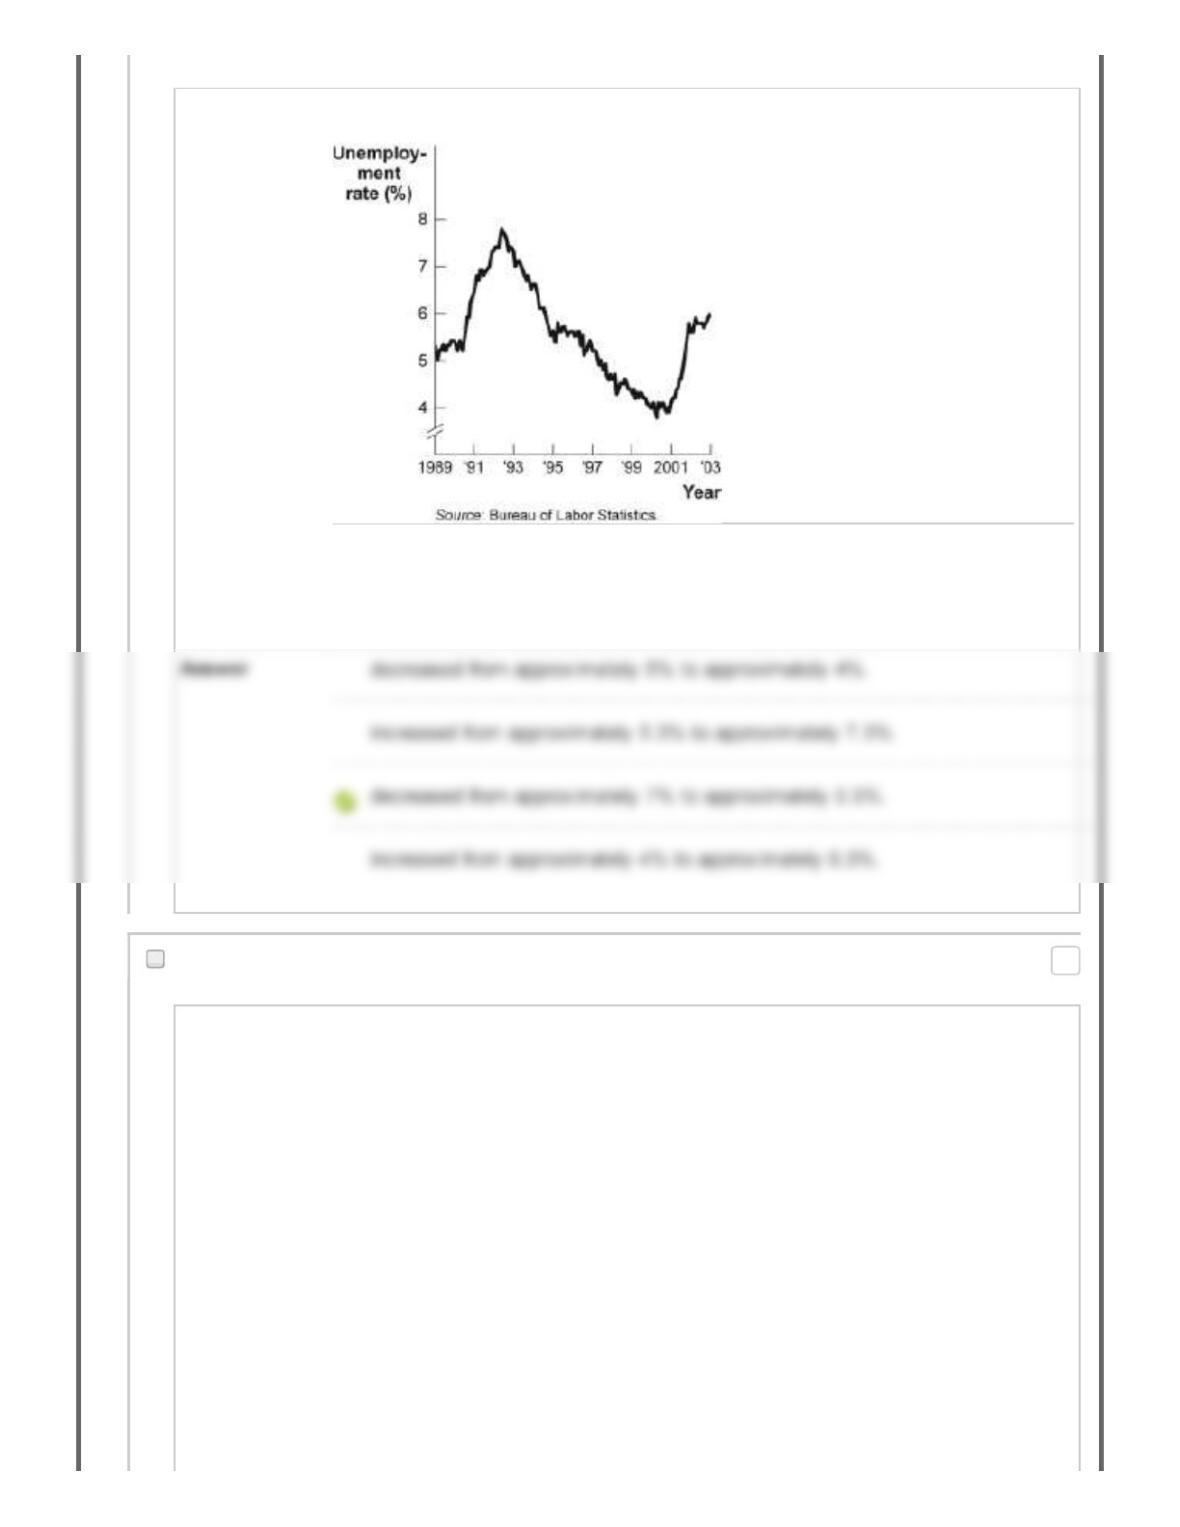
63. Multiple Choice: Figure: Unemployment Rate over Time R…
Question Figure: Unemployment Rate over Time
Reference: Ref 2-18
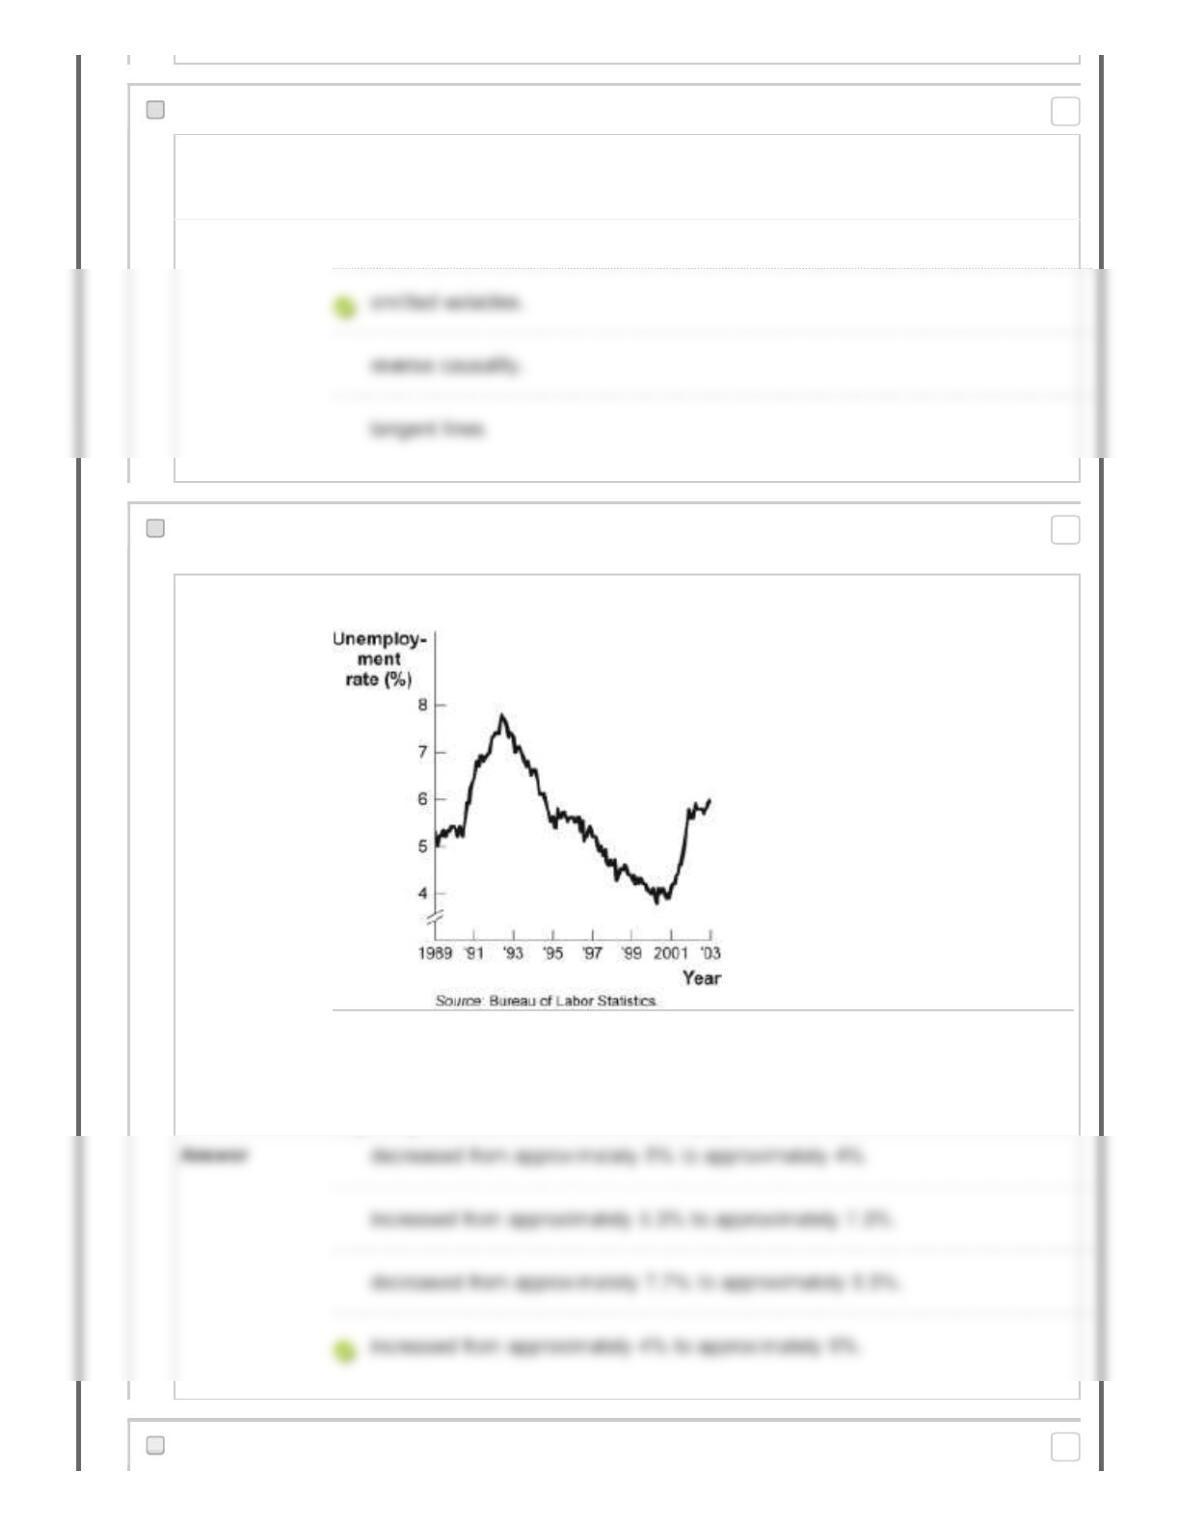
(Figure: Unemployment Rate over Time) Look at the figure Unemployment Rate
over Time. In the time-series graph, as we move from the beginning of 2001 to the
beginning of 2003, we see that the unemployment rate has:
64. Multiple Choice: Figure: Unemployment Rate over Time R…
Points: 0
Points: 0
Points: 0
Question Figure: Unemployment Rate over Time
Reference: Ref 2-18
(Figure: Unemployment Rate over Time) Look again at the figure Unemployment
Rate over Time. In the time-series graph, as we move from 1993 to 1995, we see
that the unemployment rate has:
65. Multiple Choice: Figure: Unemployment Rate over Time R…
Question
Points: 0
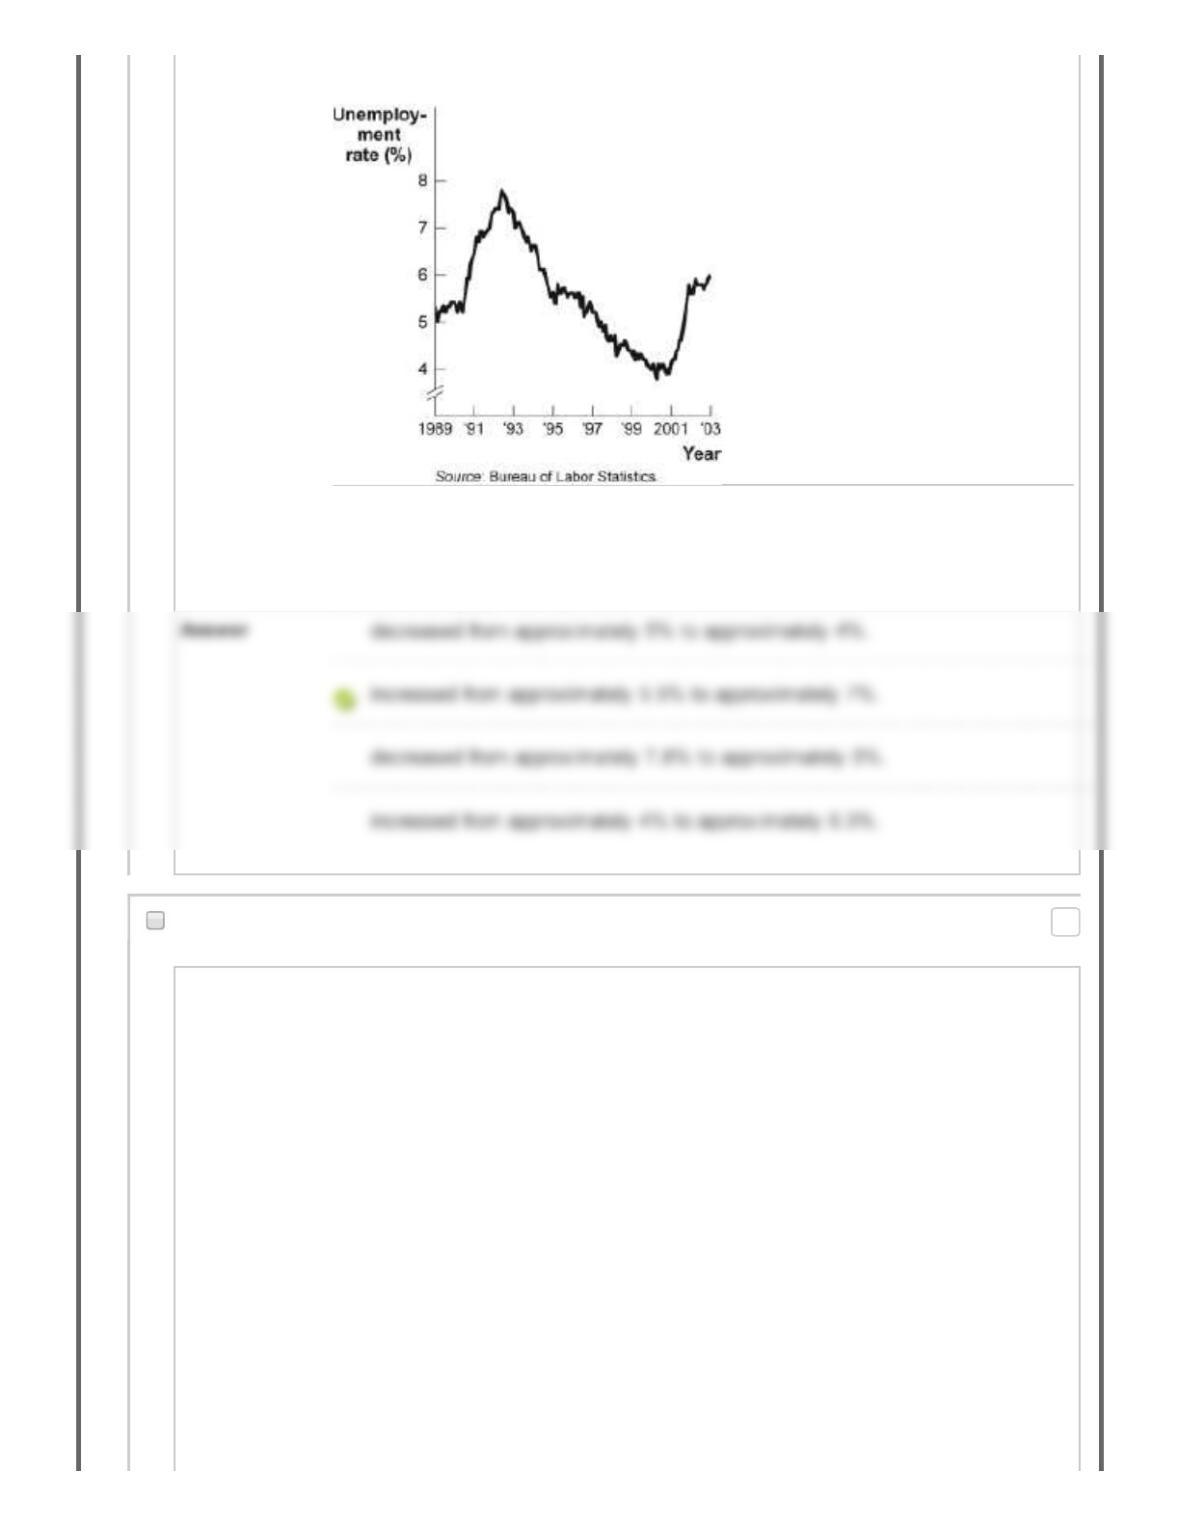
Figure: Unemployment Rate over Time
Reference: Ref 2-18
(Figure: Unemployment Rate over Time) Look again at the figure Unemployment
Rate over Time. In the time-series graph, as we move from 1991 to 1993, we see
that the unemployment rate has:
66. Multiple Choice: Figure: Unemployment Rate over Time R…
Question
Points: 0
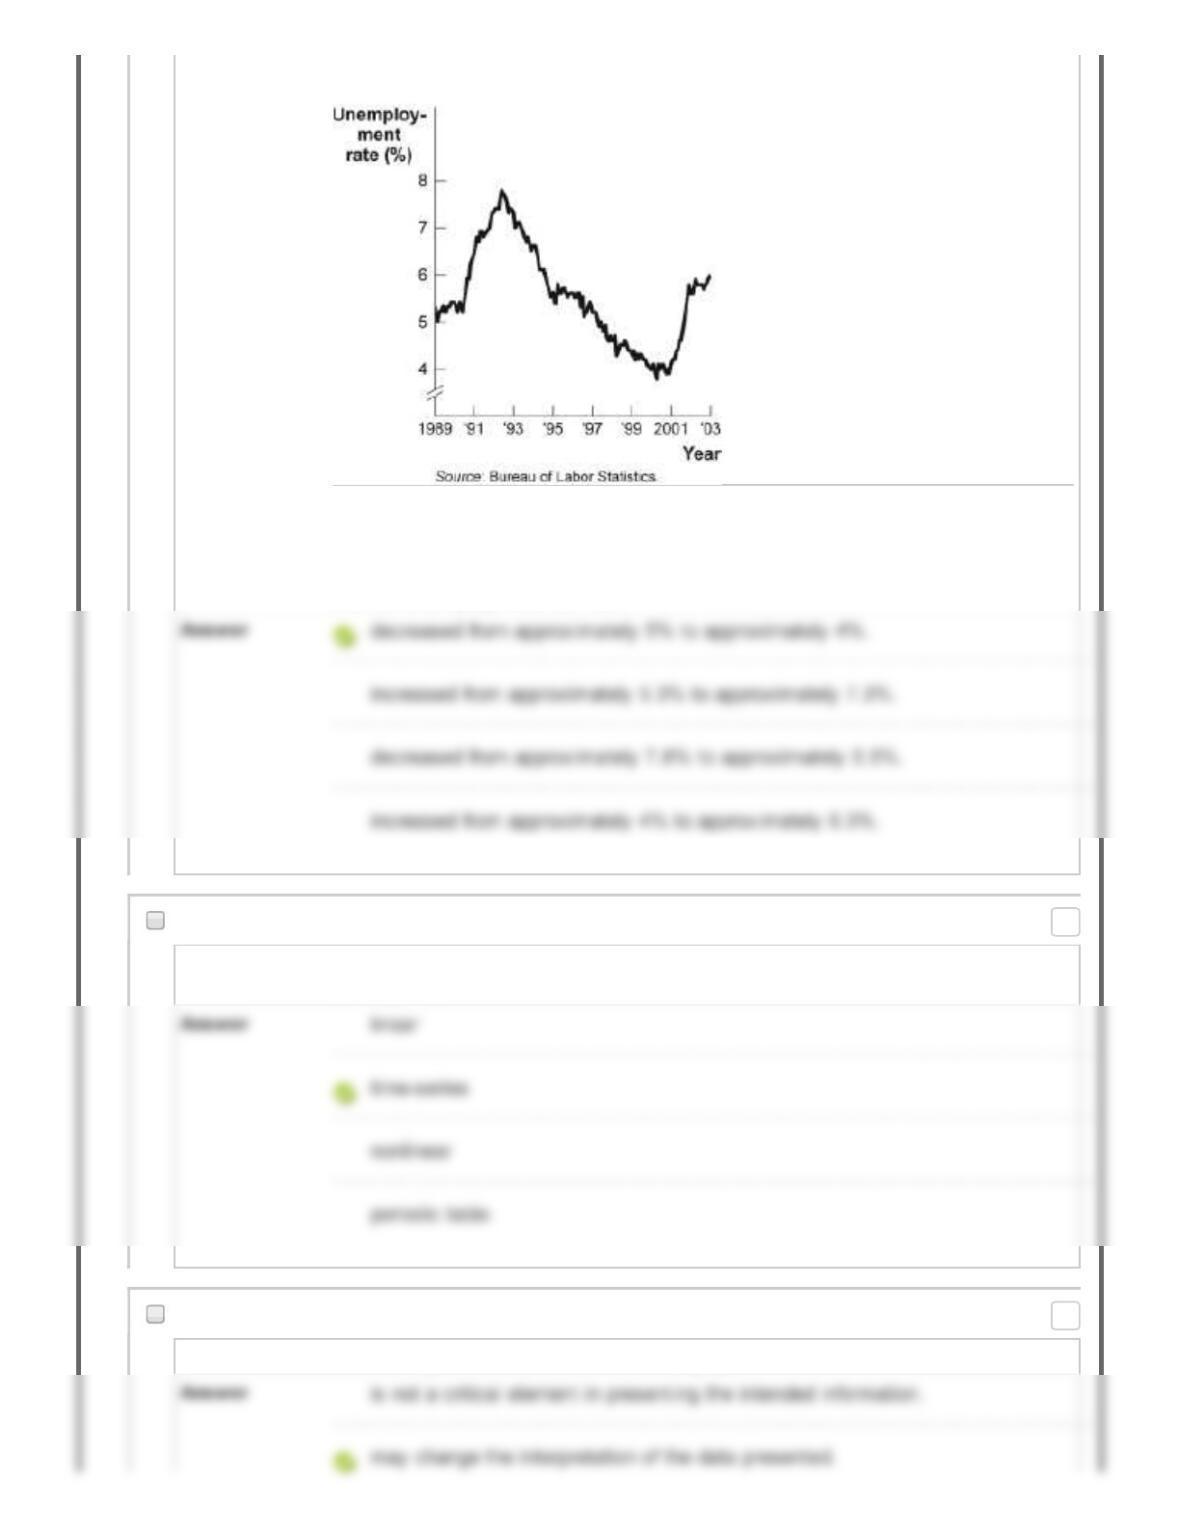
Figure: Unemployment Rate over Time
Reference: Ref 2-18
(Figure: Unemployment Rate over Time) Look again at the figure Unemployment
Rate over Time. In the time-series graph, as we move from 1997 to 2001, we see
that the unemployment rate has:
67. Multiple Choice: A ________ graph shows how the value ...
Question A ________ graph shows how the value of one or more variables have changed over
some period.
68. Multiple Choice: The scaling of the axes of a time-ser...
Question The scaling of the axes of a time–series graph:
Points: 0
Points: 0
69. Multiple Choice: In a time-series graph, large changes...
Question In a time–series graph, large changes can be made to appear trivial by:
70. Multiple Choice: A scatter diagram shows:
Question A scatter diagram shows:
71. Multiple Choice: The fact that two variables always mo...
Question The fact that two variables always move together over time:
72. Multiple Choice: A pie chart is used to depict informa…
Question A pie chart is used to depict information about:
Points: 0
Points: 0
Points: 0
Points: 0

73. Multiple Choice: A bar graph:
Question A bar graph:
74. Multiple Choice: In looking at a chart of the positive…
Question In looking at a chart of the positive relationship between police officers and crime,
the mayor remarks that more police officers create more crime. The mayor may be
wrong because she did not consider:
75. Essay: An economist wishes to build a model ...
Question An economist wishes to build a model to explain the relationship between the
number of diamonds purchased every year and the average income of consumers
in that year. Which variable should be the dependent variable and which should be
the independent variable? All else equal, do you expect this relationship to be
positive or negative? Explain.
Answer
Points: 0
Points: 0
Points: 0

Delete Points Update Hide Question Details
Select: All None Select by Type:
– Question Type –
OK