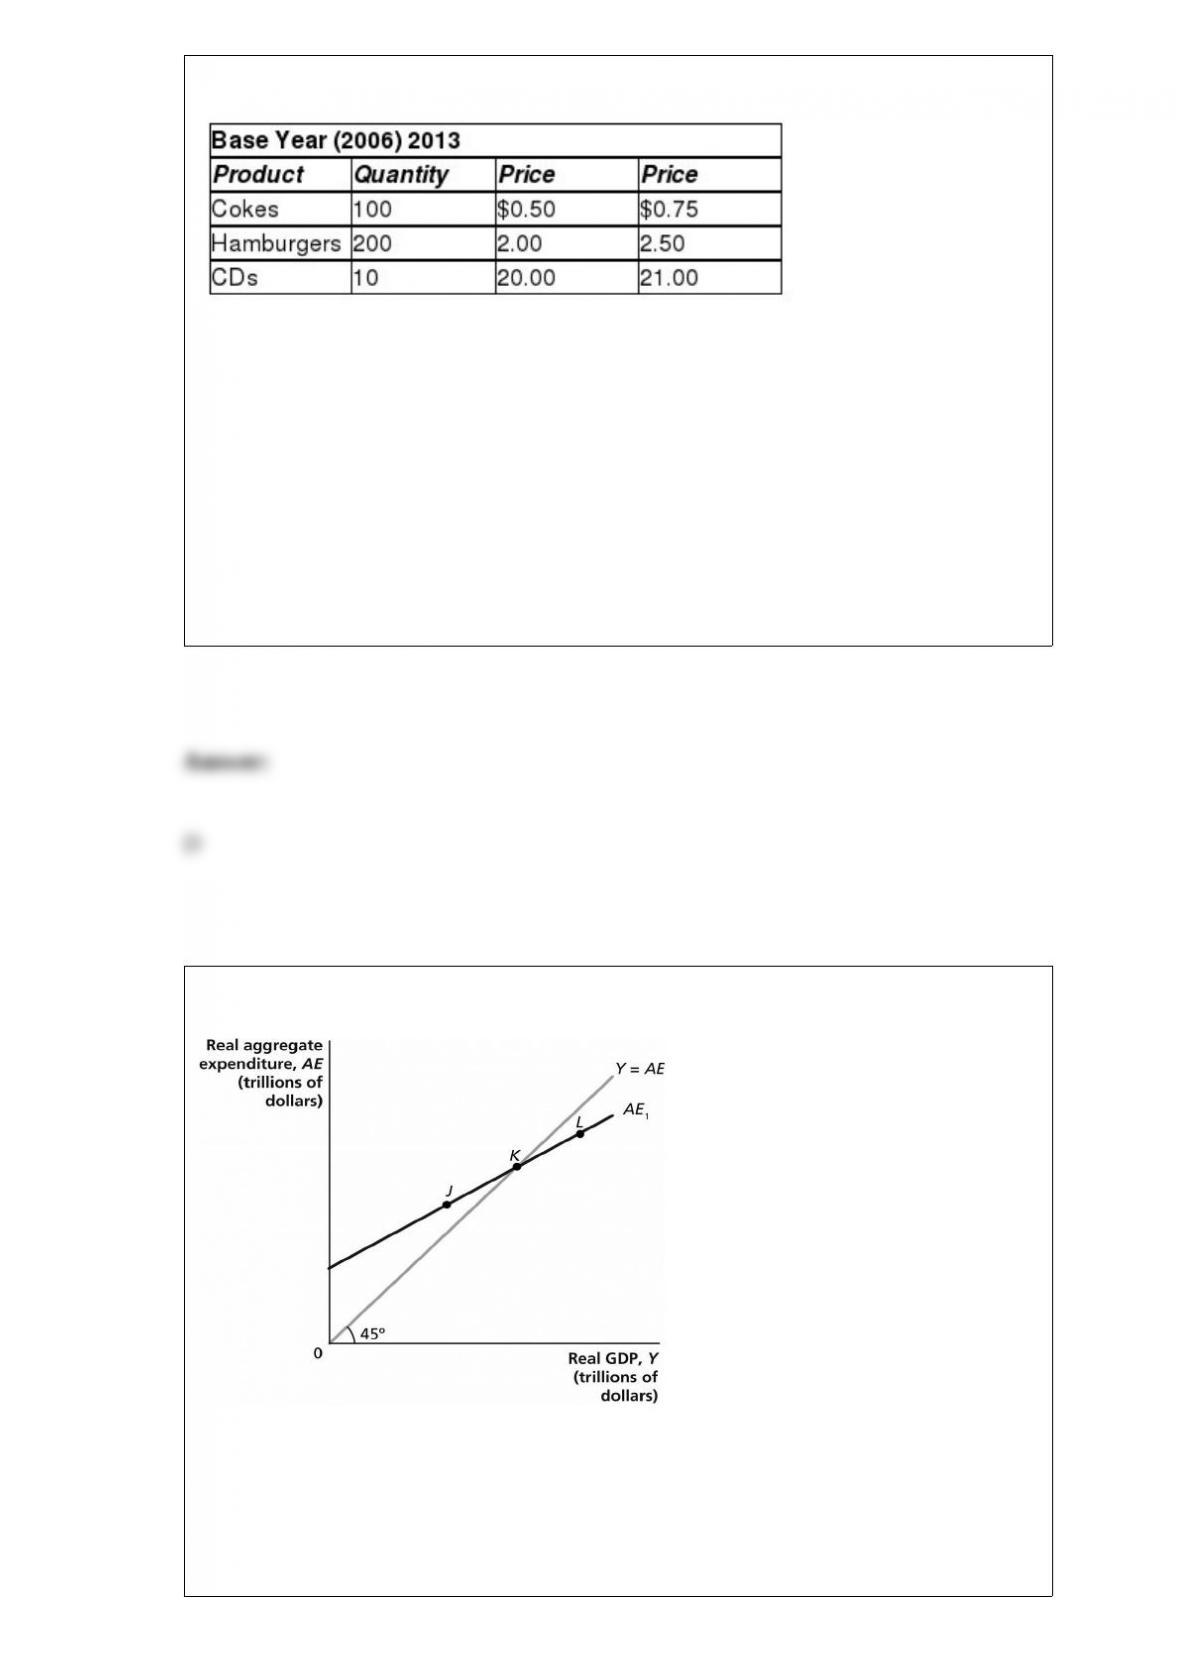
Table 9-3
Refer to Table 9-3. Assume the market basket for the consumer price index has three
products € Cokes, hamburgers, and CDs € with the following values in 2006 and 2013
for price and quantity: The Consumer Price Index for 2013 equals
A) 75.
B) 93.
C) 108.
D) 121.
Figure 12-1
Refer to Figure 12-1. According to the figure above, at what point is aggregate
expenditure less than GDP?
A) J
B) K

C) L
D) none of the above
The short-run Phillips curve is ________ than the long-run Phillips curve.
A) flatter
B) steeper
C) less stable
D) Both B and C are correct.
Which of the following is a true statement about real and nominal GDP?
A) If nominal GDP increases from one year to the next, we know that production of
goods and services has risen.
B) Nominal GDP is a better measure than real GDP in comparing changes in the
production of goods and service year after year.
C) Increases in average prices do not affect the calculation of nominal GDP.
D) If real GDP increases from one year to the next, we know that production of goods
and services has risen.

Which of the following is an example of a worker experiencing frictional
unemployment?
A) A worker quits his job at the Post Office to find more interesting work.
B) A computer programmer loses her job because it is outsourced to India.
C) An employee is laid off because the economy is suffering a recession.
D) A United Airlines pilot loses her job because of lack of demand for air travel.
Falling interest rates can
A) increase a firm’s stock price, which causes firms to issue more stock shares, and thus
increases funds for investment.
B) raise the cost of borrowing for firms and decrease investment.
C) raise the cost of buying new homes and fewer new homes will be purchased.
D) lower the cost of buying new homes and fewer new homes will be purchased.

Which of the following will shift the aggregate demand curve to the left, ceteris
paribus?
A) an increase in interest rates
B) an increase in disposable income
C) an increase in expected profits for firms
D) an increase in net exports
If GDP grows at a rate of 3% per year, approximately how long will it take for GDP to
double in size?
A) 12 years
B) 21 years
C) 23 years
D) 35 years
Figure 11-1
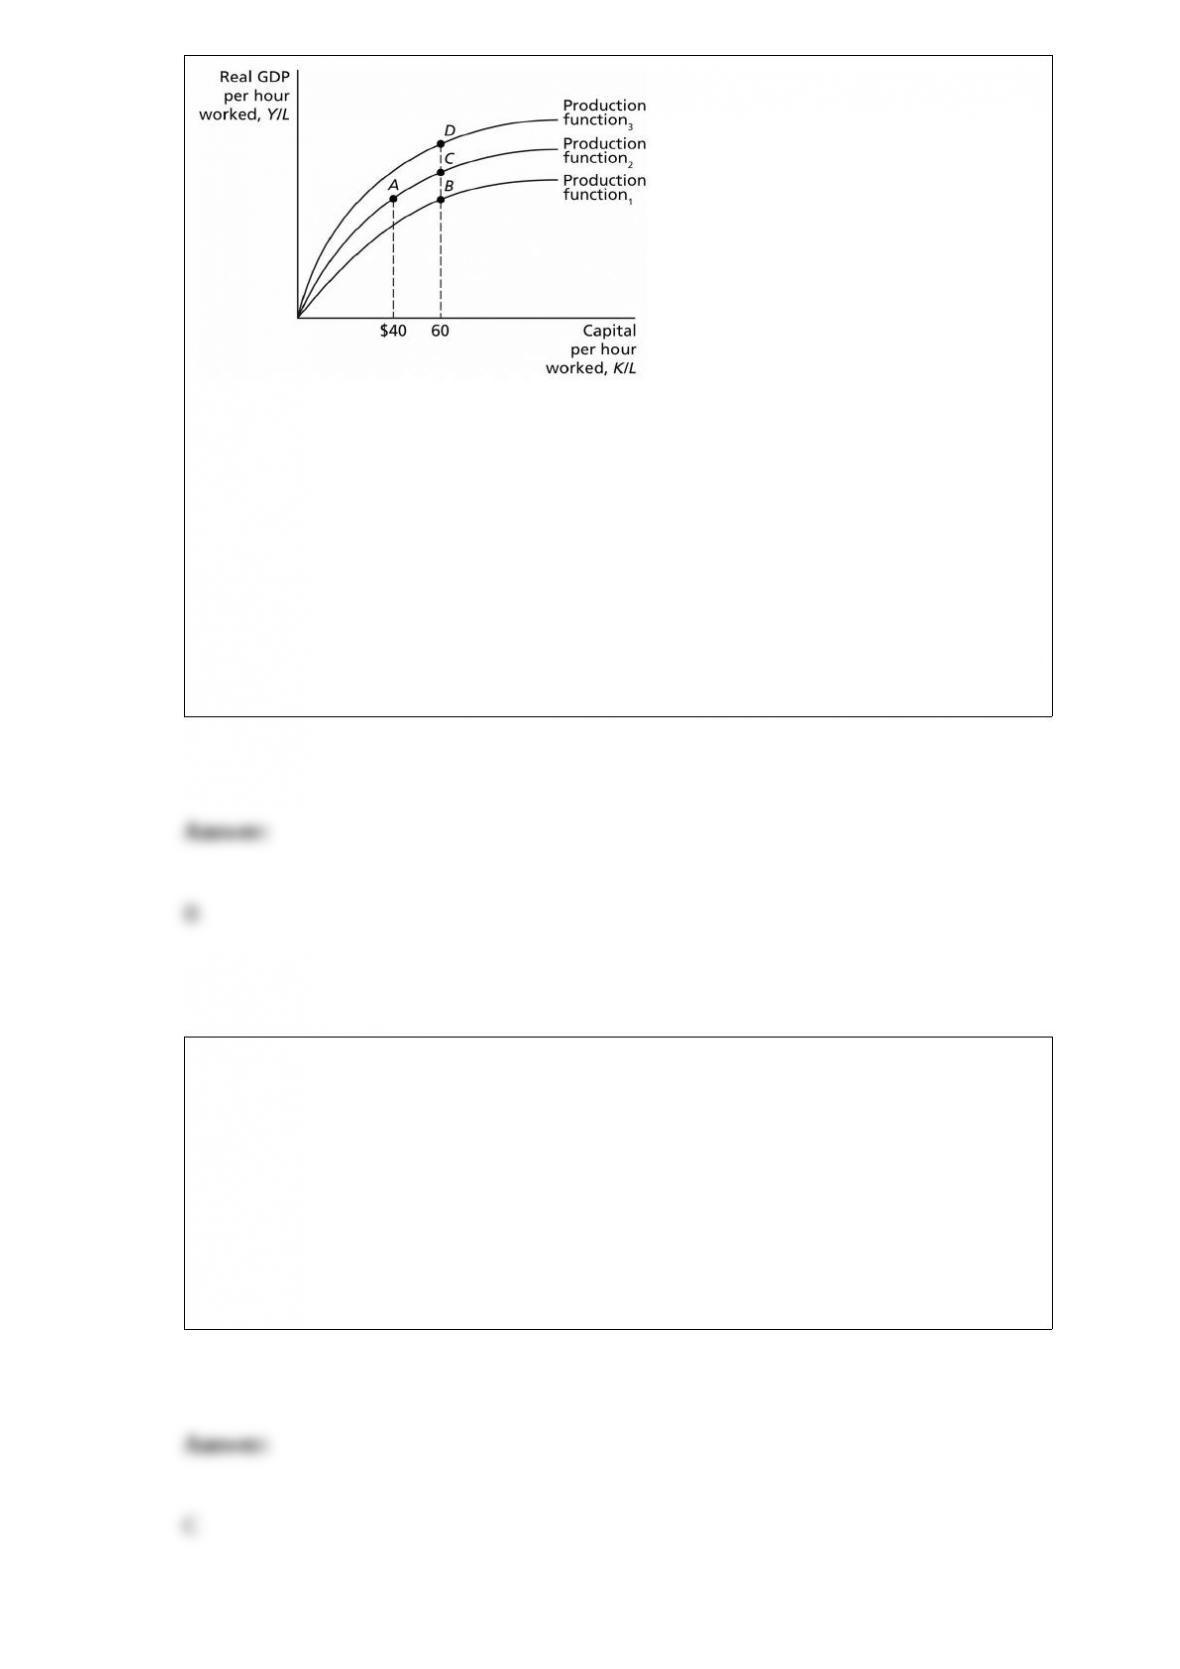
Refer to Figure 11-1. Suppose the per-worker production function in the figure above
represents the production function for the U.S. economy. If the United States decided to
double its support of university research, this would cause a movement from
A) A to B.
B) B to C.
C) B to A.
D) D to C.
If an economy experiences deflation, the real interest rate
A) will be less than the nominal interest rate.
B) will be negative when the nominal interest rate is positive.
C) will be greater than the nominal interest rate.
D) will be equal to the deflation rate, so long as the nominal interest rate is positive.
If economists forecast an increase in aggregate expenditure, which of the following is
likely to occur?
A) GDP will rise.
B) GDP will fall.
C) Wages will fall.
D) Inventories will rise.
A decrease in aggregate expenditure has what result on equilibrium GDP?
A) Equilibrium GDP rises.
B) Equilibrium GDP is not affected by a decrease in aggregate expenditure.
C) Equilibrium GDP falls.
D) Equilibrium GDP may rise or fall depending on the size of the decrease in aggregate
expenditure relative to the initial level of GDP.
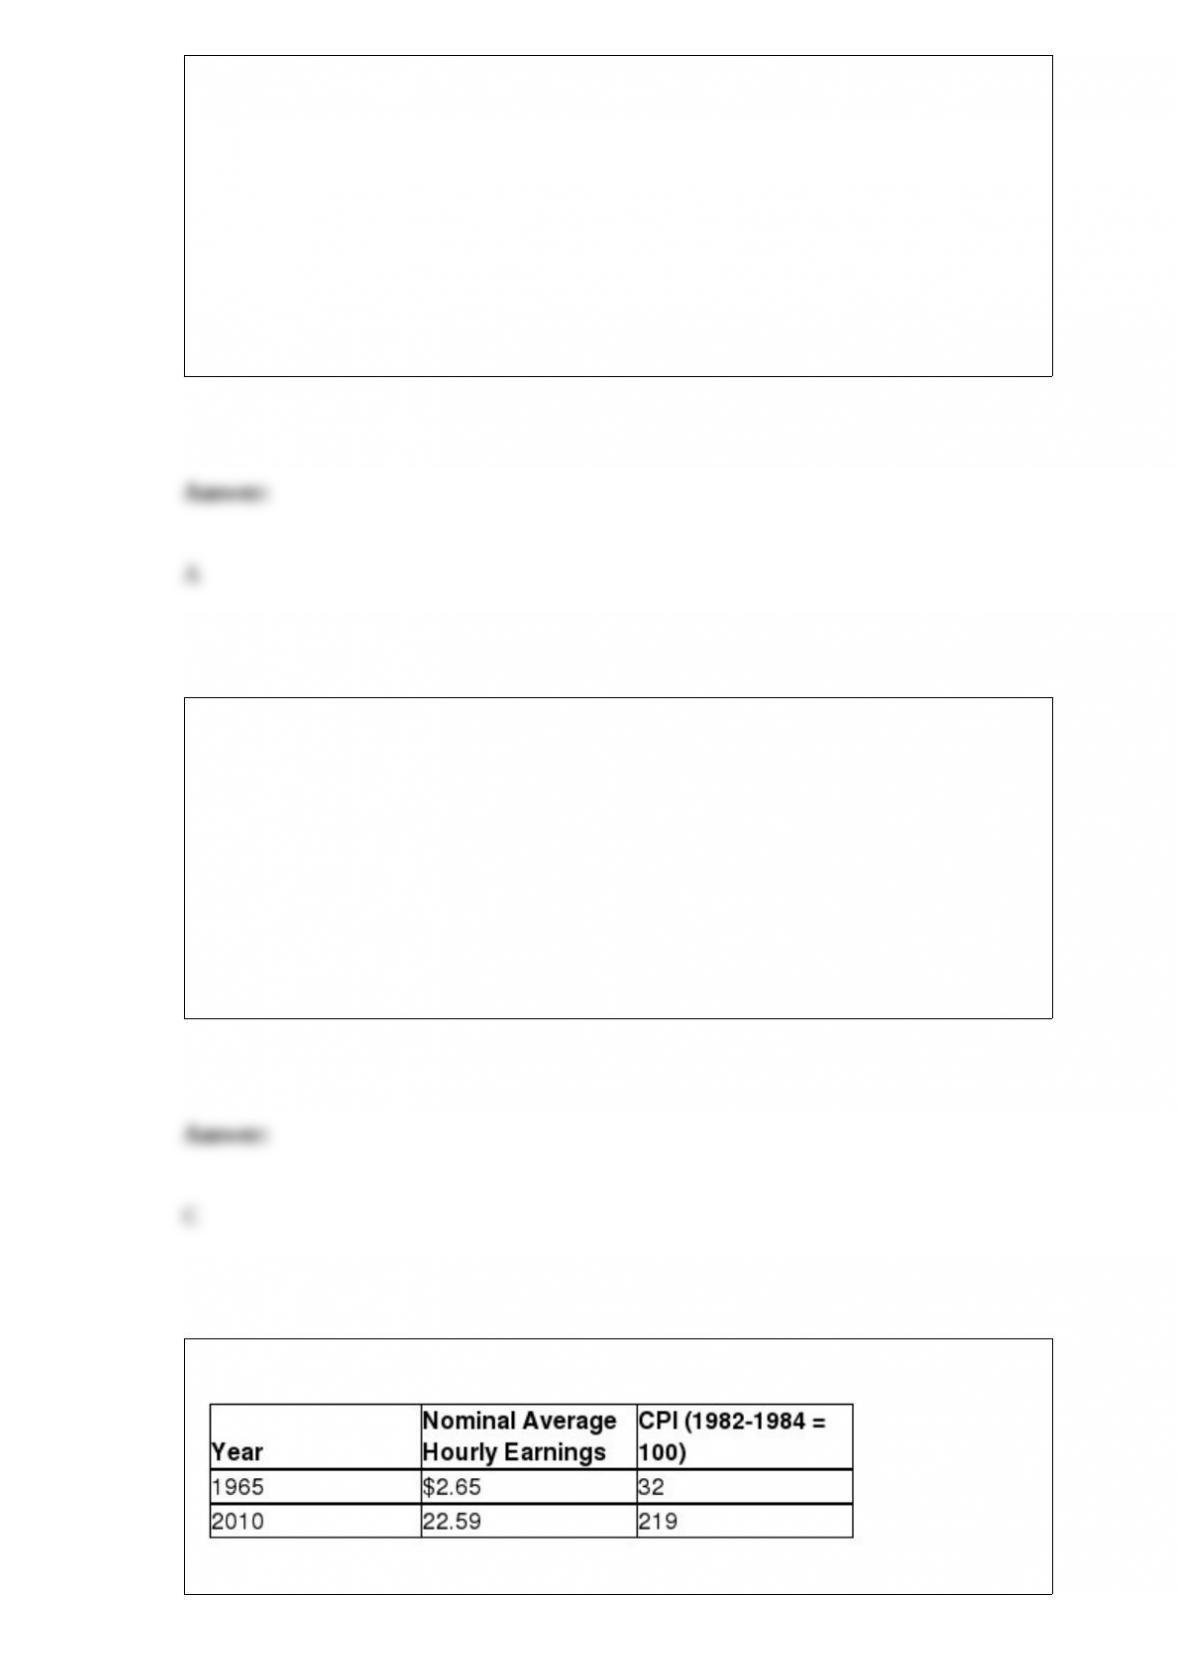
Table 9-14

The table above reports the nominal average hourly earnings in private industry and the
consumer price index for 1965 and 2010.
Refer to Table 9-14. The real average hourly earnings for 1965 in 1982-1984 dollars
equal
A) $1.28.
B) $6.49.
C) $8.28.
D) $15.45.