
Which of these activities will most likely impose an external cost?
a. Betty plants flowers in her garden.
b. Bonnie gets a flu vaccine.
c. Bridget drives her car after having too much alcohol to drink.
d. Becky buys a new flat screen television.
Table 58
IncomeQuantity of Good X
PurchasedQuantity of Good Y
Purchased
$30,000220
$40,000610
Refer to Table 58. Using the midpoint method, the income elasticity of demand for
good Y is
a. 2.33, and good Y is a normal good.
b. 2.33, and good Y is an inferior good.
c. 0.43, and good Y is a normal good.
d. 0.43, and good Y is an inferior good.
Figure 920
The figure illustrates the market for rice in Vietnam.
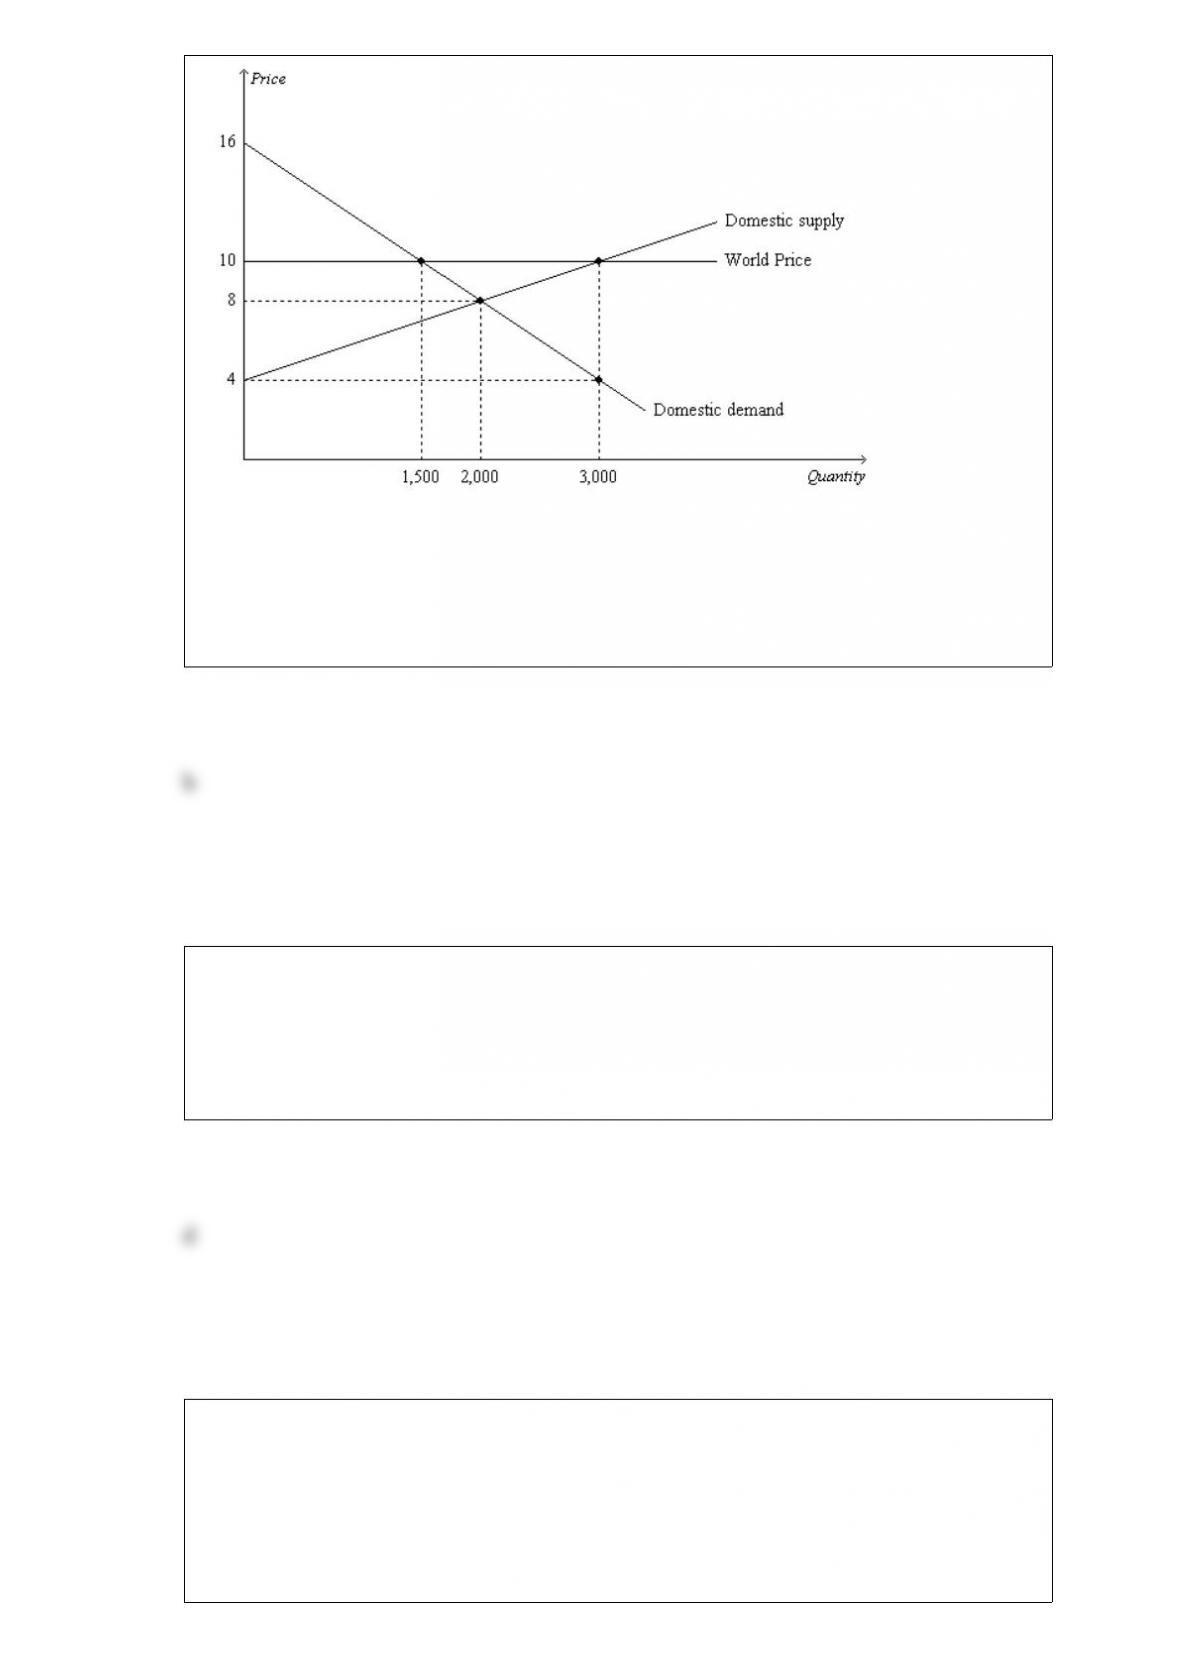
Refer to Figure 920. With trade, Vietnam will
a. export 1,000 units of rice.
b. export 1,500 units of rice.
c. import 1,000 units of rice.
d. import 1,500 units of rice.
Economists hold many positions advising the president and Congress including
a. being a member of the Council of Economic Advisers.
b. helping to enforce antitrust laws at the Department of Justice.
c. conducting research at the Congressional Budget Office.
d. All of these are possible positions that economists hold.
When a certain nation abandoned a policy of prohibiting international trade in
automobiles in favor of a freetree policy, the result was that the country began to import
automobiles. The change in policy improved the wellbeing of that nation in the sense
that
a. both producers of automobiles and consumers of automobiles in that nation became
better off as a result.

b. the gains to automobile producers in that nation exceeded the losses of the
automobile consumers in that nation.
c. the gains to automobile consumers in that nation exceeded the losses of the
automobile producers in that nation.
d. even though total surplus in that nation decreased, it was still true that consumer
surplus and producer surplus increased.
Cost is a measure of the
a. seller’s willingness to sell.
b. seller’s producer surplus.
c. producer shortage.
d. seller’s willingness to buy.
A improvement in production technology will shift the
a. supply curve to the right.
b. supply curve to the left.
c. demand curve to the right.
d. demand curve to the left.
Figure 727
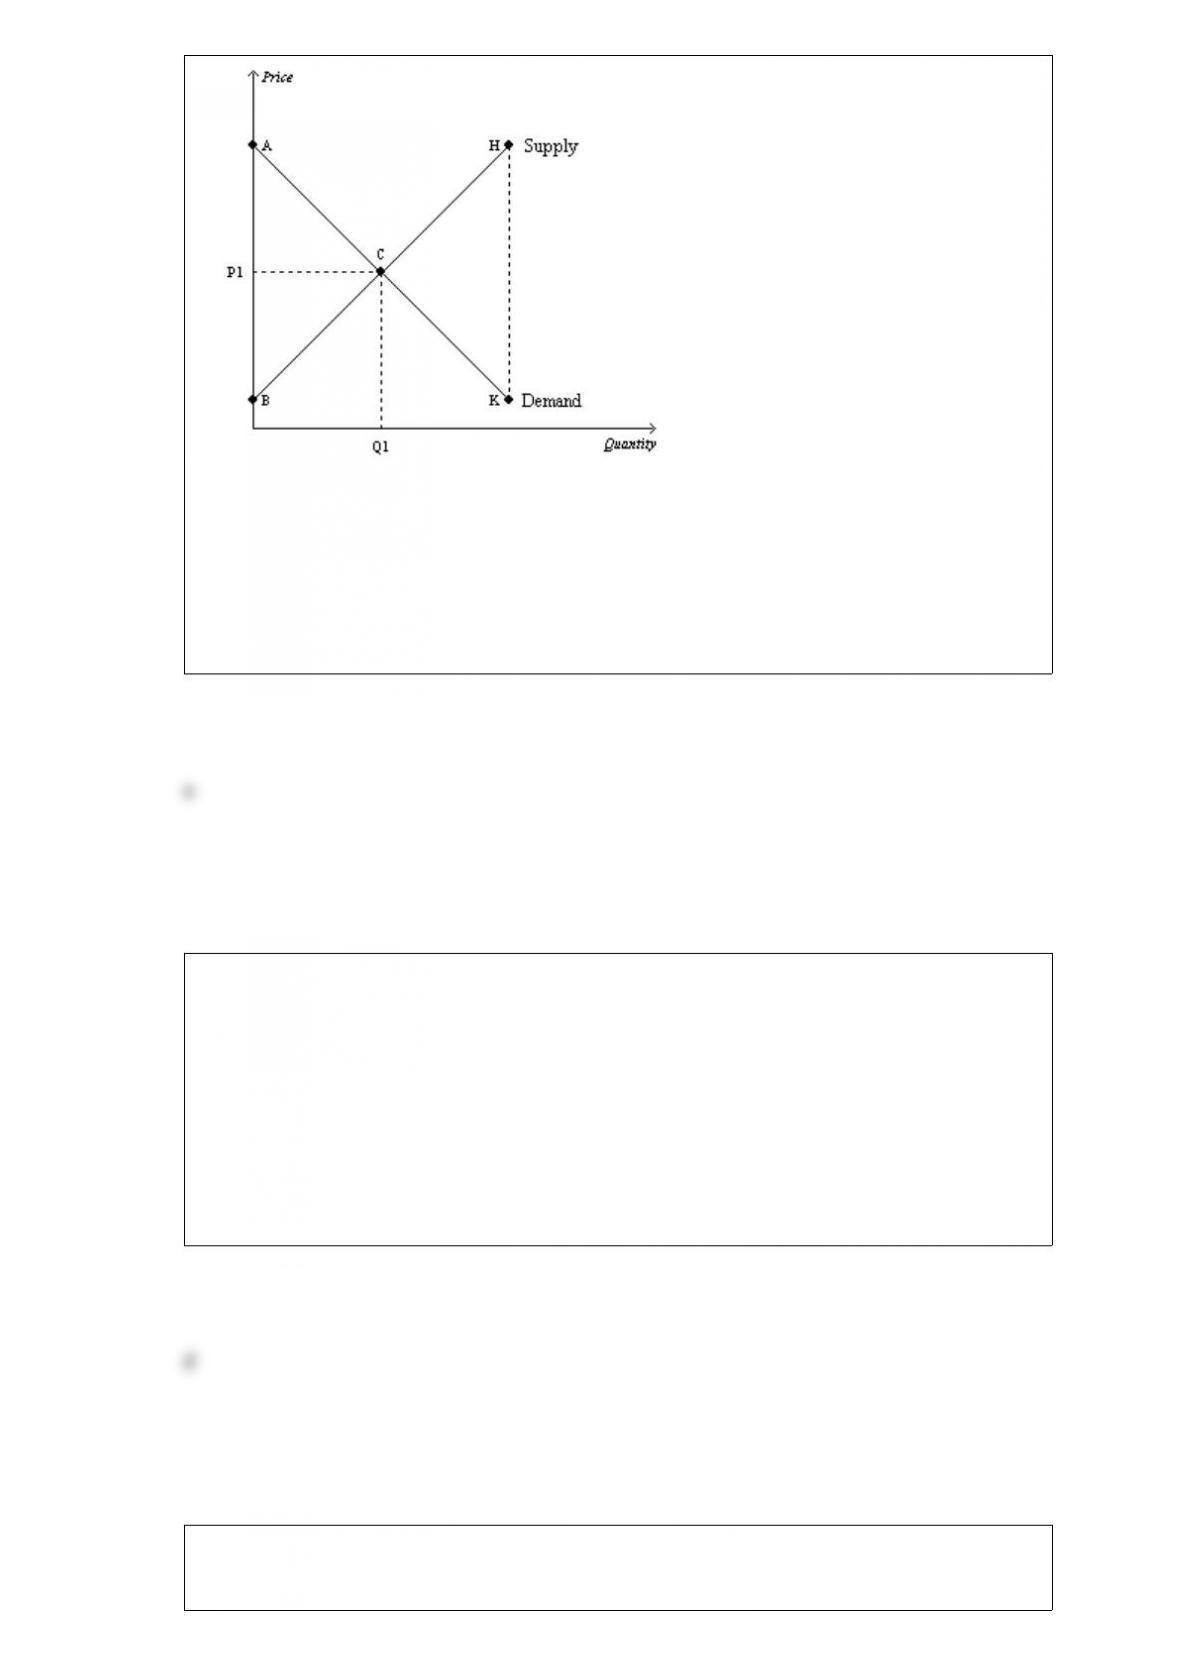
Refer to Figure 727. If the government mandated a price increase from P1 to a higher
price, then
a. total surplus would decrease.
b. consumer surplus would increase.
c. total surplus would increase, since producer surplus would increase.
d. total surplus would remain unchanged.
Rent control policies tend to cause
a. relatively smaller shortages in the short run than in the long run because supply and
demand tends to be more elastic in the short run than in the long run.
b. relatively larger shortages in the short run than in the long run because supply and
demand tends to be more elastic in the short run than in the long run.
c. relatively larger shortages in the short run than in the long run because supply and
demand tends to be more inelastic in the short run than in the long run.
d. relatively smaller shortages in the short run than in the long run because supply and
demand tends to be more inelastic in the short run than in the long run.
Which of the following events must cause equilibrium quantity to rise?
a. demand increases and supply decreases
b. demand and supply both decrease
c. demand decreases and supply increases
d. demand and supply both increase
Lawrence is a photographer. He has $230 to spend and wants to buy either a flash for
his camera or a new tripod. Both the flash and tripod cost $230, so he can only buy one.
This illustrates the principle that
a. trade can make everyone better off.
b. people face tradeoffs.
c. rational people think at the margin.
d. people respond to incentives.
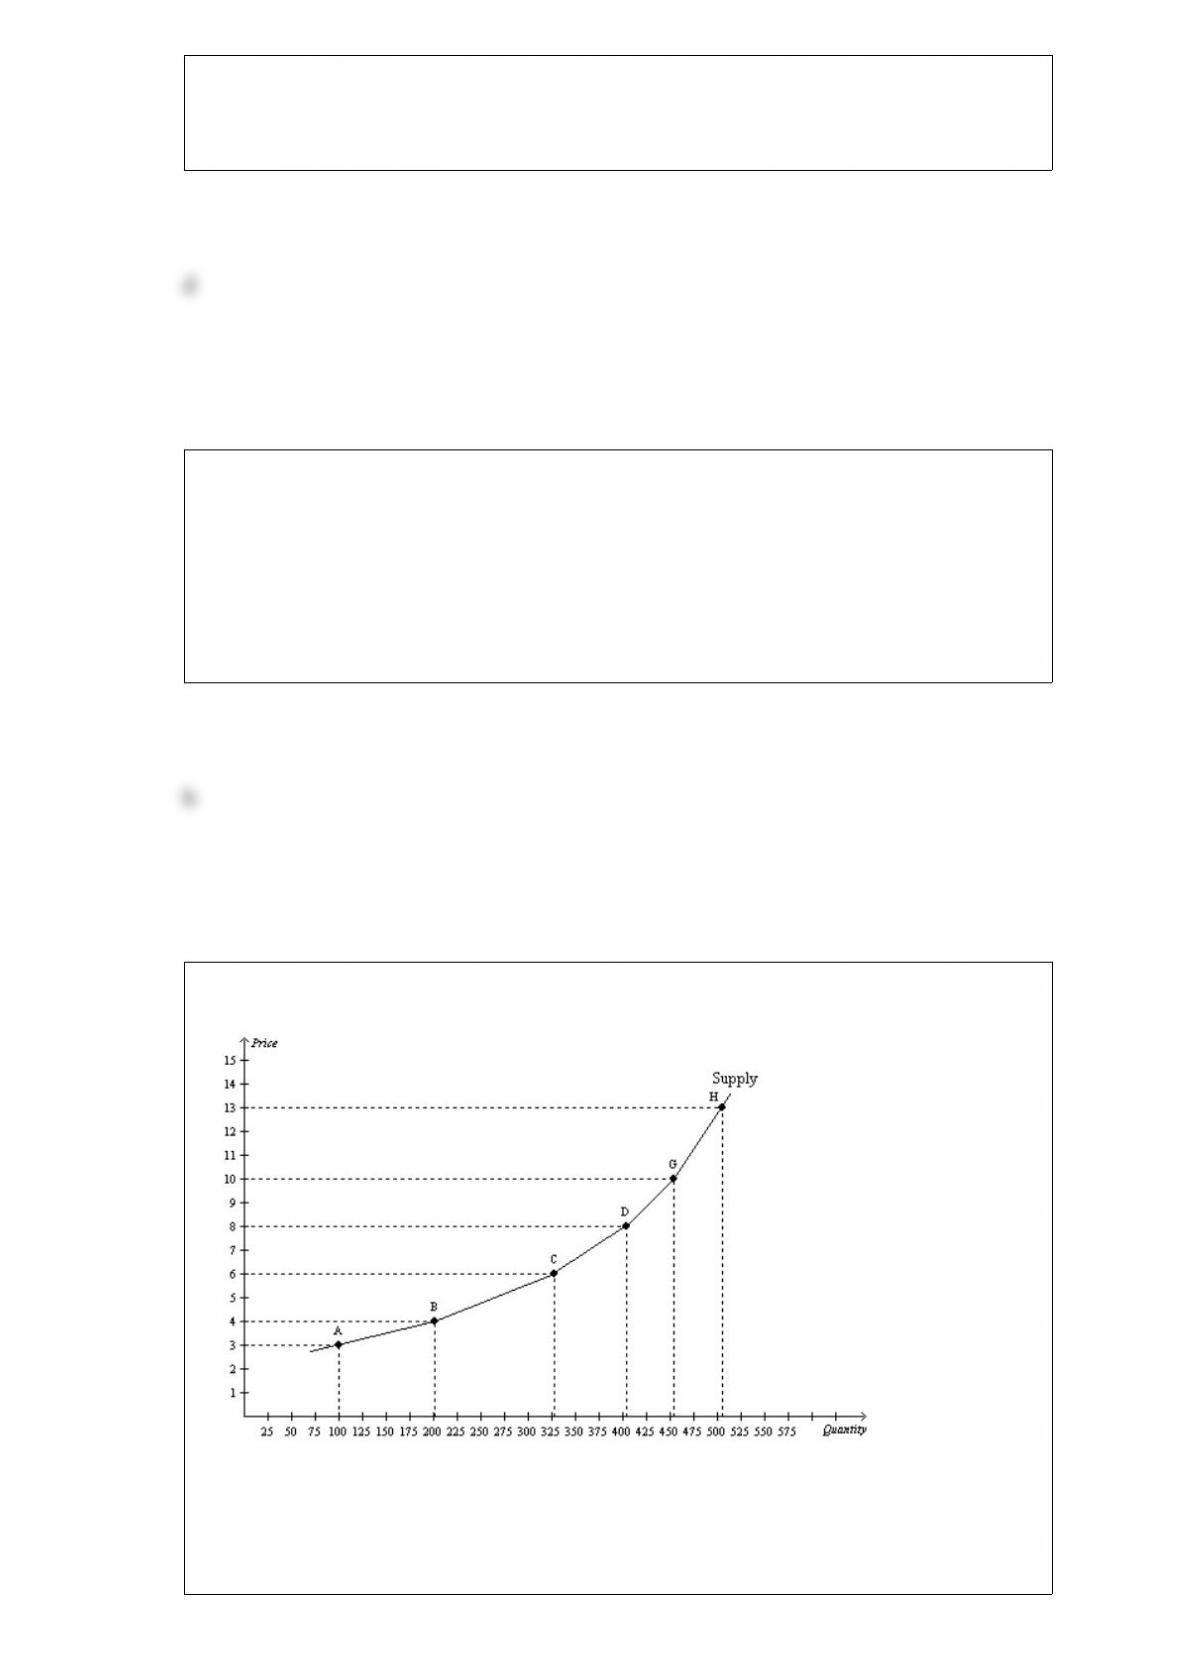
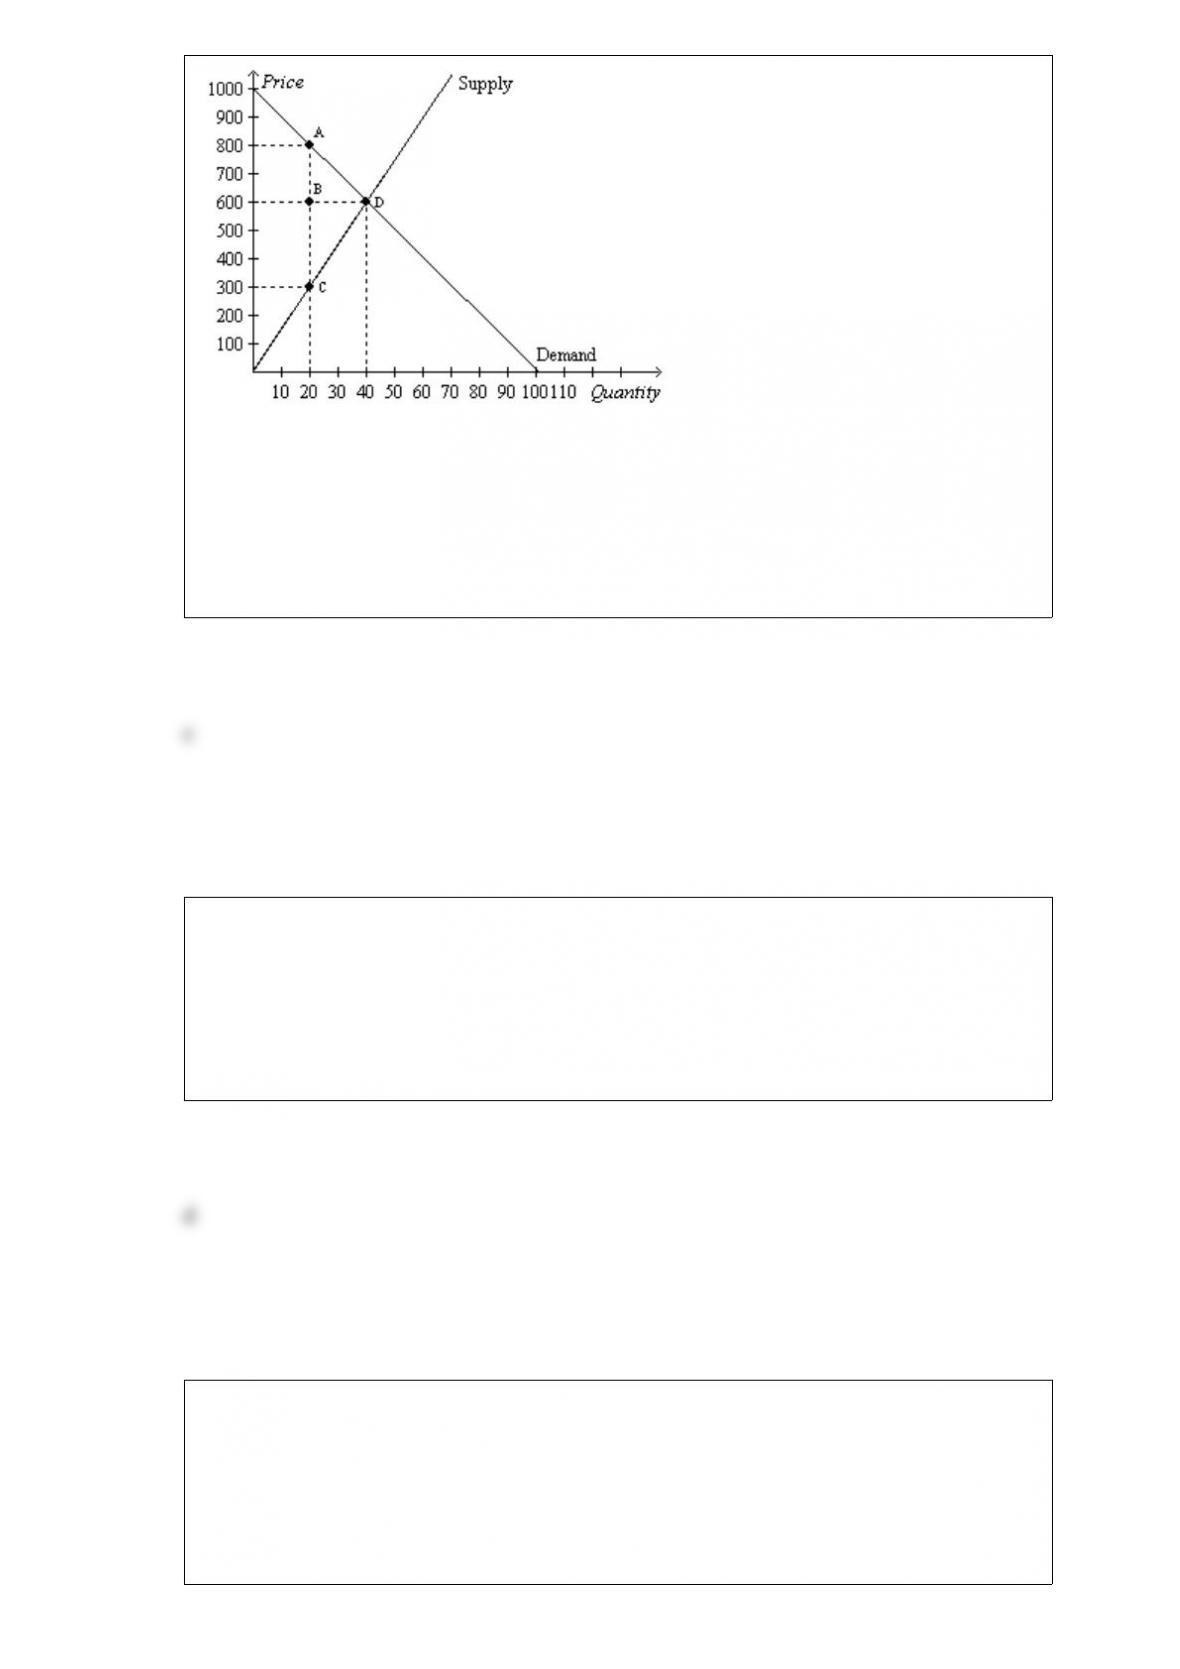
Figure 515
Refer to Figure 515. Using the midpoint method, what is the price elasticity of supply
between points C and D?
a. 0.21
b. 0.29

c. 0.73
d. 1.36
If the demand curve is linear and downward sloping, which of the following statements
is not correct?
a. Demand is more elastic on the lower part of the demand curve than on the upper part.
b. Different pairs of points on the demand curve can result in different values of the
price elasticity of demand.
c. Different pairs of points on the demand curve result in identical values of the slope of
the demand curve.
d. Starting from a point on the upper part of the demand curve, an increase in price
leads to a decrease in total revenue.
Table 25
Corn (in bushels)Wheat (in bushels)
20000
1600700
12001300
8001800
4002200
02500
Refer to Table 25. Table 25 shows one set of production possibilities. What is the
opportunity cost of increasing the production of corn from 400 bushels to 800 bushels?
a. 200 bushels of wheat
b. 400 bushels of wheat
c. 600 bushels of wheat
d. 800 bushels of wheat

A demand curve shows the relationship
a. between income and quantity demanded.
b. between price and income.
c. between price and quantity demanded.
d. among income, price, and quantity demanded.
The xcoordinate of an ordered pair specifies the
a. diagonal location of the point.
b. vertical location of the point.
c. horizontal location of the point.
d. quadrant location in which the point is located.
If a 30 percent change in price causes a 15 percent change in quantity supplied, then the
price elasticity of supply is about
a. 0.5, and supply is elastic.
b. 0.5, and supply is inelastic.
c. 2, and supply is inelastic.
d. 2, and supply is elastic.
Scenario 51

Suppose that when the average college student’s income is $10,000 per year, the annual
quantity demanded of Patty’s Pizza is 50 and the annual quantity demanded of Sue’s
Subs is 80. Suppose that when the price of Patty’s Pizza increases from $8 to $10 per
pie, the quantity demanded of Sue’s Subs increases from 80 to 100. Suppose also that
when the average student’s income increases to $12,000 per year, the annual quantity
demanded of Patty’s Pizza increases from 50 to 60.
Refer to Scenario 51. Using the midpoint method, the cross price elasticity of demand
is
a. about 0.22, and the two goods are substitutes.
b. about 0.005, and the two goods are complements.
c. 1, and the two goods are substitutes.
d. 1, and the two goods are unitary elastic.
To say that a price floor is binding is to say that the price floor
a. results in a shortage.
b. is set below the equilibrium price.
c. causes quantity supplied to exceed quantity demanded.
d. All of the above are correct.
Figure 88
Suppose the government imposes a $10 per unit tax on a good.
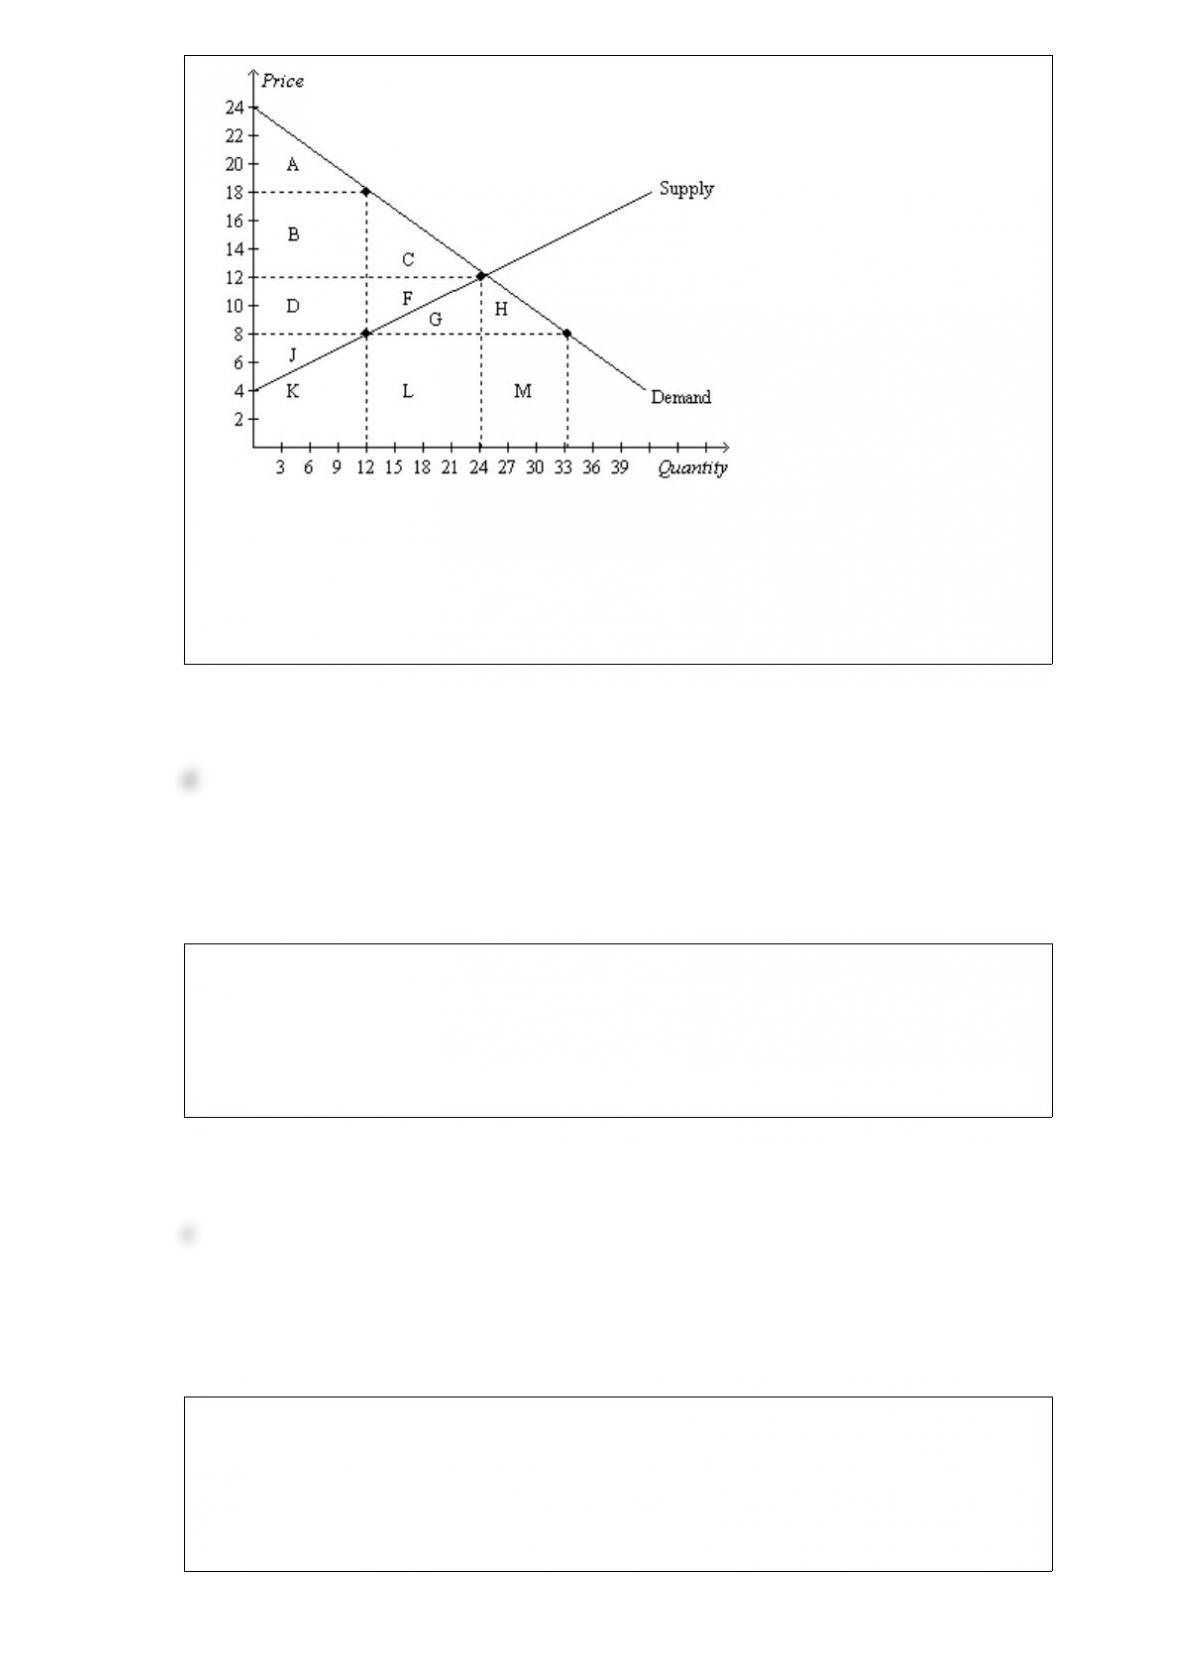
Refer to Figure 88. One effect of the tax is to
a. reduce consumer surplus by $108.
b. reduce producer surplus by $72.
c. create a deadweight loss of $60.
d. All of the above are correct.
An outcome that can result from either a price ceiling or a price floor is
a. a surplus in the market.
b. a shortage in the market.
c. a nonbinding price control.
d. long lines of frustrated buyers.
The price elasticity of demand changes as we move along a
a. horizontal demand curve.
b. vertical demand curve.
c. linear, downwardsloping demand curve.
d. All of the above are correct.

The decisions of buyers and sellers that affect people who are not participants in the
market create
a. market power.
b. externalities.
c. profiteering.
d. market equilibrium.
The irregular and largely unpredictable fluctuations in economic activity are called
a. market failure.
b. business cycle.
c. inflation.
d. unemployment.
A tax on an imported good is called a
a. quota.
b. tariff.
c. supply tax.
d. trade tax.

Tyler purchases 5 pounds of hot dogs per month when his monthly income is $2,000
and 4 pounds of hot dogs per month when his monthly income is $2,200. Tyler’s
income elasticity of demand for hot dogs is
a. 2.33, and hot dogs are a normal good.
b. 2.33, and hot dogs are an inferior good.
c. 0.43, and hot dogs are a normal good.
d. 0.43, and hot dogs are an inferior good.
Maureen’s college raises the cost of room and board per semester. This increase raises
Maureen’s opportunity cost of attending college
a. even if the amount she would have to pay for room and board if she didn’t attend
college rose by the same amount. An increase in opportunity cost reduces Maureen’s
incentive to attend college.
b. even if the amount she would have to pay for room and board if she didn’t attend
college rose by the same amount. An increase in opportunity cost increases Maureen’s
incentive to attend college.
c. only if the amount she would have to pay for room and board if she didn’t attend
college rose by less than the increase in the amount her college charges. An increase in
opportunity cost reduces Maureen’s incentive to attend college.
d. only if the amount she would have to pay for room and board if she didn’t attend
college rose by less than the increase in the amount her college charges. An increase in
opportunity cost increases Maureen’s incentive to attend college.
Figure 89
The vertical distance between points A and C represents a tax in the market.
Refer to Figure 89. The imposition of the tax causes the price received by sellers to
decrease by
a. $20.
b. $200.
c. $300.
d. $500.
Factors of production are
a. the mathematical calculations firms make in determining their optimal production
levels.
b. social and political conditions that affect production.
c. the physical relationships between economic inputs and outputs.
d. inputs into the production process.
Table 320
Assume that Brad and Theresa can switch between producing wheat and producing beef
at a constant rate.
Minutes Needed to Make 1
Bushel of Wheat

Pound of Beef
Brad1012
Theresa610
Refer to Table 320. Brad should specialize in the production of
a. wheat and Theresa should specialize in the production of beef.
b. beef and Theresa should specialize in the production of wheat.
c. both goods and Theresa should specialize in the production of neither good.
d. neither good and Theresa should specialize in the production of both goods.