
If a U.S. resident purchases a foreign bond, her transactions are included
a. in the U.S. supply of loanable funds and the supply of dollars in the market for
foreign-currency exchange.
b. in the U.S. supply of loanable funds and the demand for dollars in the market for
foreign-currency exchange.
c. in the U.S. demand for loanable funds and the supply of dollars in the market for
foreign-currency exchange.
d. in the U.S. demand for loanable funds and the demand for dollars in the market for
foreign-currency exchange.
Scenario 5-1
Suppose that the supply of aged cheddar cheese is inelastic, and the supply of bread is
elastic. Both goods are considered to be normal goods by a majority of consumers.
Suppose that a large income tax increase decreases the demand for both goods by 10%.
Refer to Scenario 5-1. The price elasticity of supply for bread could be
a. -1.
b. 0.
c. 0.5.
d. 1.5.
The simple circular-flow diagram is a model that includes only some key players in the
real economy. Which of the following key players are omitted from the simple
circular-flow model?
a. Households
b. Firms
c. Government
d. Markets for Factors of Production
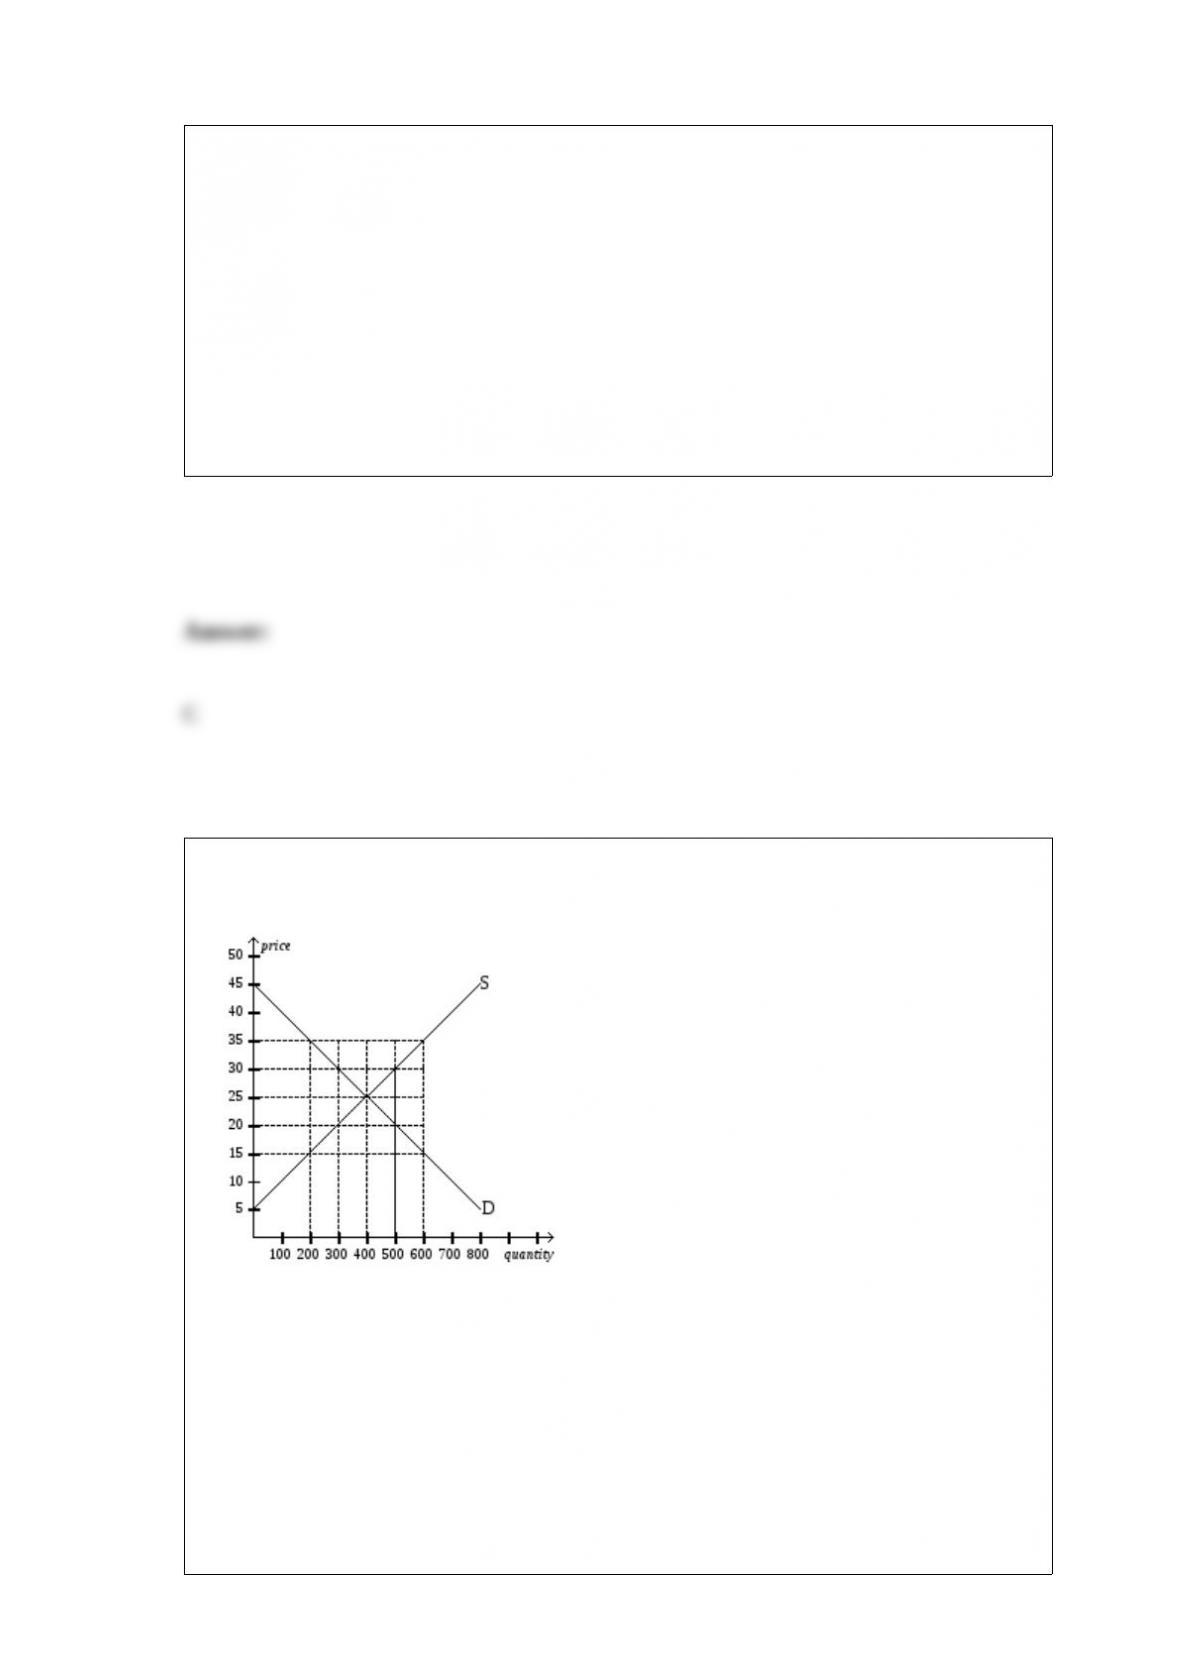
Figure 4-15
Refer to Figure 4-15. Equilibrium price and quantity are, respectively,
a. $15 and 200 units.
b. $25 and 600 units.
c. $25 and 400 units.
d. $35 and 200 units.
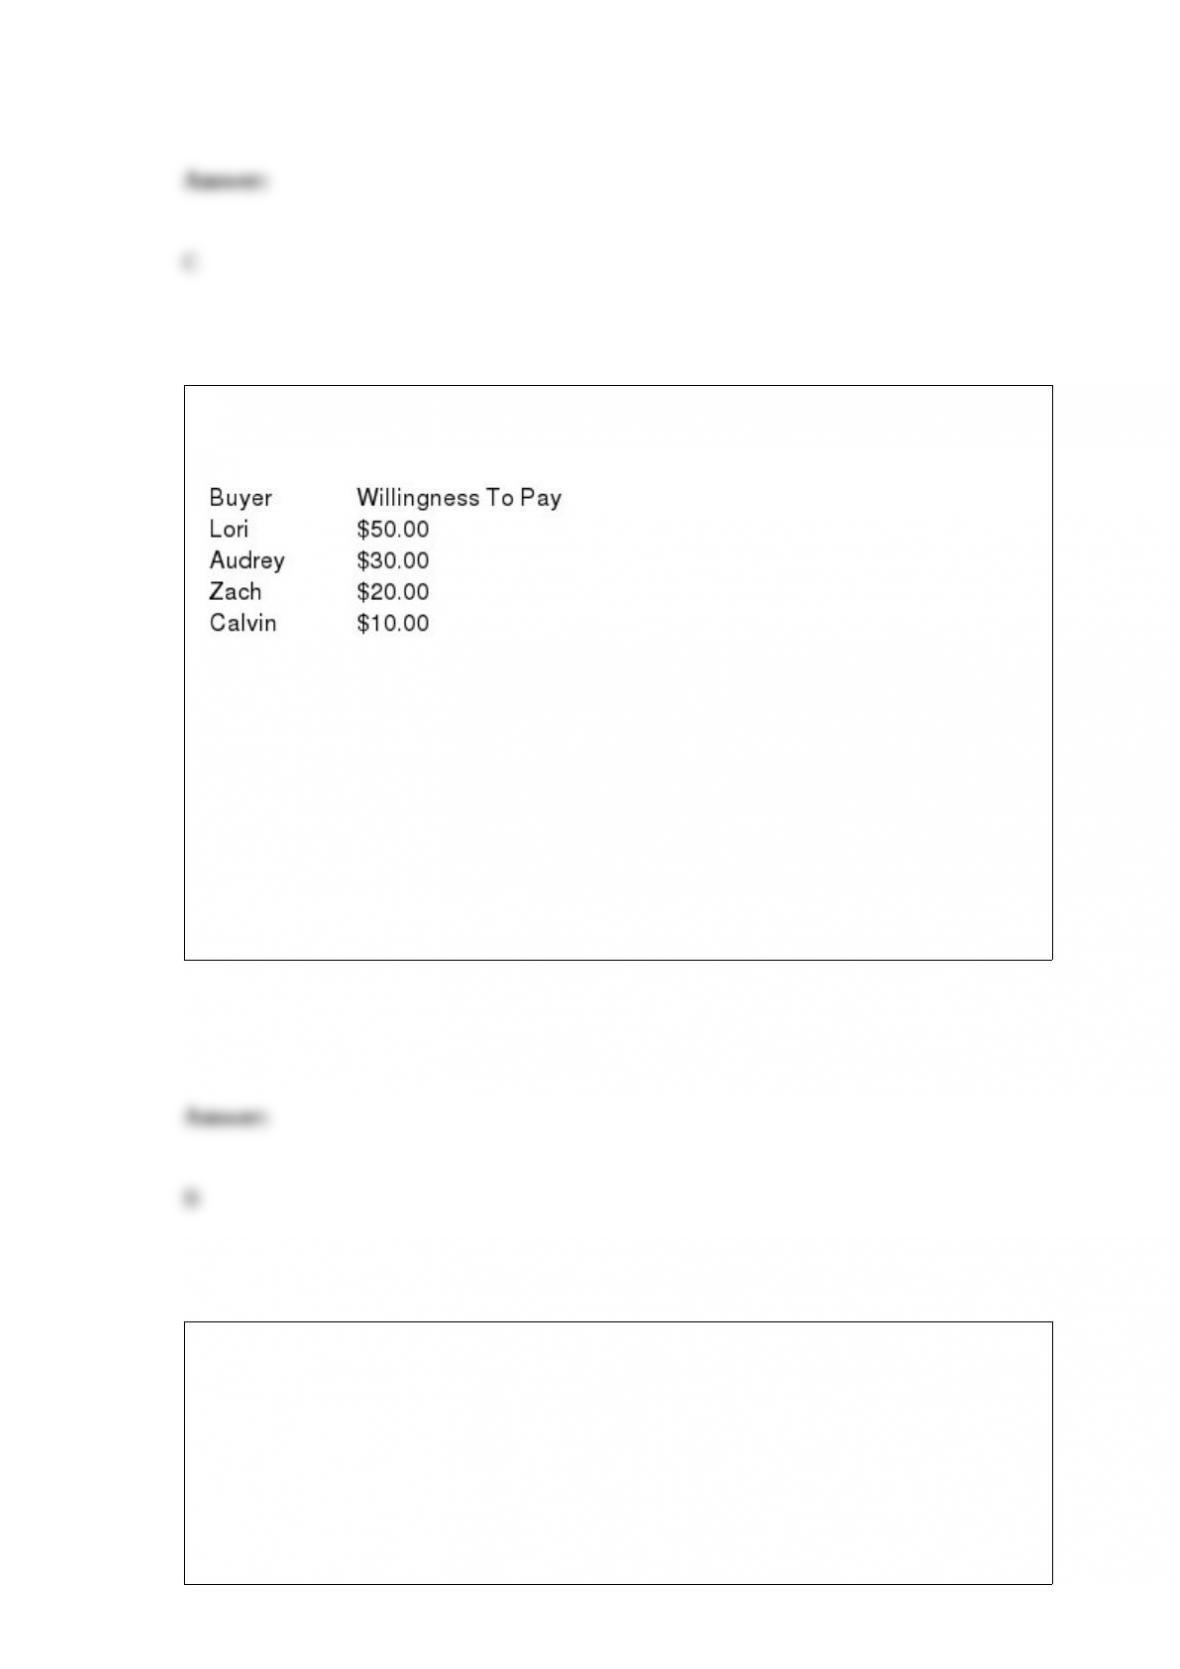
Table 7-1
Refer to Table 7-1. If the price of the product is $22, then who would be willing to
purchase the product?
a. Lori
b. Lori and Audrey
c. Lori, Audrey, and Zach
d. Lori, Audrey, Zach, and Calvin
During recessions, banks typically choose to hold more excess reserves relative to their
deposits. This action
a. increases the money multiplier and increases the money supply.
b. decreases the money multiplier and decreases the money supply.
c. does not change the money multiplier, but increases the money supply.

d. does not change the money multiplier, but decreases the money supply.
The Stock Market Boom of 2015
Imagine that in 2015 the economy is in long-run equilibrium. Then stock prices rise
more than expected and stay high for some time.
Refer to Stock Market Boom 2015. How is the new long-run equilibrium different
from the original one?
a. the price level and real GDP are higher
b. the price level and real GDP are lower.
c. the price level is higher and real GDP is the same.
d. the price level is the same and real GDP is higher.
Which of the following does purchasing-power parity imply?
a. The purchasing power of the dollar is the same in the U.S. as in foreign countries.
b. The price of domestic goods relative to foreign goods cannot change.
c. The nominal exchange rate is the ratio of U.S. prices to foreign prices.

d. All of the above are correct.
The basic tools of supply and demand are
a. useful only in the analysis of economic behavior in individual markets.
b. useful in analyzing the overall economy, but not in analyzing individual markets.
c. central to microeconomic analysis, but seldom used in macroeconomic analysis.
d. central to macroeconomic analysis as well as to microeconomic analysis.
When a tax is levied on sellers of tea,
a. the well-being of both sellers and buyers of tea is unaffected.
b. sellers of tea are made worse off, and the well-being of buyers is unaffected.
c. sellers of tea are made worse off, and buyers of tea are made better off.
d. both sellers and buyers of tea are made worse off.
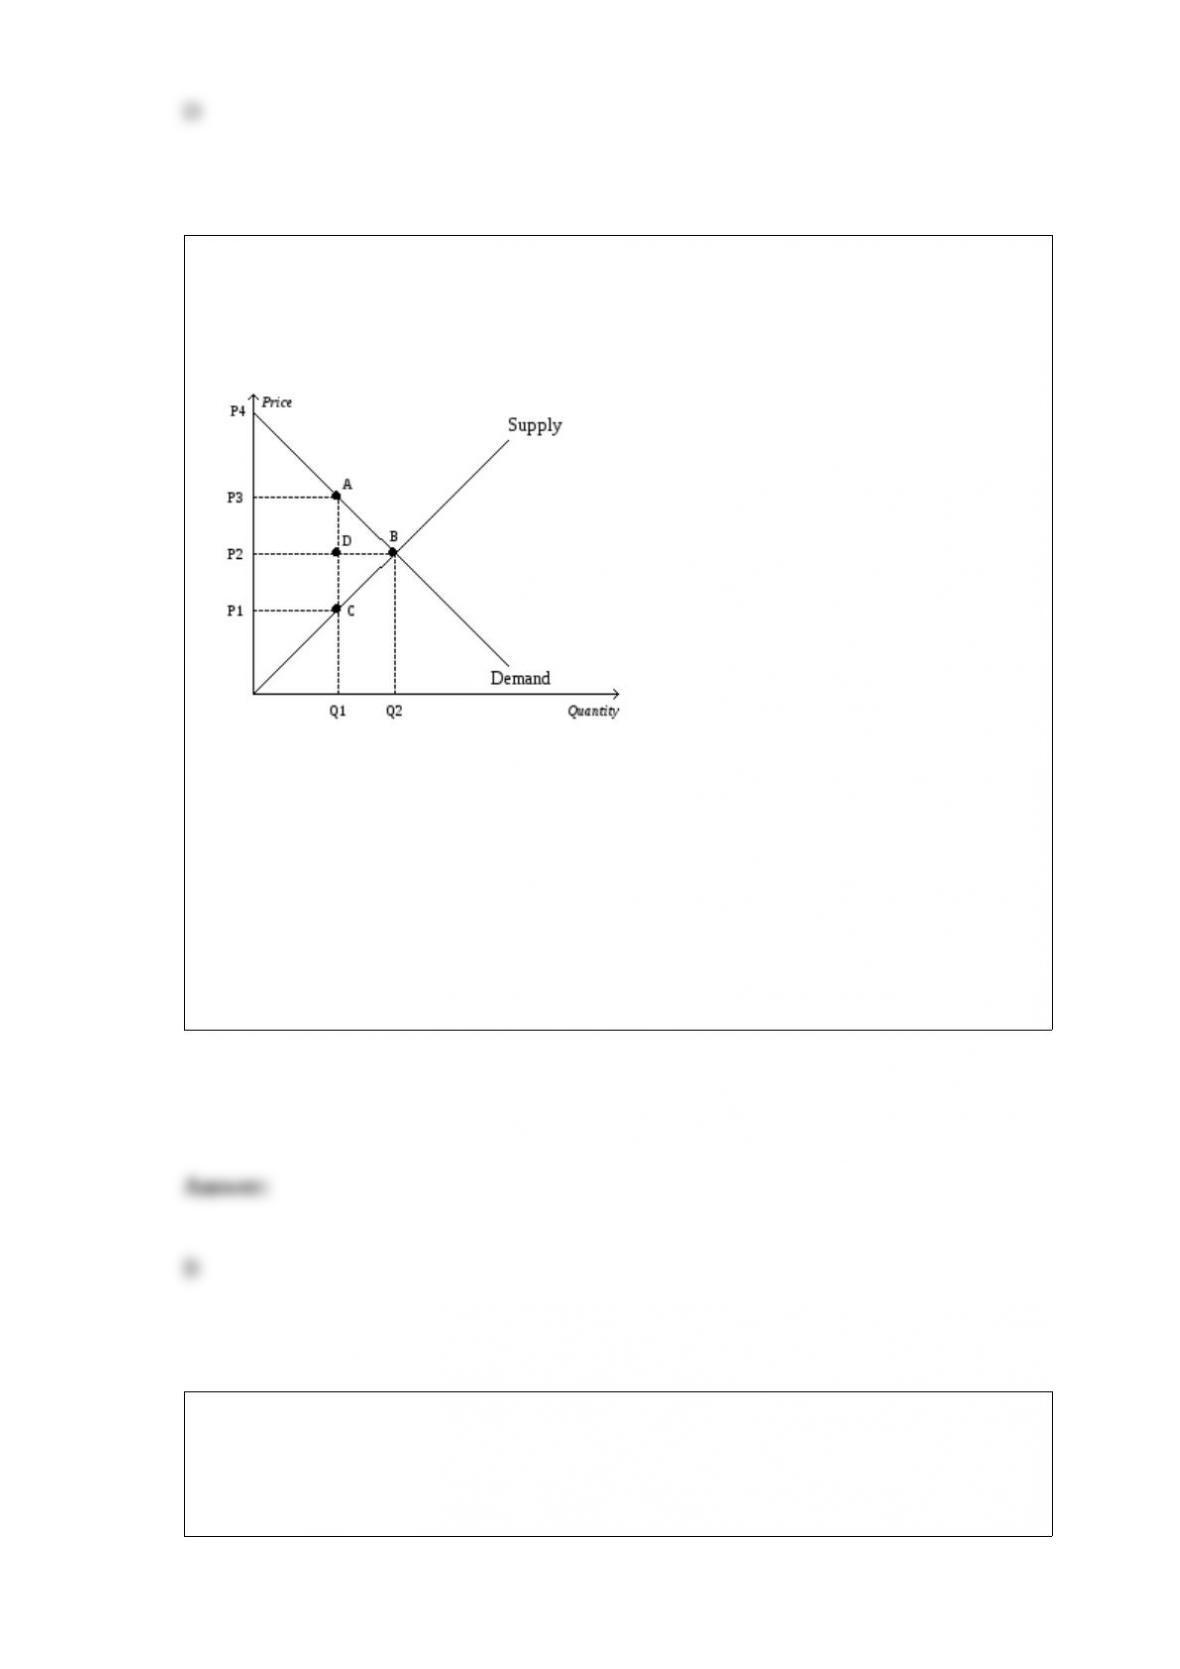
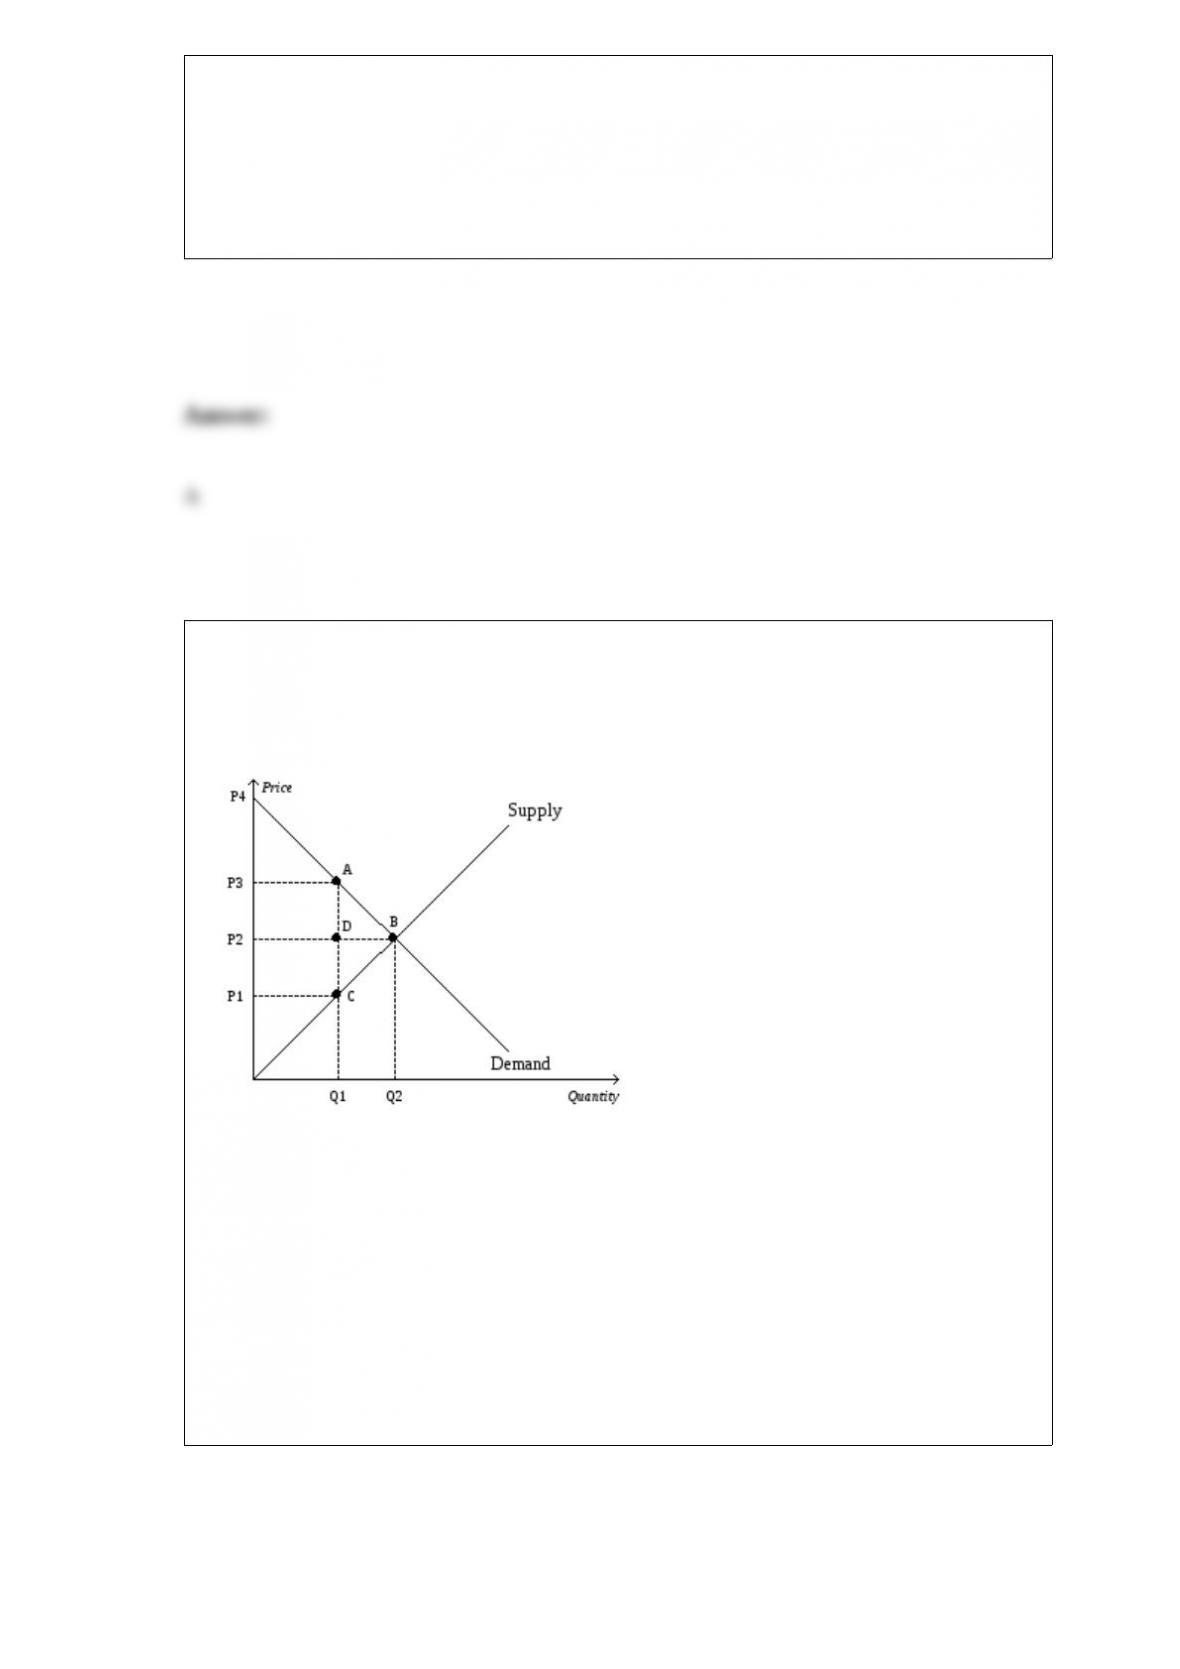
Figure 8-3
The vertical distance between points A and C represents a tax in the market.
Refer to Figure 8-3. The amount of deadweight loss associated with the tax is equal to
a. P3ACP1.
b. ABC.
c. P2ADP3.
d. P1DCP2.
Figure 3-8
Chile’s Production Possibilities Frontier Colombia’s Production Possibilities
Frontier
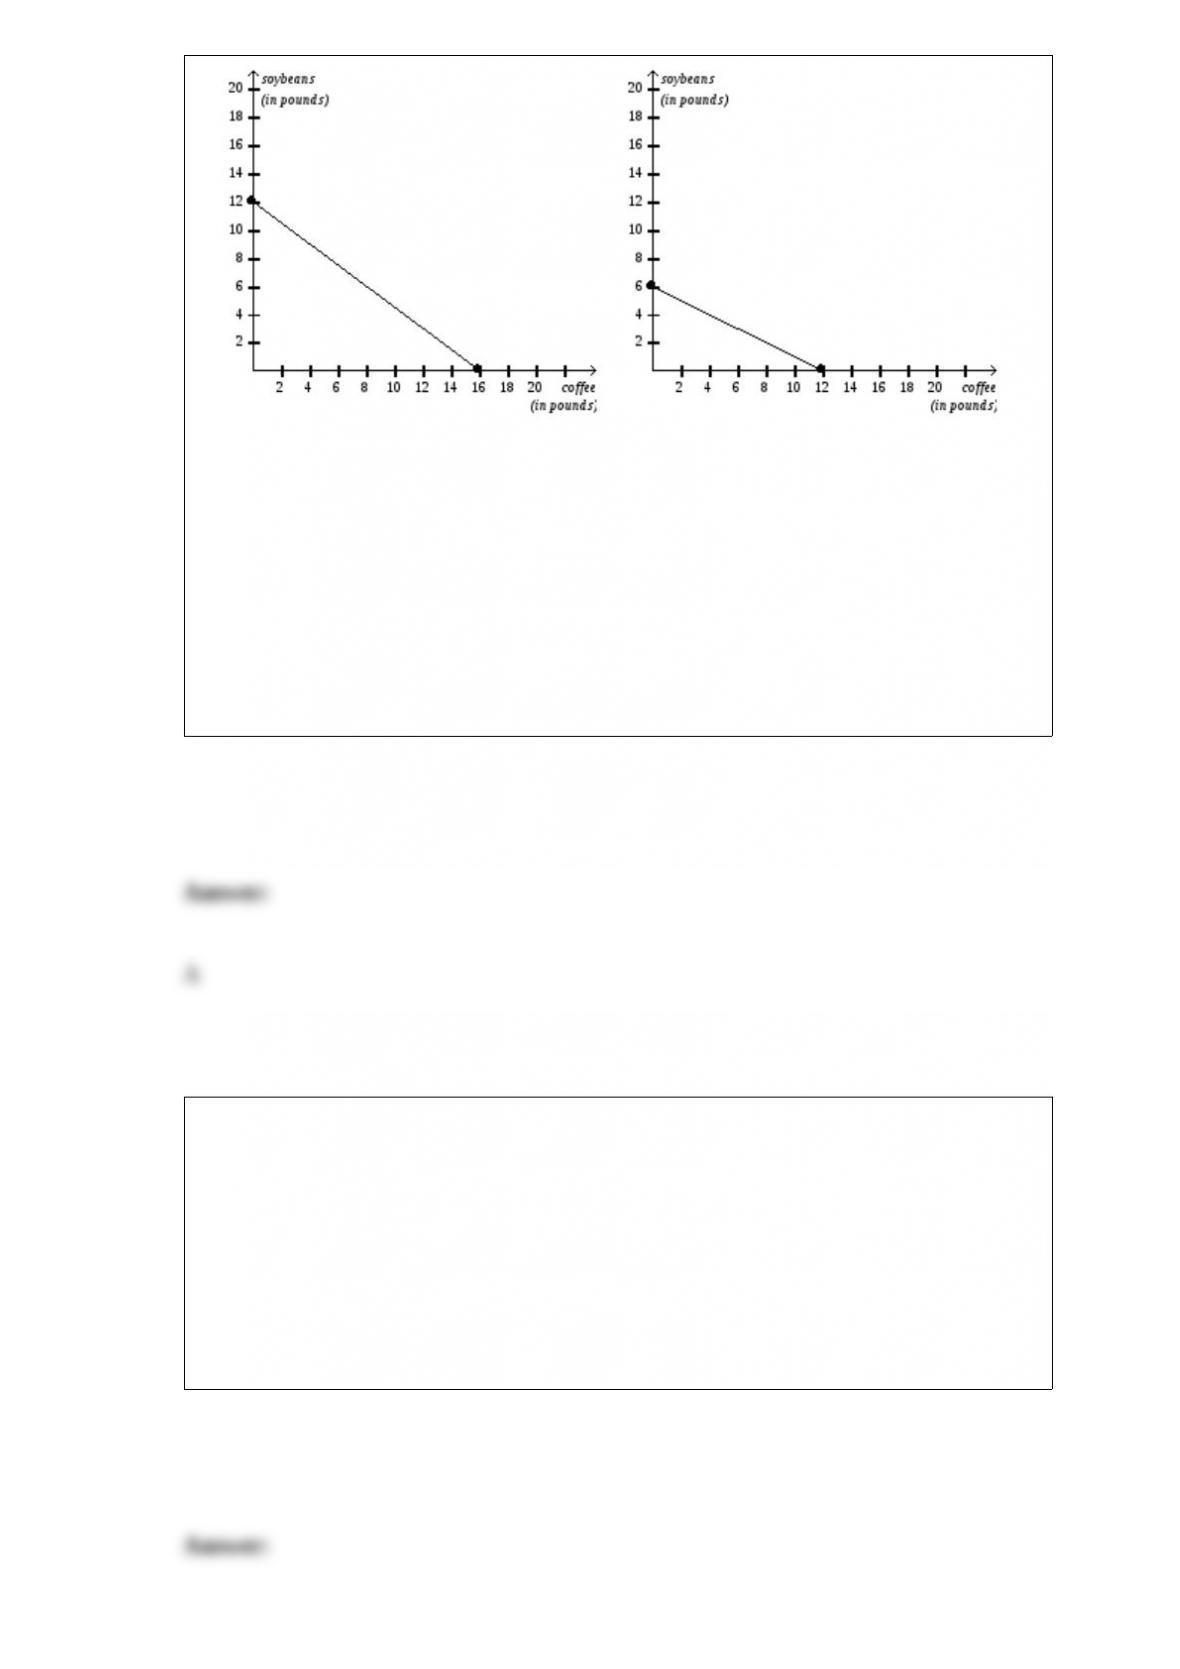
Refer to Figure 3-8. Colombia would incur an opportunity cost of 24 pounds of coffee
if it increased its production of soybeans by
a. 12 pounds.
b. 18 pounds.
c. 36 pounds.
d. 48 pounds.
Which of the following is not associated with an adverse supply shock?
a. the short-run Phillips curve shifts left
b. unemployment rises
c. the price level rises
d. output falls
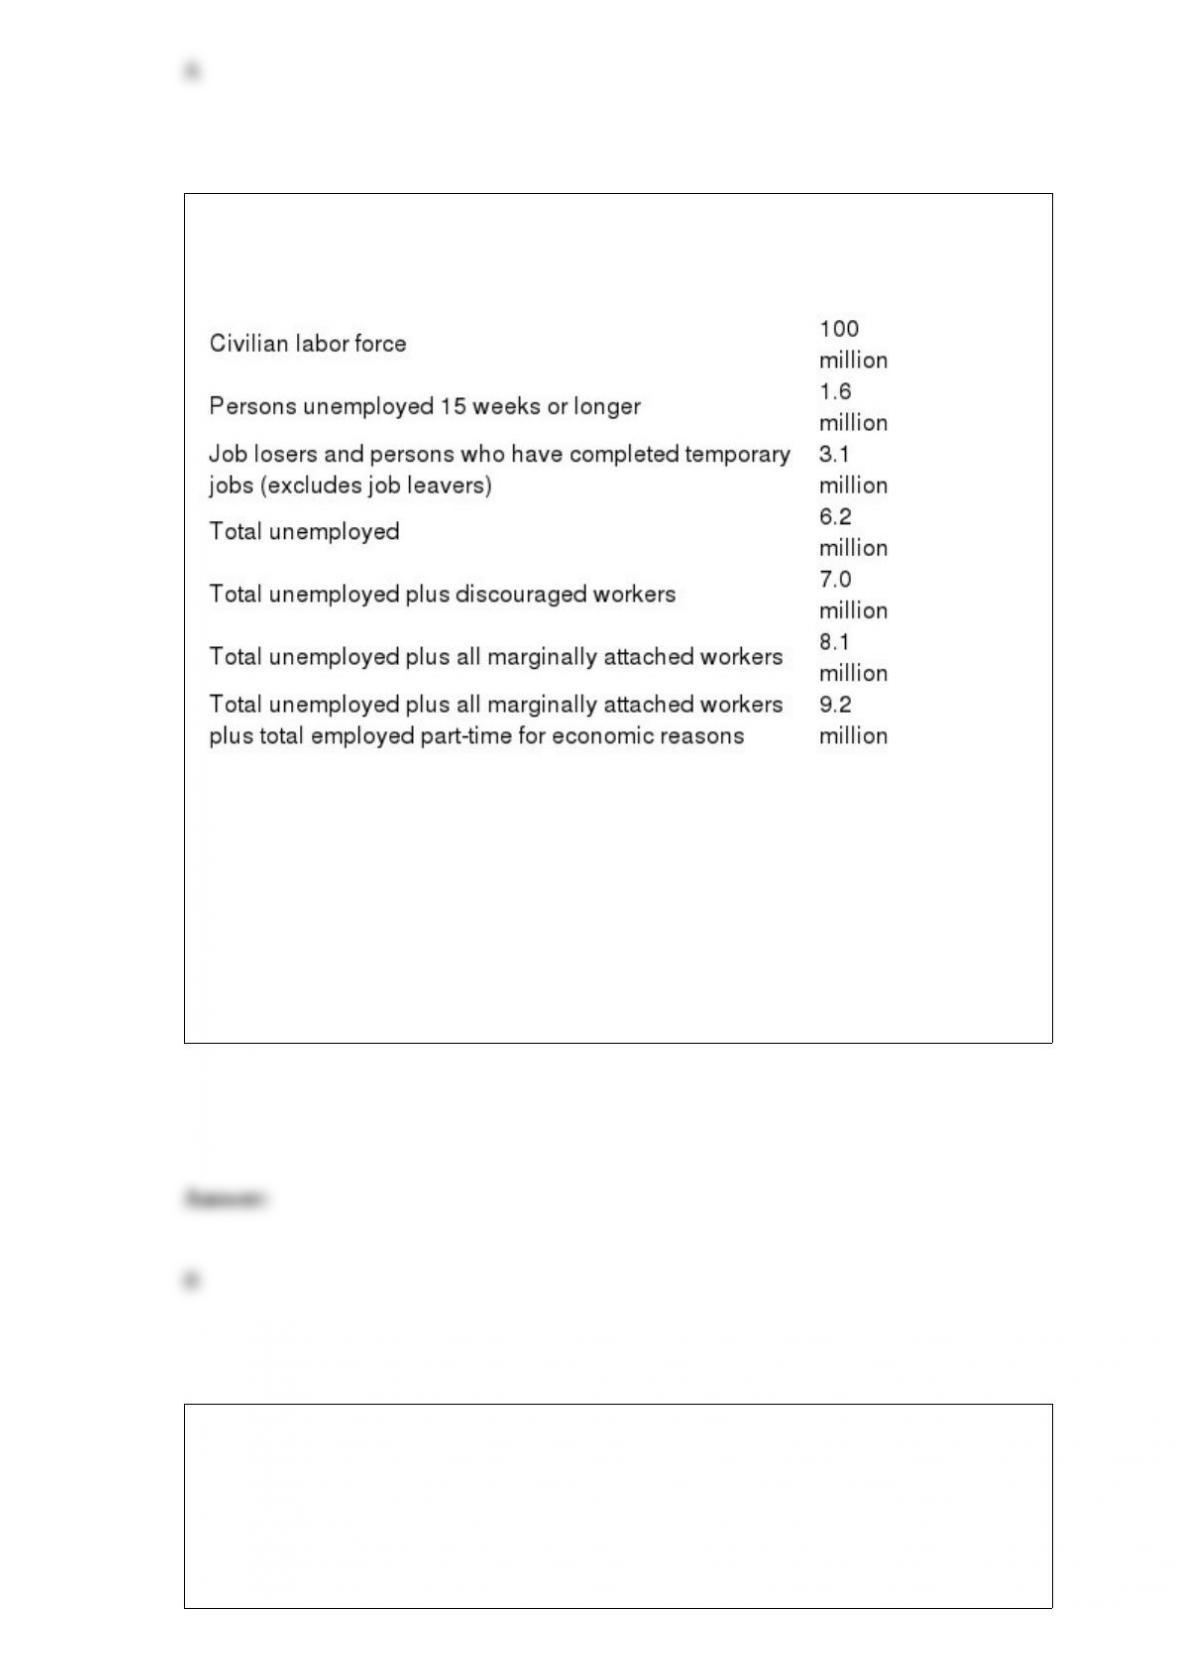
Table 15-4
Refer to Table 15-4. What is the U-2 measure of labor underutilization?
a. 1.5 percent
b. 3.1 percent
c. 4.7 percent
d. 6.2 percent
Which of the following would cause price to decrease?
a. a decrease in supply
b. an increase in demand

c. a surplus of the good
d. a shortage of the good
For the Bureau of Labor Statistics to place someone in the “unemployed” category, that
person must
a. be available for work.
b. have tried to find employment during the previous week.
c. have previously been employed.
d. All of the above are correct.
For good X, the supply curve is the typical upward-sloping straight line, and the
demand curve is the typical downward-sloping straight line. A tax of $15 per unit is
imposed on good X. The tax reduces the equilibrium quantity in the market by 300
units. The deadweight loss from the tax is
a. $1,750.
b. $2,250.
c. $3,000.
d. $4,500.

Suppose there is a 6 percent increase in the price of good X and a resulting 6 percent
decrease in the quantity of X demanded. Price elasticity of demand for X is
a. 0.
b. 1.
c. 6.
d. 36.
In 1979 and 1980,
a. the U.S. inflation rate as measured by the GDP deflator was higher than that
measured by the CPI, and the difference was explained by rapidly rising prices of goods
exported by the U.S.
b. the U.S. inflation rate as measured by the CPI was higher than that measured by the
GDP deflator, and the difference was explained by rapidly rising prices of goods
exported by the U.S.
c. the U.S. inflation rate as measured by the GDP deflator was higher than that
measured by the CPI, and the difference was explained by rapidly rising oil prices.
d. the U.S. inflation rate as measured by the CPI was higher than that measured by the
GDP deflator, and the difference was explained by rapidly rising oil prices.
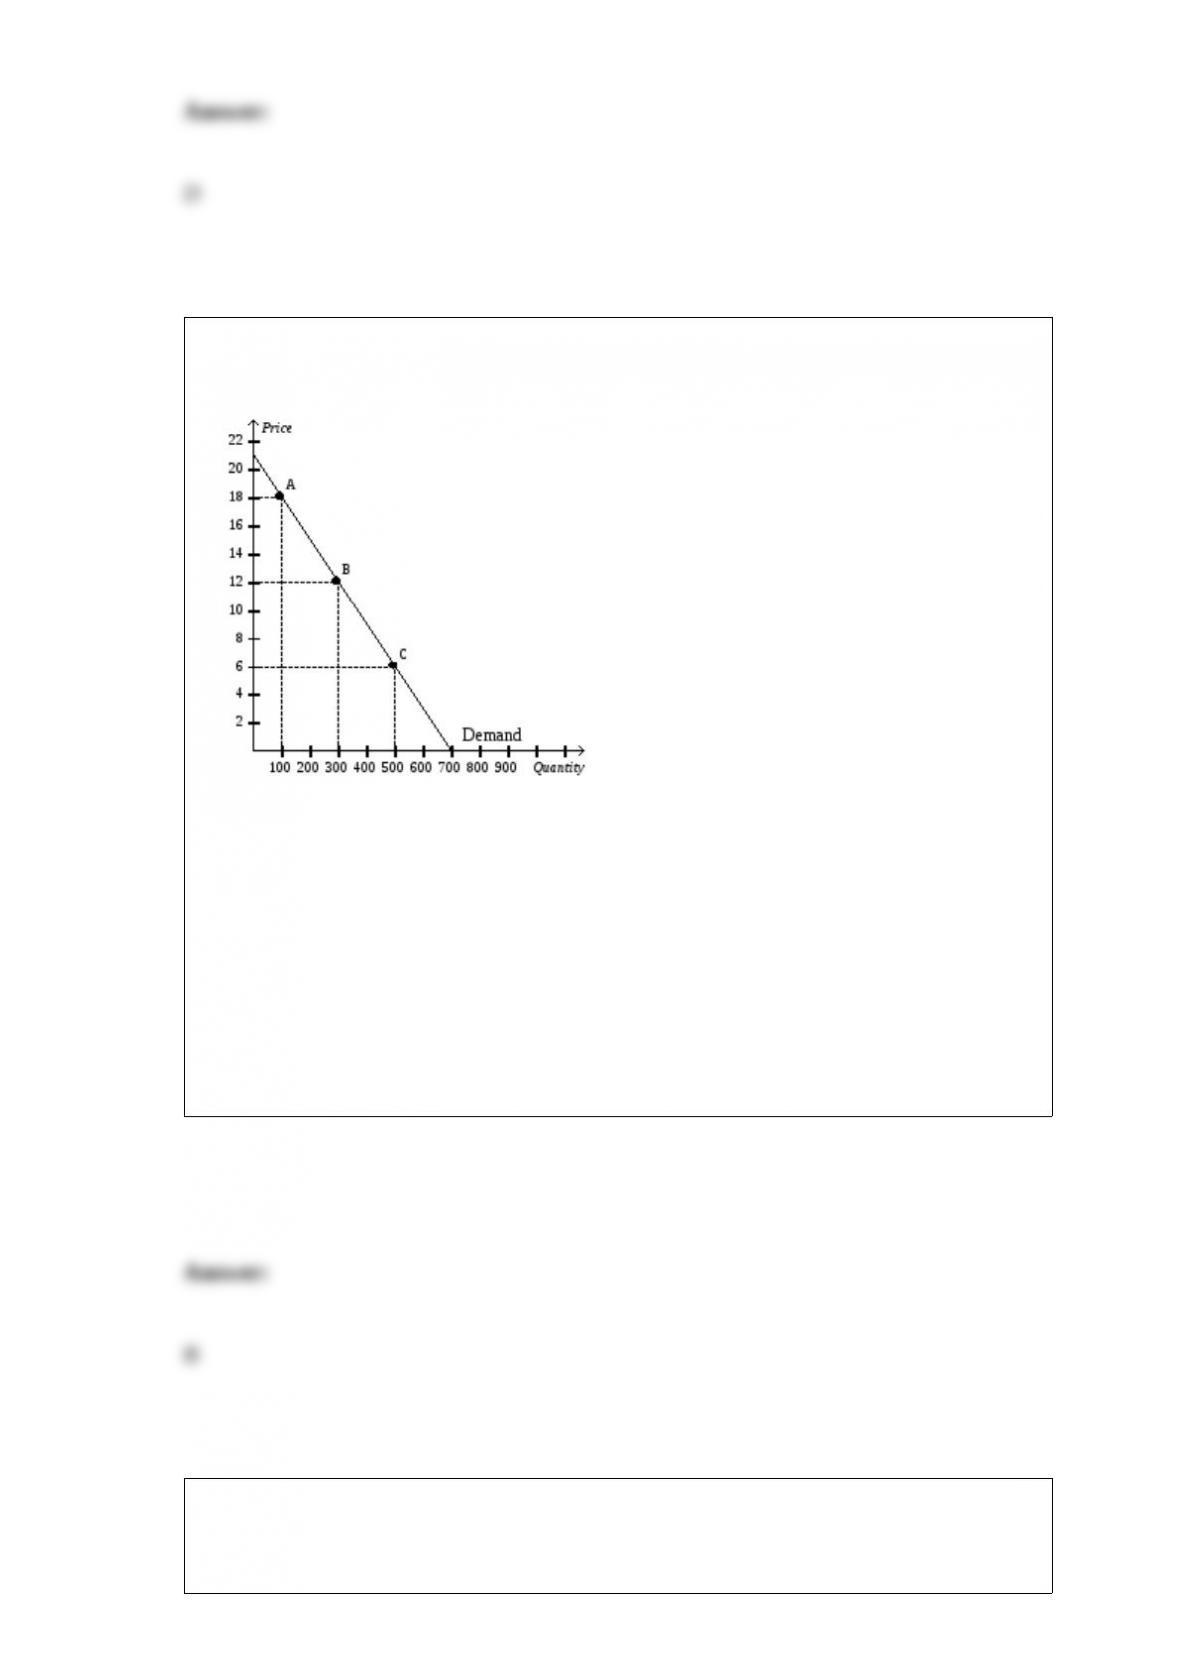
Figure 5-6
Refer to Figure 5-6. Using the midpoint method, the price elasticity of demand
between point B and point C is
a. 0.5.
b. 0.75.
c. 1.0.
d. 1.3.
Table 7-7
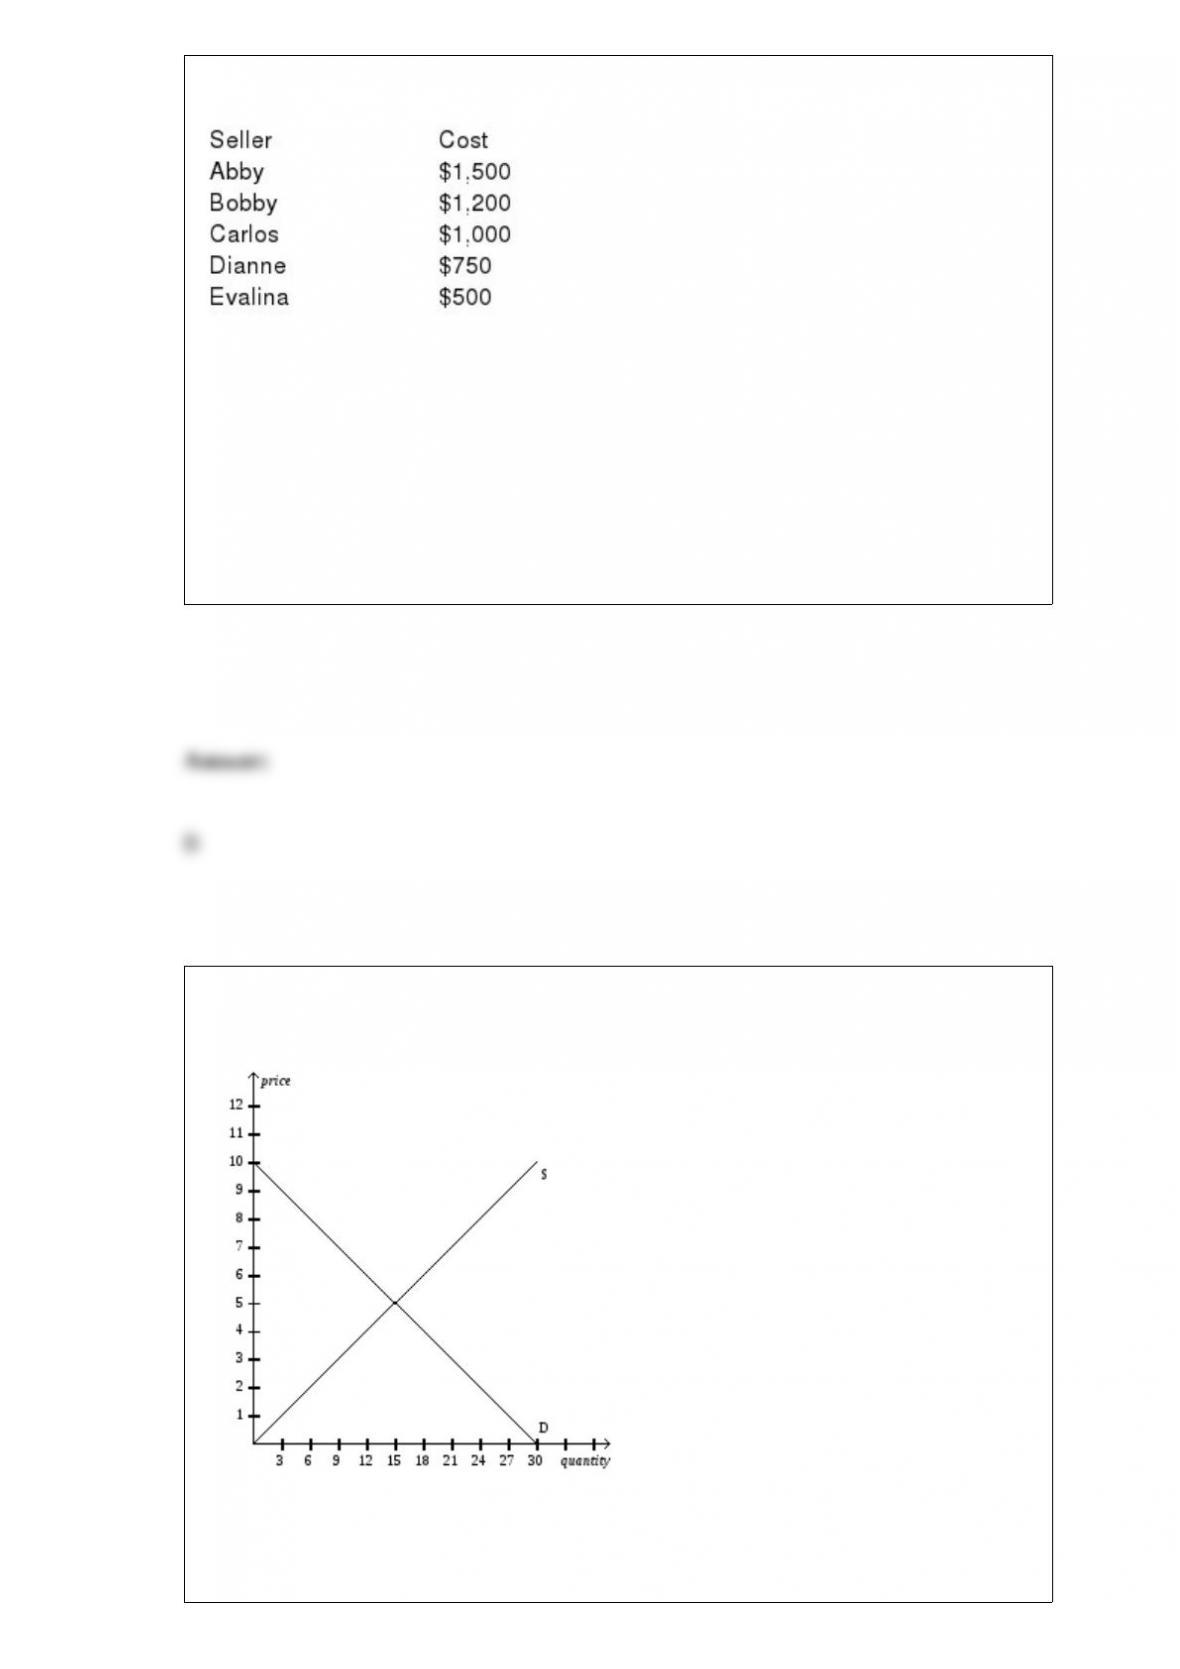
The following table represents the costs of five possible sellers.
Refer to Table 7-7. If the market price is $1,000, the producer surplus in the market is
a. $700.
b. $750.
c. $2,250.
d. $3,700.
Figure 6-9
Refer to Figure 6-9. At which price would a price ceiling be binding?
a. $4
b. $5
c. $6
d. $7
Figure 8-3
The vertical distance between points A and C represents a tax in the market.
Refer to Figure 8-3. Which of the following equations is valid for the deadweight loss
of the tax?
a. Deadweight loss = (1/2)(P2 – P1)(Q2 + Q1)
b. Deadweight loss = (1/2)(P3 – P1)(Q2 + Q1)
c. Deadweight loss = (1/2)(P3 – P2)(Q2- Q1)
d. Deadweight loss = (1/2)(P3 – P1)(Q2- Q1)
“If all economists were laid end to end, they would not reach a conclusion.” Who made
this whimsical observation?
a. Harry Truman
b. George Bernard Shaw
c. John Maynard Keynes
d. Ronald Reagan
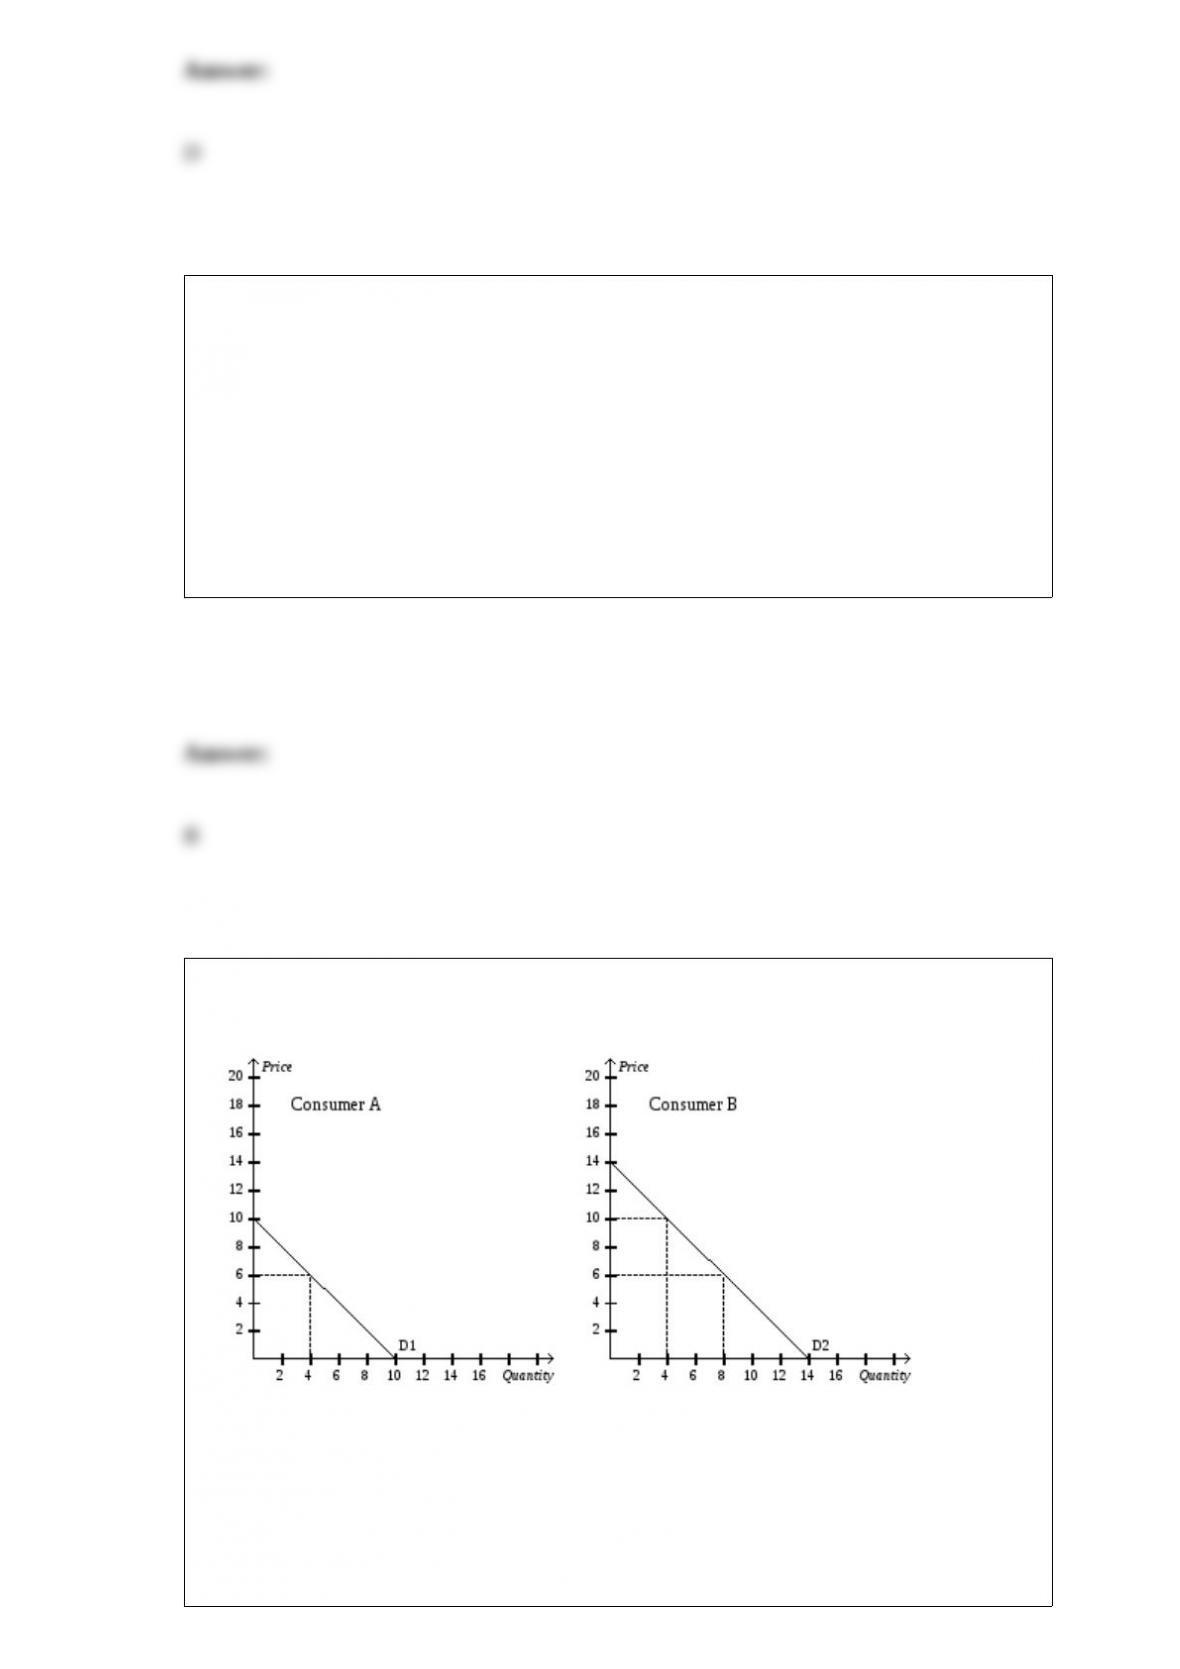
Figure 4-2
Refer to Figure 4-2. If Consumer A and Consumer B are the only consumers in the
market, then the market quantity demanded when the price is $6 is
a. 4 units.
b. 6 units.

c. 8 units.
d. 12 units.
Holding all other forces constant, if decreasing the price of a good leads to an increase
in total revenue, then the demand for the good must be
a. unit elastic.
b. inelastic.
c. elastic.
d. None of the above is correct because a price increase always leads to an increase in
total revenue.
Which of the following could explain an increase in the interest rate and an increase in
the equilibrium quantity of investment?
a. the supply of loanable funds shifted right.
b. the supply of loanable funds shifted left.
c. the demand for loanable funds shifted right.
d. the demand for loanable funds shifted left.
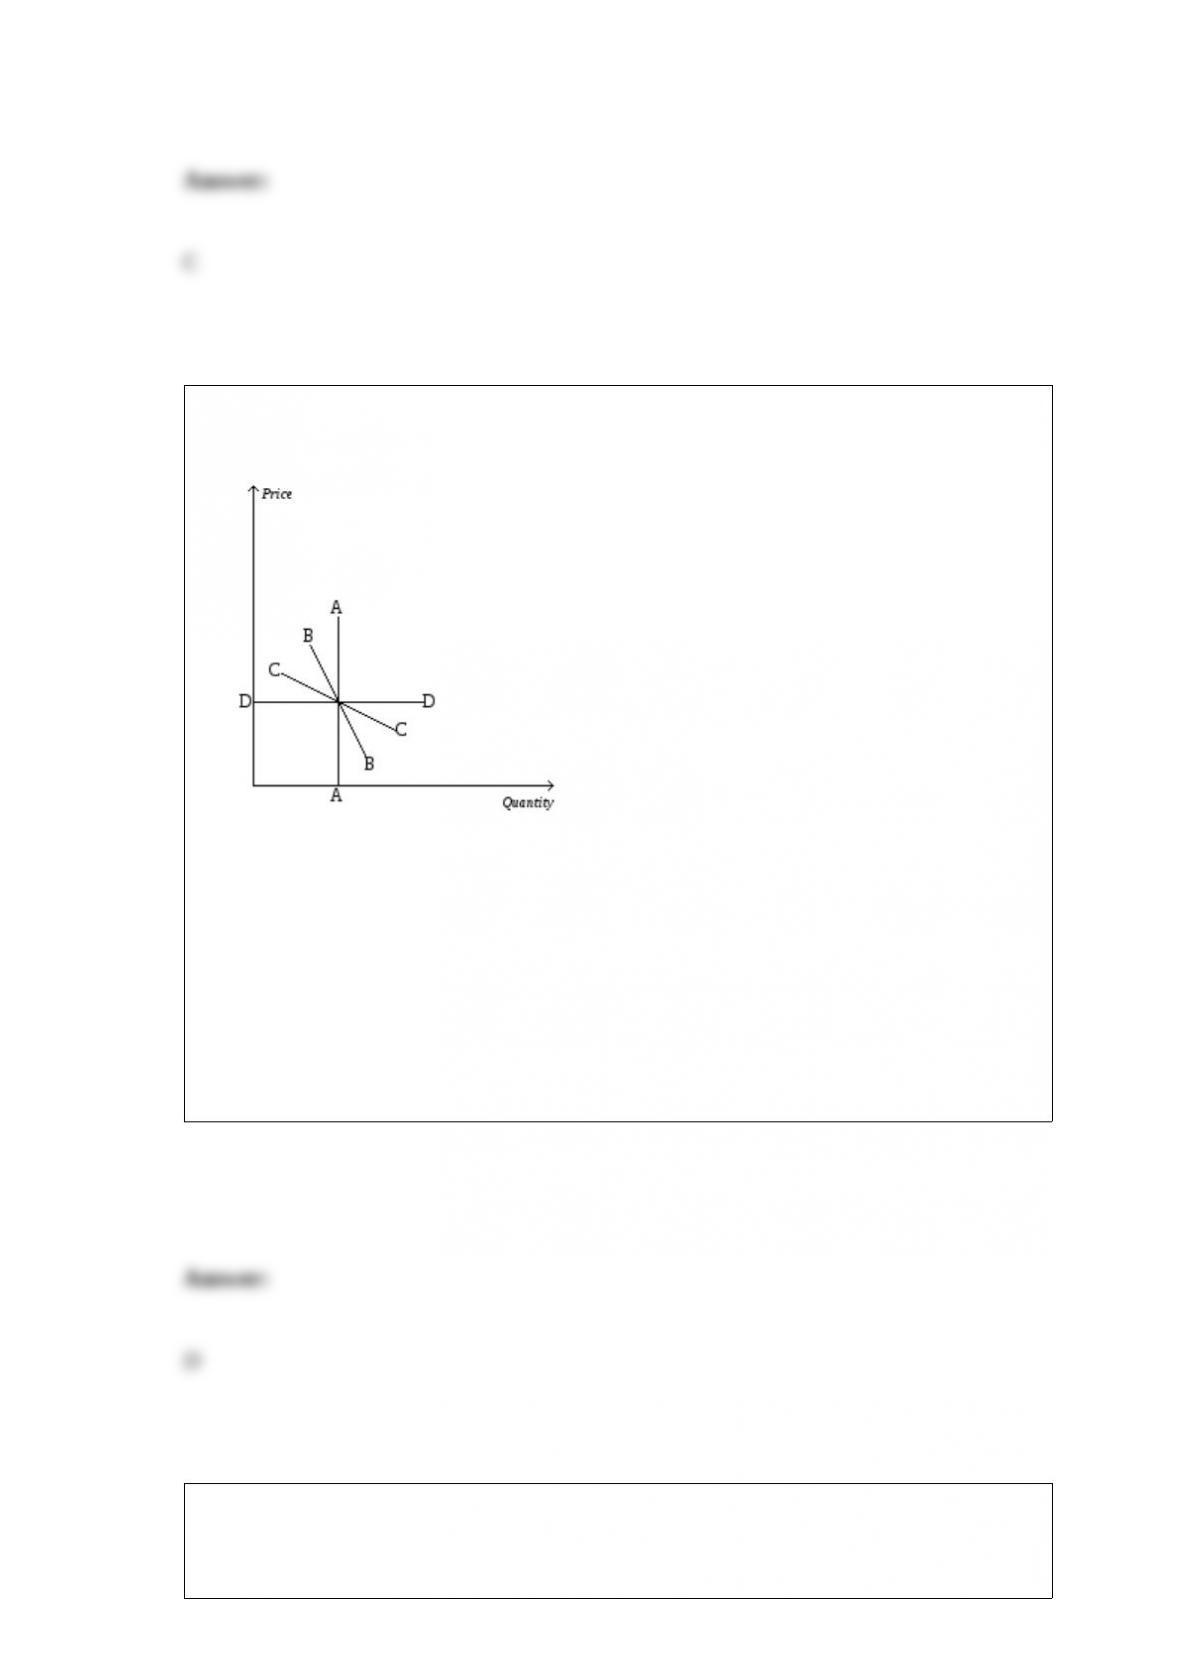
Figure 5-3
Refer to Figure 5-3. Which demand curve is unit elastic?
a. A
b. B
c. D
d. None of the above.
Figure 3-2
Peru’s Production Possibilities Frontier
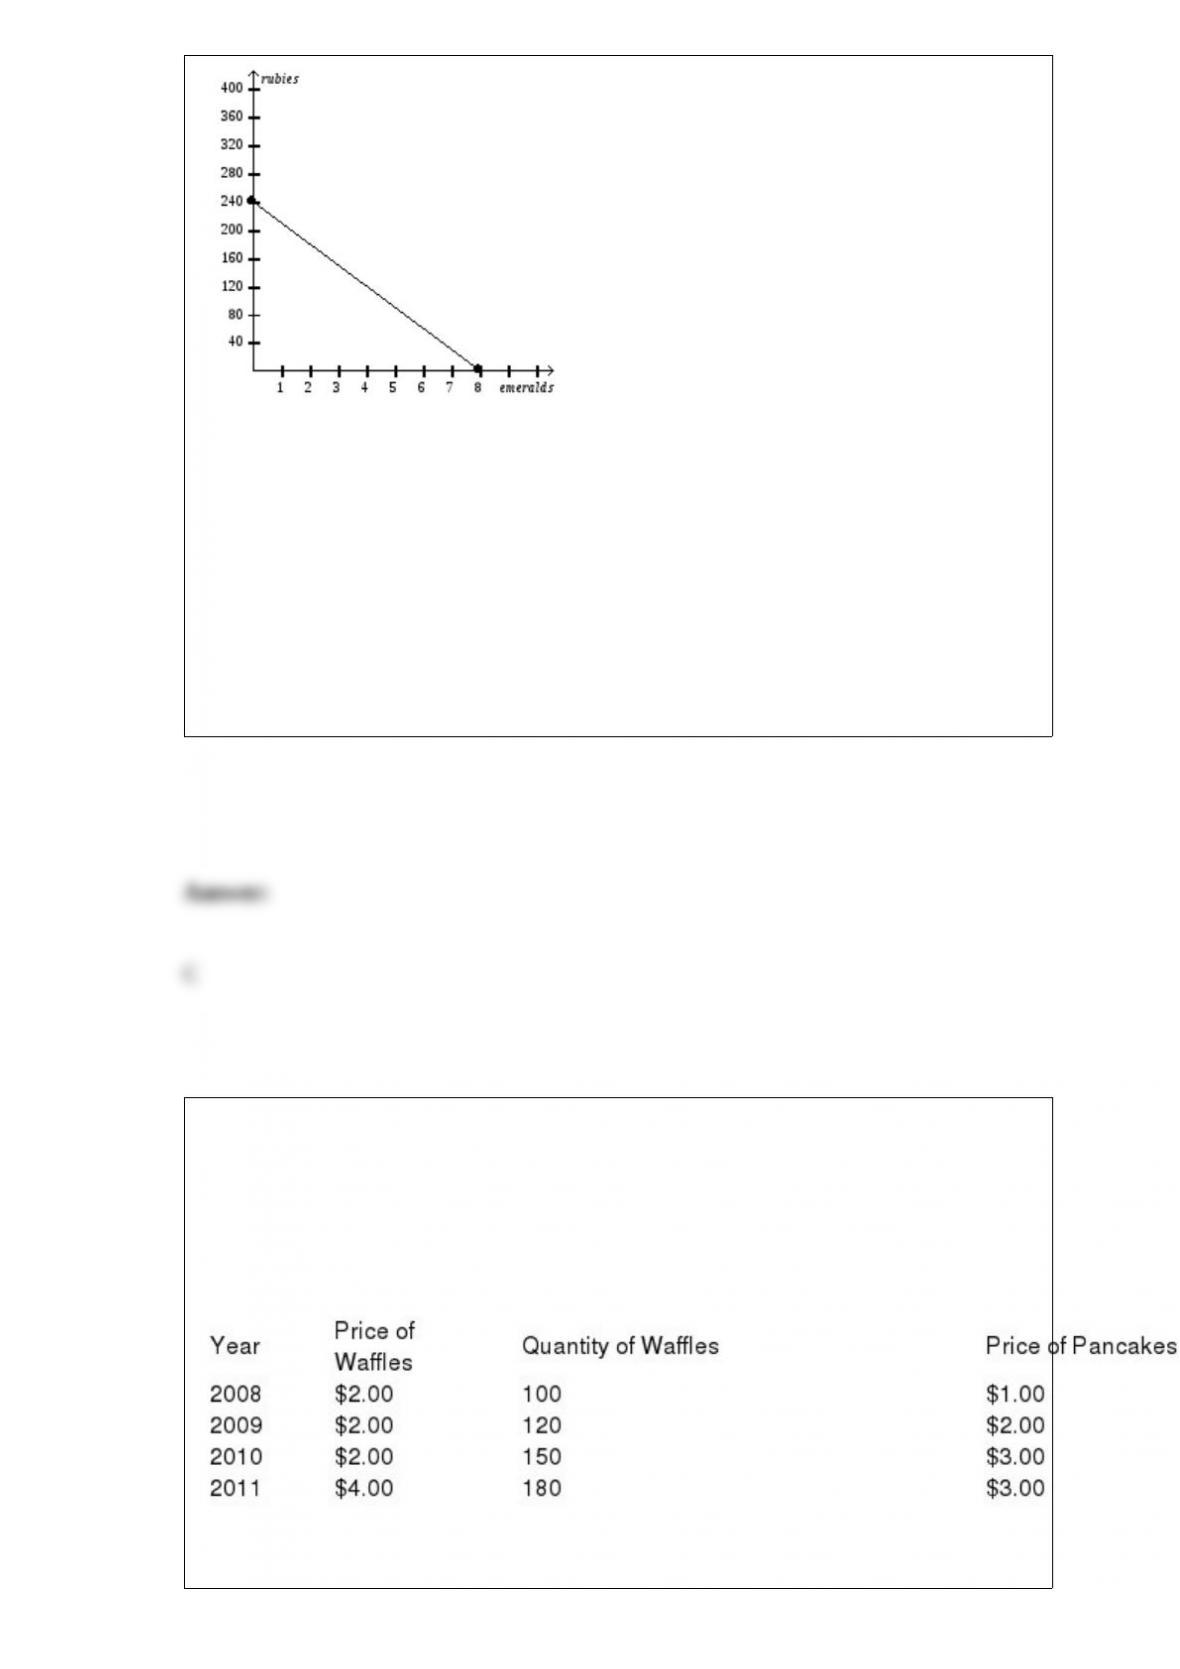
Refer to Figure 3-2. Suppose Peru decides to increase its production of rubies by 30.
What is the opportunity cost of this decision?
a. 1/8 emerald
b. 1/3 emerald
c. 1 emerald
d. 3 emeralds
Table 10-6
The table below contains data for the country of Batterland, which produces only
waffles and pancakes. The base year is 2009.
Prices and Quantities
Refer to Table 10-6. In 2011, this country’s real GDP was
a. $540.
b. $800.
c. $930.
d. $1380.
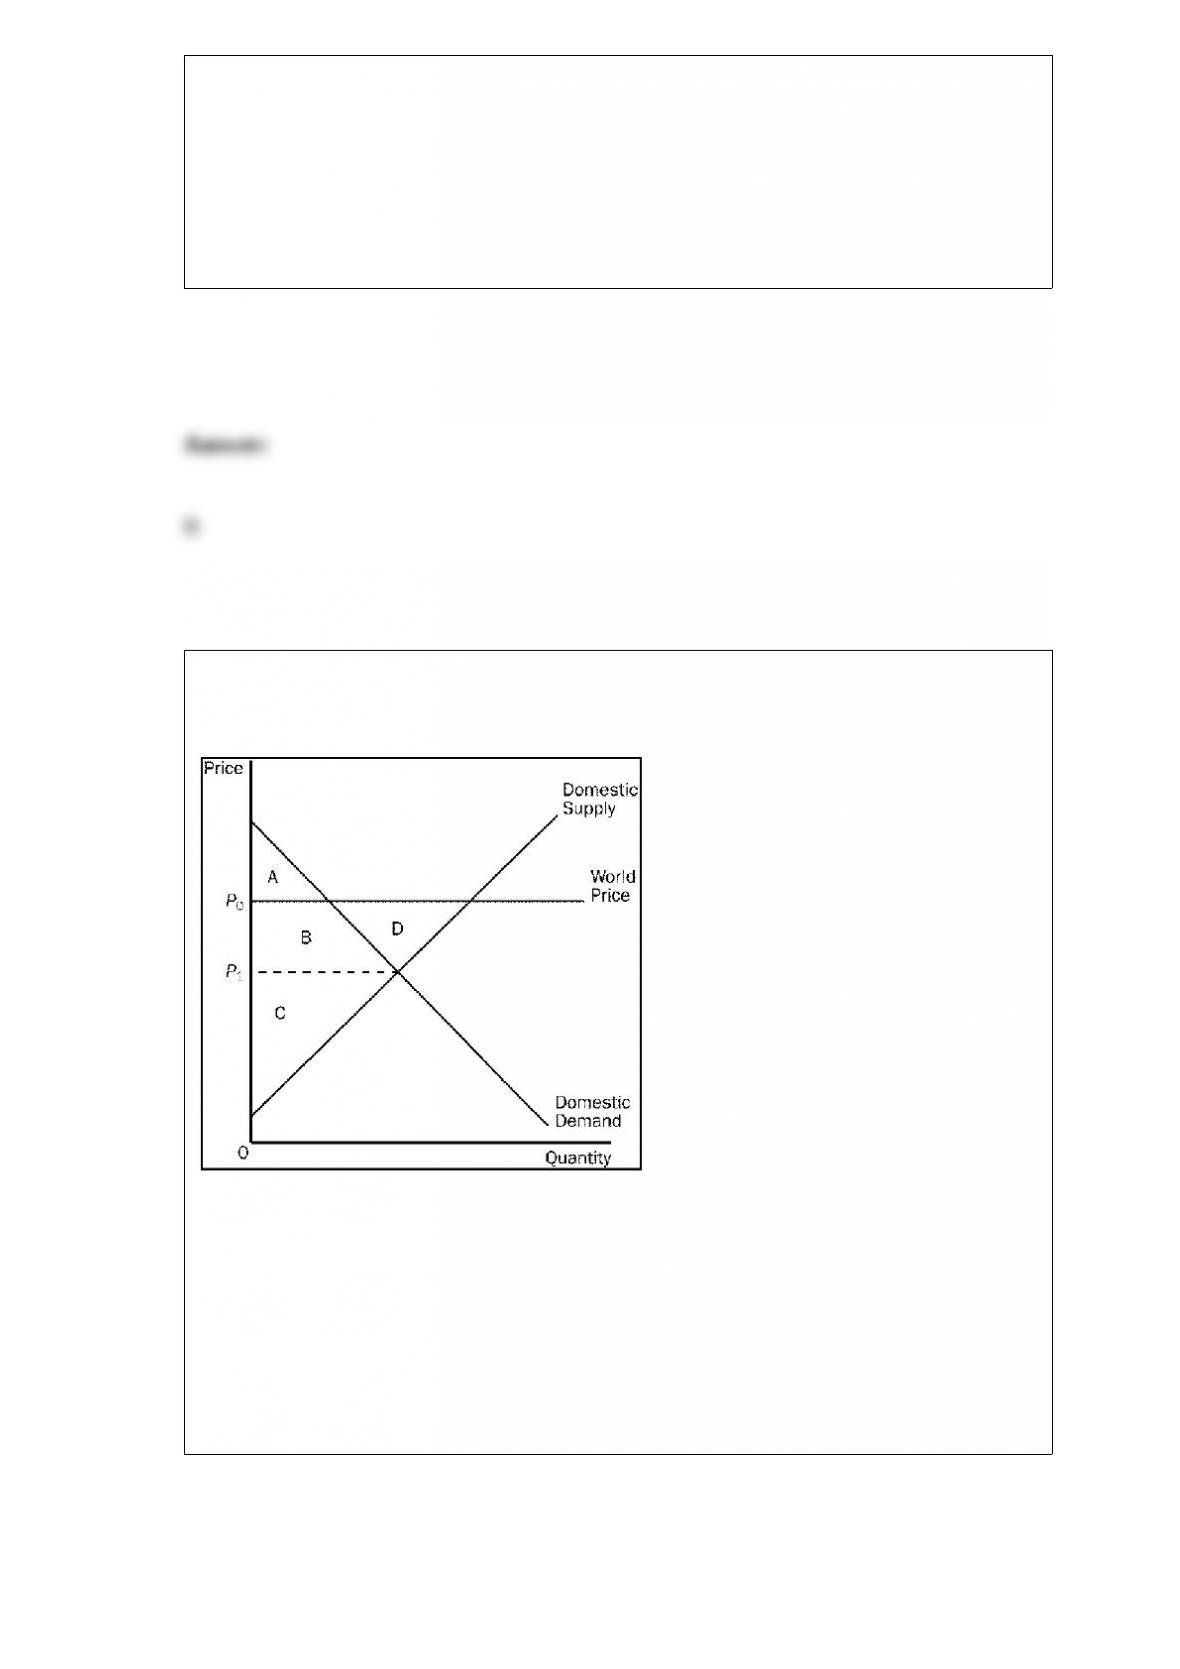
Figure 9-9
Refer to Figure 9-9. Consumer surplus in this market before trade is
a. A.
b. A + B.
c. A + B + D.
d. C.
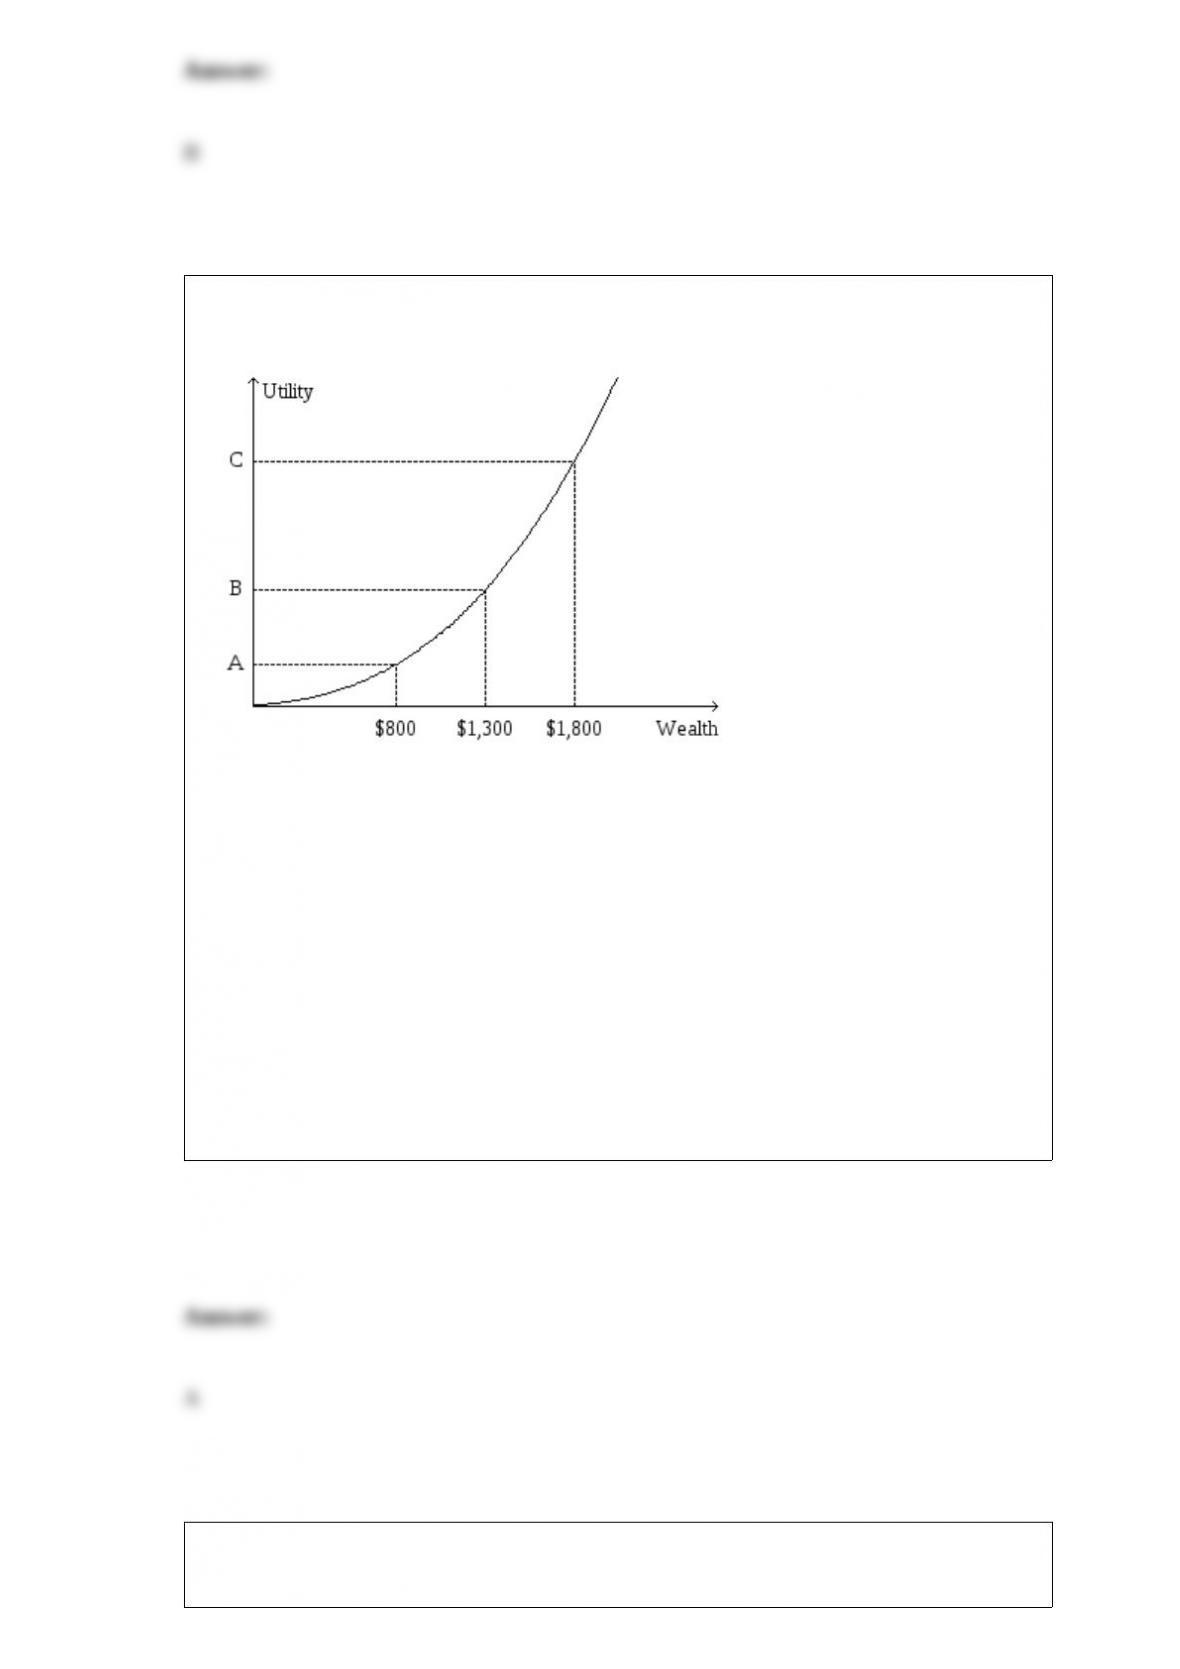
Figure 14-4. The figure shows a utility function for Dexter.
Refer to Figure 14-4. From the appearance of the graph, we know that
a. Dexter’s level of satisfaction increases by more when his wealth increases from
$1,001 to $1,002 than it does when his wealth increases from $1,000 to $1,001.
b. Dexter’s level of satisfaction increases by less when his wealth increases from $1,001
to $1,002 than it does when his wealth increases from $1,000 to $1,001.
c. Dexter’s level of satisfaction increases by the same amount when his wealth increases
from $1,001 to $1,002 as it does when his wealth increases from $1,000 to $1,001.
d. None of the above answers can be inferred from the appearance of the utility
function.
Pessimism
Suppose the economy is in long-run equilibrium. Then because of corporate scandal,
international tensions, and loss of confidence in policymakers, people become
pessimistic regarding the future and retain that level of pessimism for some time.
Refer to Pessimism. In the long run, the change in price expectations created by
pessimism shifts
a. long-run aggregate supply right.
b. long-run aggregate supply left.
c. short-run aggregate supply right.
d. short-run aggregate supply left.
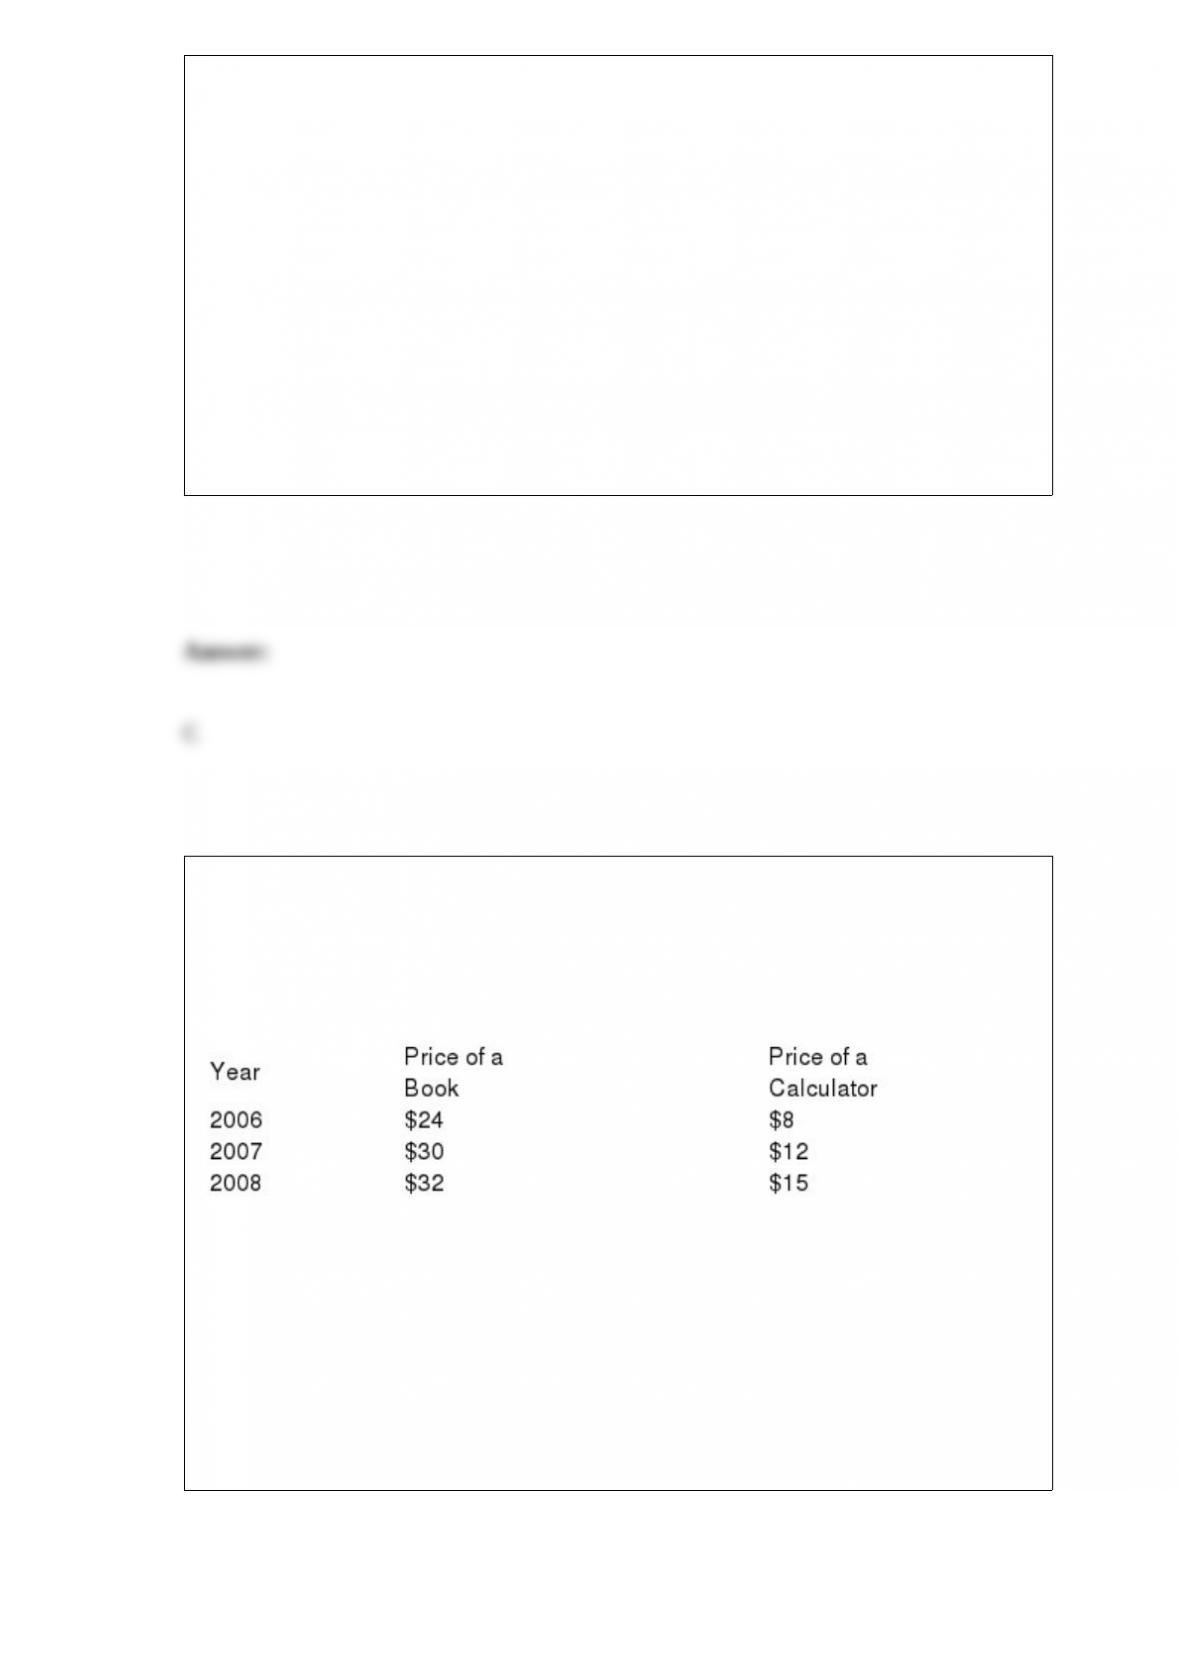
Table 11-3
The table below pertains to Studious, an economy in which the typical consumer’s
basket consists of 5 books and 10 calculators.
Refer to Table 11-3. The cost of the basket in 2006 was
a. $32.
b. $200.
c. $280.
d. $480.

In a fractional-reserve banking system, a bank
a. does not make loans.
b. does not accept deposits.
c. keeps only a fraction of its deposits in reserve.
d. None of the above is correct.
If the real interest rate is 5% and the inflation rate is 3%, then the nominal interest rate
is 8%.
Macroeconomic statistics tell us about a particular household, firm, or market.

If something happens to alter the quantity supplied at any given price, then we move
along the fixed supply curve to a new quantity supplied.
Nominal GDP measures output of final goods and services in physical terms.
Discuss the statistical evidence concerning the efficient markets hypothesis.

All goods and services are sold in perfectly competitive markets.
Frictional unemployment is often thought to explain relatively long spells of
unemployment.
The burden of a luxury tax most likely falls more heavily on sellers because demand is
more elastic and supply is more inelastic.
When a seller expects the price of its product to decrease in the future, the seller’s
supply curve shifts left now.

Like any cartel, a union is a group of sellers acting together in the hope of exerting their
joint market power.
Although trade policies do not affect a country’s overall trade balance, they do affect
specific firms and industries.
Most economists view the United States as an ongoing experiment that raises serious
doubts about the virtues of free trade.

An increase in the saving rate permanently increases the growth rate of real GDP per
person.
In the circular-flow diagram, factors of production include land, labor, and capital.
Is it possible that deficits do not burden future generations?

A decrease in the price of baseball bats will decrease the demand for baseballs.