
Figure 3-3
The figure above shows the supply and demand curves for two markets: the market for
original Michelangelo sculptures and the market for Ray Ban sunglasses. Which graph
most likely represents which market?
A) Graph B represents the market for original Michelangelo sculptures and Graph A
represents the market for Ray Ban sunglasses.
B) Graph A represents the market for original Michelangelo sculptures and Graph B
represents the market for Ray Ban sunglasses.
C) Graph A represents both the market for original Michelangelo sculptures and Ray
Ban sunglasses.
D) Graph B represents both the market for original Michelangelo sculptures and Ray
Ban sunglasses.
According to the text, there are three ways the government can help increase the
accumulation of knowledge capital. What are they?
A) protecting intellectual property rights, subsidizing research and development, and
subsidizing education
B) increasing taxes on firms, eliminating patents, and increasing the minimum wage
C) encouraging the use of trade secrets, expanding student loan programs, and
increasing the minimum wage
D) reducing taxes on capital, increasing Social Security payments, and lowering the
exchange rate

What does limited liability mean?
A) The owners of the business are personally responsible for paying expenses incurred
by the business.
B) Only employees can have a claim on the assets of the business.
C) The personal assets of the owners cannot be claimed if the business is bankrupt.
D) Anybody with a liability against a firm can claim only what their liability refers to.
Which of the following is an examples of spending on factors of production in the
circular flow model?
A) Orson buys a package of beef jerky at a convenience store.
B) Bernadette gets a manicure and pedicure before attending her parents’ anniversary
party.
C) Landon pays $100 for a season pass to a water park.
D) The “Suds Bucket” car wash buys new squeegees for all its employees.

Higher isocost lines correspond to higher
A) profits.
B) total costs of production.
C) input prices.
D) sales revenue.
Economic growth is represented on a production possibilities frontier model by the
production possibility frontier
A) shifting outward.
B) shifting inward.
C) becoming steeper.
D) becoming flatter.
Which of the following could cause nominal GDP to increase, but real GDP to
decrease?
A) The price level rises and the quantity of final goods and services produced rises.
B) The price level rises and the quantity of final goods and services produced falls.

C) The price level falls and the quantity of final goods and services produced rises.
D) The price level falls and the quantity of final goods and services produced falls.
The demand curve for a public good is also called the
A) total welfare curve.
B) marginal social benefit curve.
C) total social benefit curve.
D) total willingness-to-pay curve.
The cost borne by a producer in the production of a good or service is called
A) private cost.
B) public cost.
C) social cost.
D) internal cost.
Increasing the amount of consumption spending and reducing the amount of savings
________ investment expenditures, and ________ long-run economic growth in the
economy.
A) increases; increases
B) increases; decreases
C) decreases; increases
D) decreases; decreases
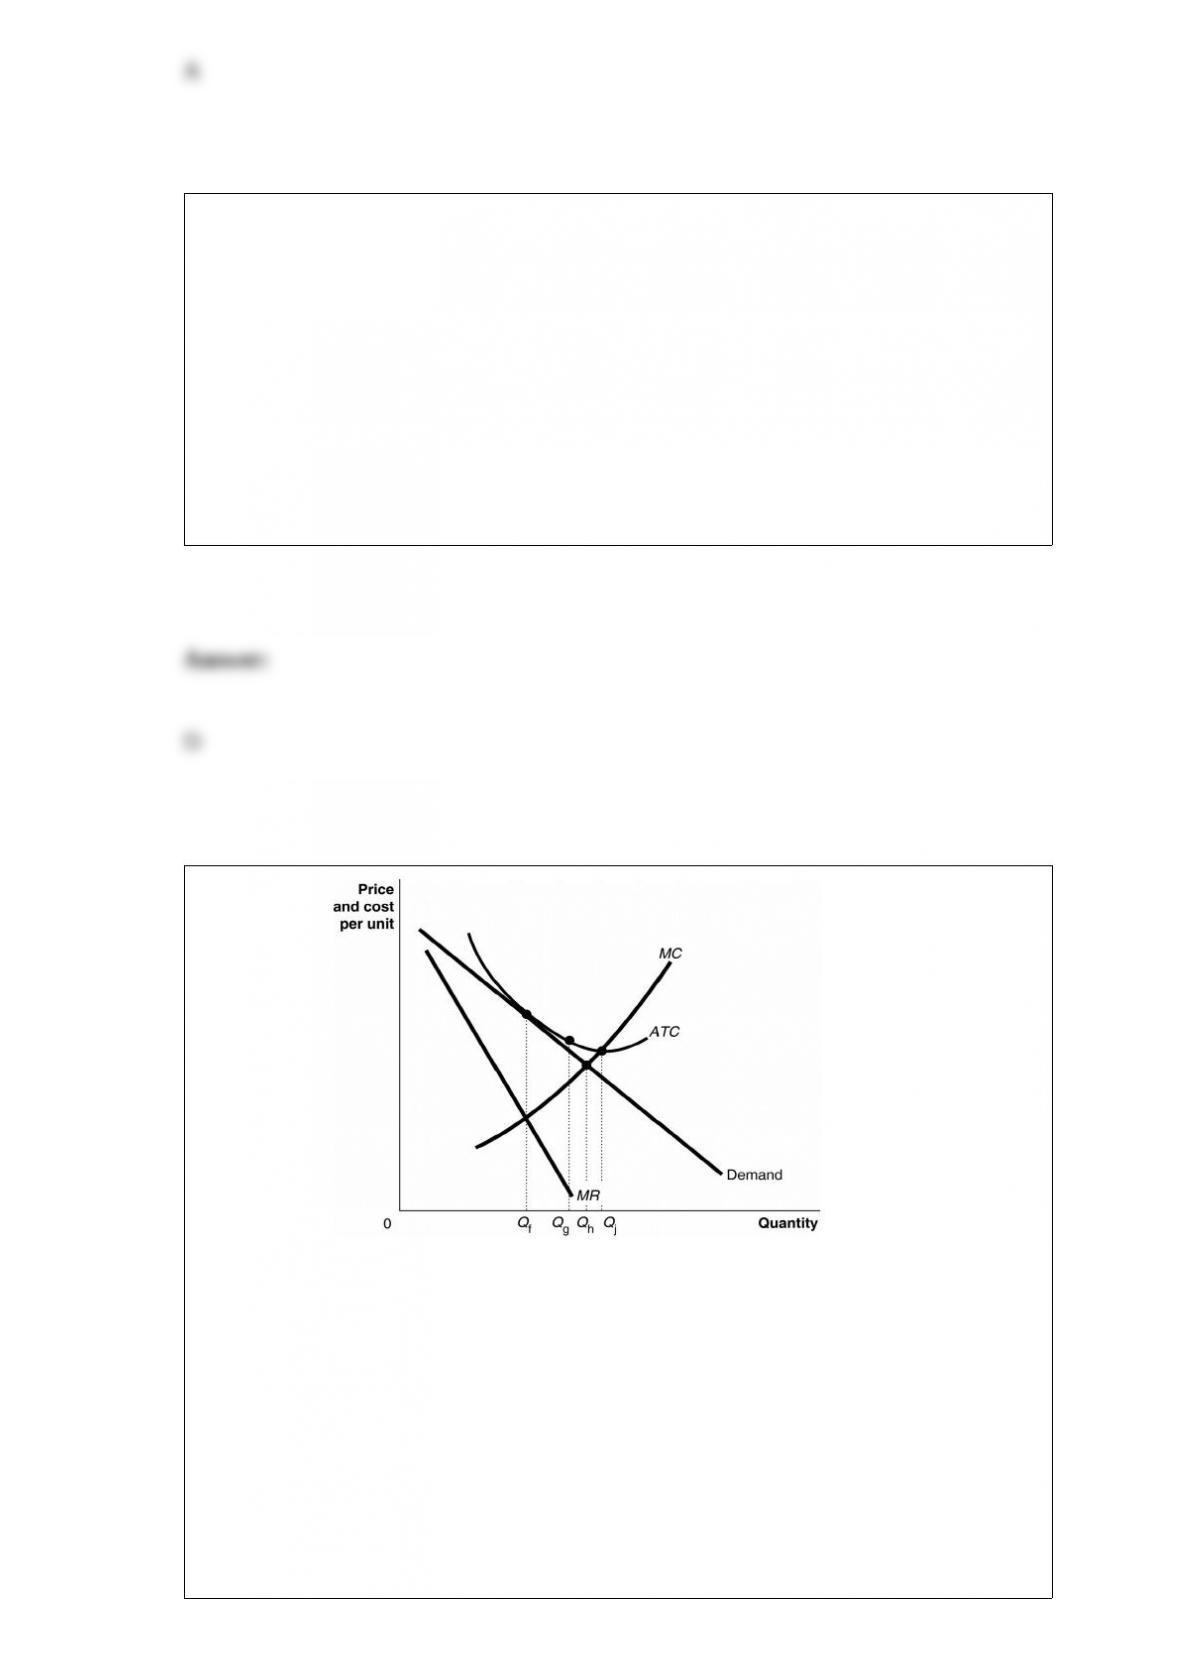
Figure 13-17
Suppose the firm is currently producing Qf units. What happens if it increases its output
to Qgunits?
A) Its average cost of production will fall and its profit will rise.
B) It will be taking advantage of economies of scale and will be able to lower the price
of its product.
C) It will move from a zero profit situation to a profit situation.

D) It will move from a zero profit situation to a loss situation.
If demand is taken into account, firms that use cost-plus pricing can adjust price by
A) letting sales fall, but hold the markup constant if demand falls.
B) lowering markups on price-elastic goods and raising markups on price-inelastic
goods.
C) raising markups on price-elastic goods and lowering markups on price-inelastic
goods.
D) letting sales rise, but hold the markup constant if demand rises.
The prevalence of Alzheimer’s dementia is very high among residents living in nursing
homes. A student concludes that it is likely that living in a nursing home causes
Alzheimer’s dementia. What is the flaw in the student’s reasoning?
A) The student has failed to take into account other causes of Alzheimer’s disease.
B) The student is drawing a false conclusion; he is confusing cause and effect.
C) The student is using an inadequate sample size.
D) The student is drawing a false conclusion by making the mistake of omitting critical
variables such as the age and gender of the residents.

If real GDP increases we know for sure that
A) output has risen.
B) prices have risen.
C) prices have risen but output has remained constant.
D) prices have remained constant.