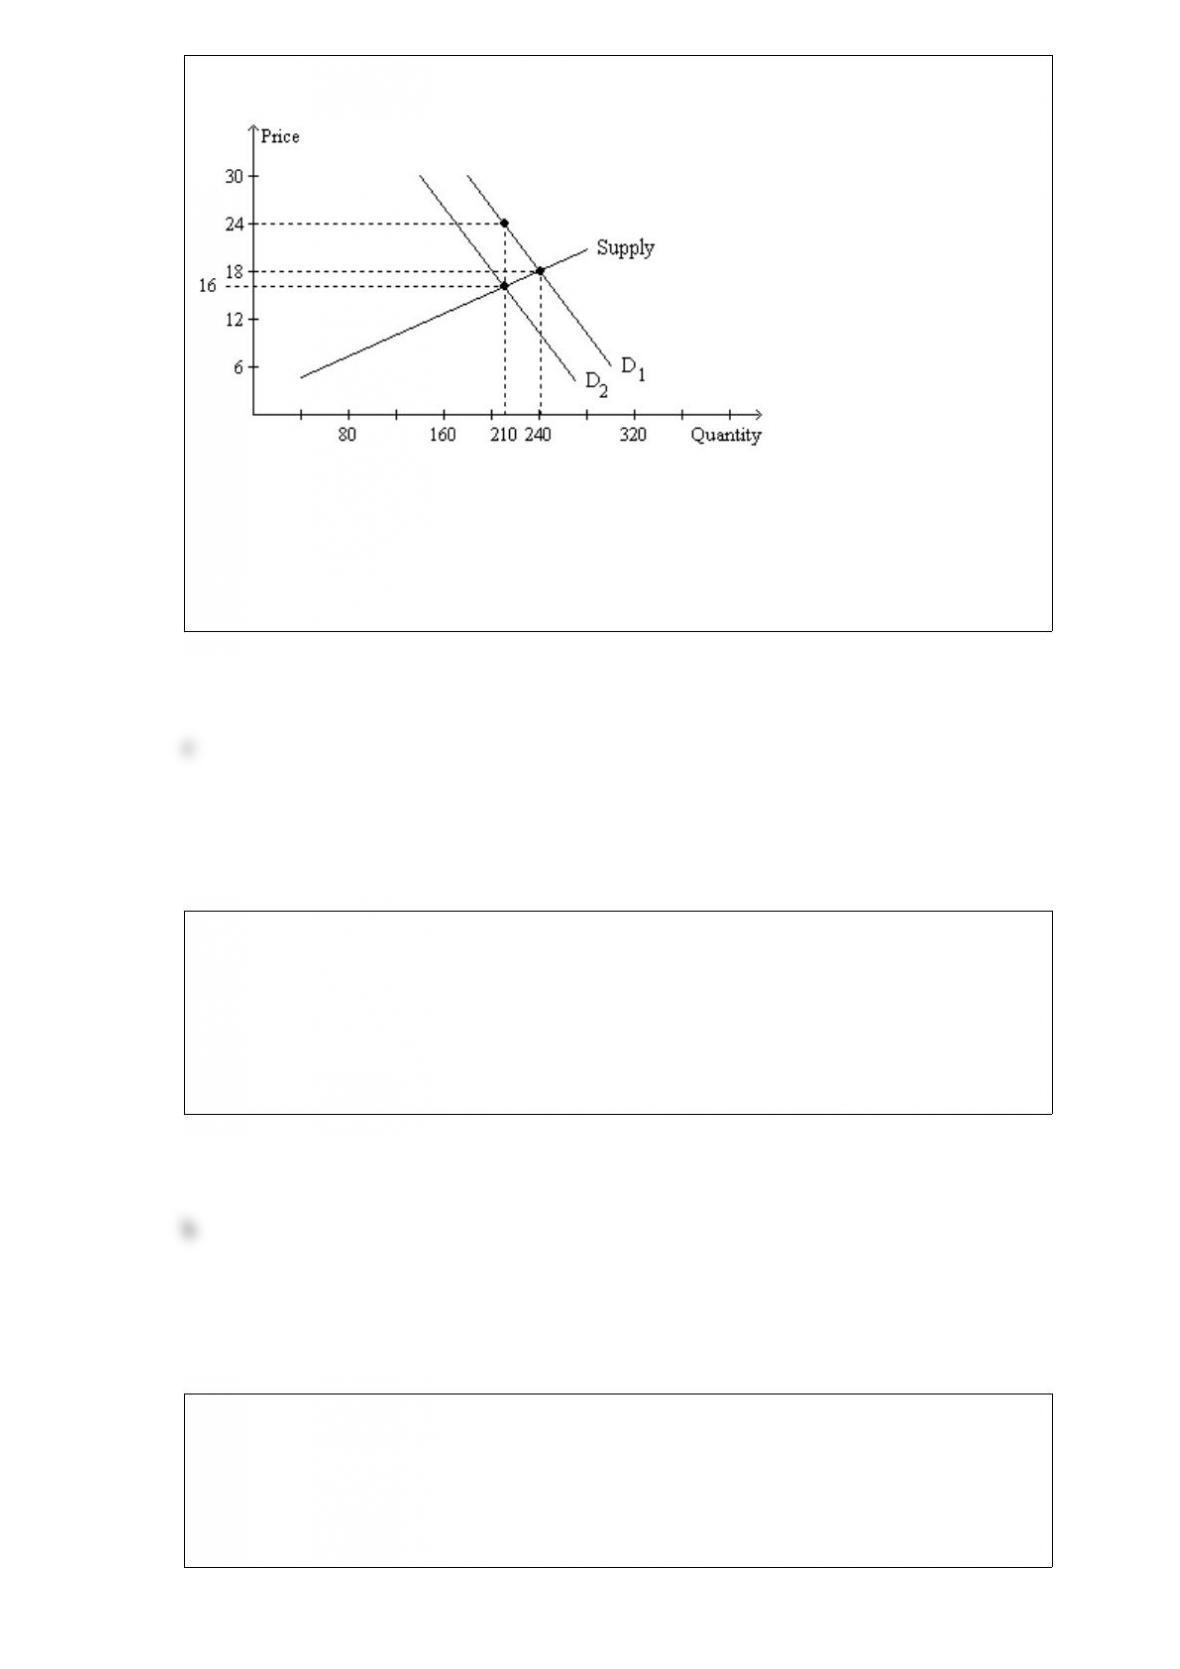
Figure 624
Refer to Figure 624. Which of the following statements is correct?
a. The amount of the tax per unit is $6.
b. The tax leaves the size of the market unchanged.
c. The tax is levied on buyers of the good, rather than on sellers.
d. All of the above are correct.
If the quantity demanded of a certain good responds only slightly to a change in the
price of the good, then the
a. demand for the good is said to be elastic.
b. demand for the good is said to be inelastic.
c. law of demand does not apply to the good.
d. demand curve for the good shifts only slightly in response to a change in price.
Which of these activities will most likely result in an external benefit?
a. A college student buys a deck of cards to play solitaire in her dorm room.
b. An elderly woman plants a flower garden on the vacant lot next to her house.
c. An executive purchases a book to read on a business trip.
d. A tenyearold uses his allowance to buy new Nike shoes.

Indiadesh is a country that produces two goods, textiles and computers. Last year,
Indiadesh produced 50,000 textiles and 1300 computers. This year it produced 45,000
textiles and 1100 computers. Given no further information, which of the following
events could explain this change?
a. Indiadesh decreased unemployment.
b. Indiadesh experienced an improvement in textilemaking technology.
c. Indiadesh experienced an improvement in computermaking technology.
d. Indiadesh experienced a reduction in resources.
The demand for a good becomes more inelastic
a. as more close substitutes for it become available.
b. as it is increasingly viewed as a luxury good.
c. as the market is defined more broadly.
d. the longer the time horizon.
Which of the following is an example of a highly organized market?
a. the market for textbooks
b. the market for spa services
c. the market for soybeans
d. the market for ice cream

In the short run, which of the following rates of growth in the money supply is likely to
lead to the lowest level of unemployment in the economy?
a. 3 percent per year
b. 5 percent per year
c. 7 percent per year
d. 9 percent per year
The following table contains a monthly demand schedule for large, singletopping,
carryout pizzas.
PriceQuantity Demanded
$15A
$2025
If the law of demand applies to these pizzas, then A could be
a. 40.
b. 35.
c. 30.
d. All of the above could be correct.
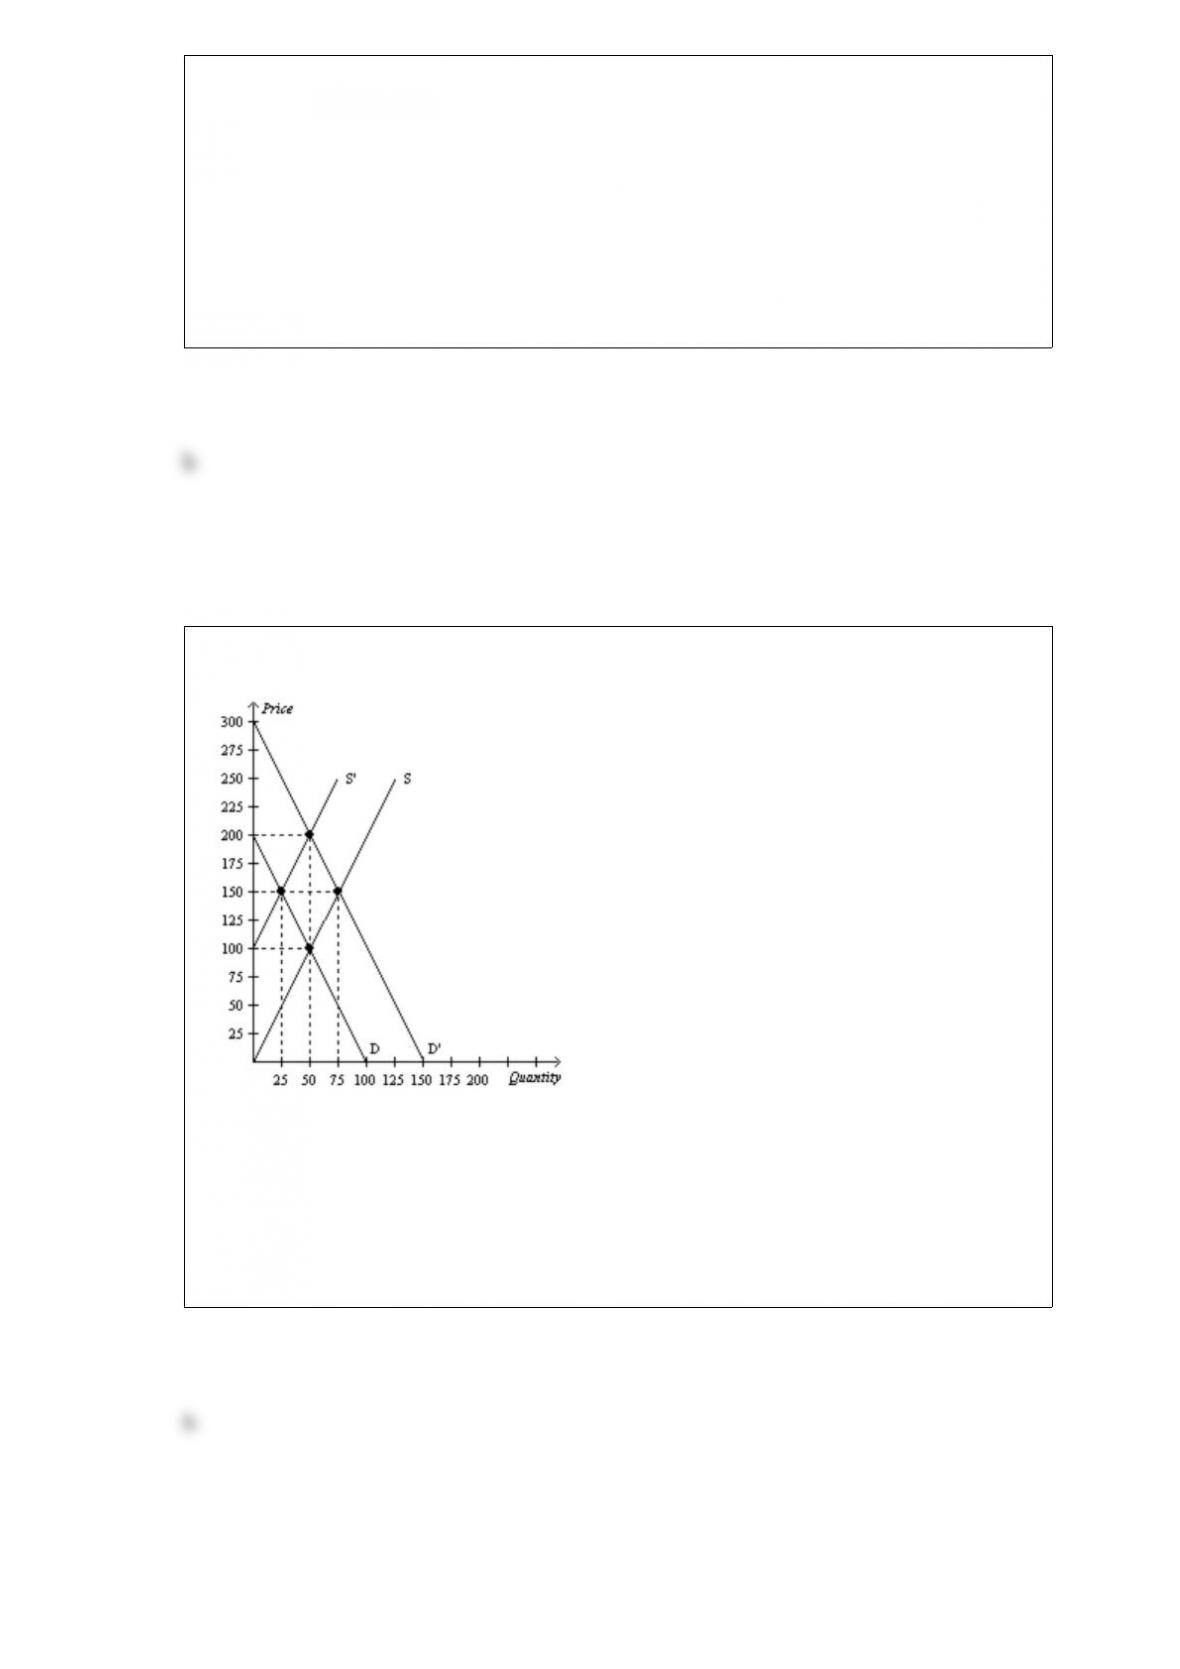
Figure 711
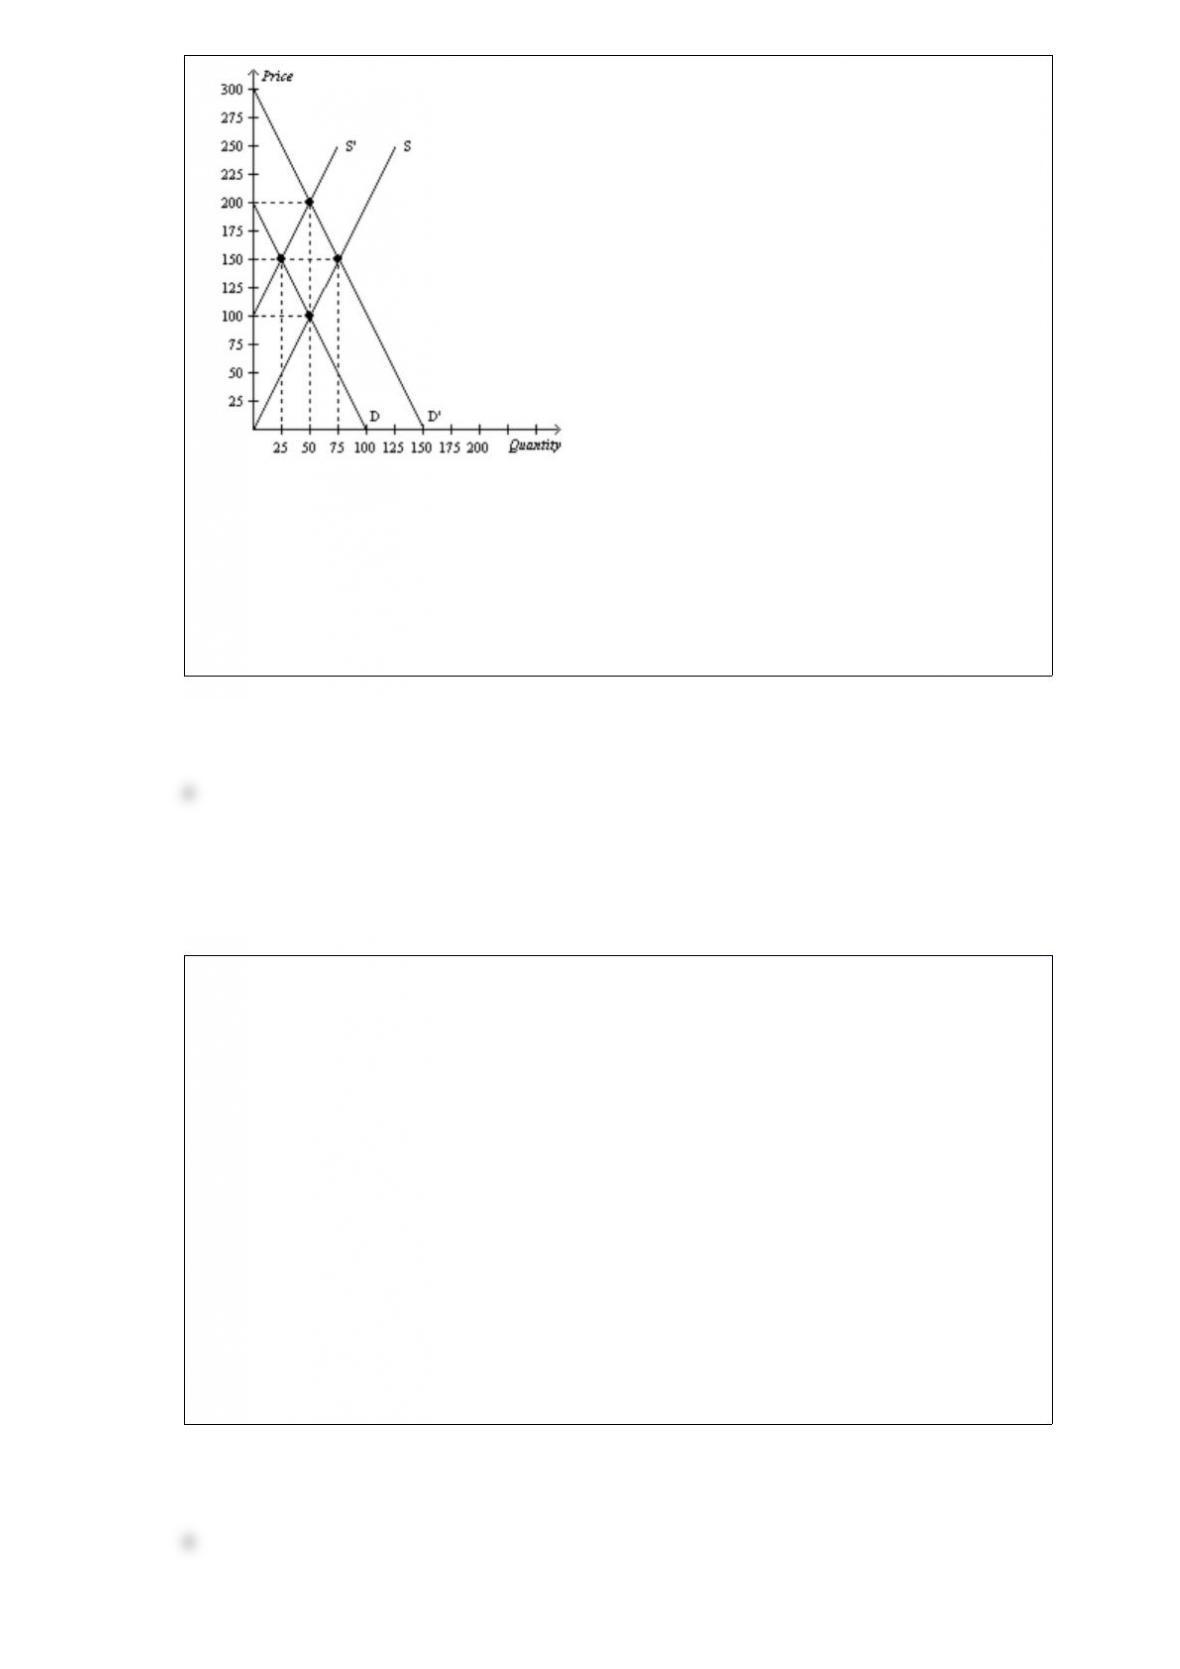
Refer to Figure 711. If the supply curve is S and the demand curve shifts from D to D’,
what is the increase in producer surplus due to new producers entering the market?
a. $625
b. $2,500
c. $3,125
d. $5,625
Table 75
For each of three potential buyers of oranges, the table displays the willingness to pay
for the first three oranges of the day. Assume Allison, Bob, and Charisse are the only
three buyers of oranges, and only three oranges can be supplied per day.
First OrangeSecond OrangeThird Orange
Allison$2.00$1.50$0.75
Bob$1.50$1.00$0.60
Charisse$0.75$0.25$0
Refer to Table 75. Which of the following statements is correct?
a. Neither Bob’s consumer surplus nor Charisse’s consumer surplus can exceed
Allison’s consumer surplus, for any price of an orange.
b. All three individuals will buy at least one orange only if the price of an orange is less
than $0.25.
c. If the price of an orange is $0.60, then consumer surplus is $4.90.
d. All of the above are correct.

A tax imposed on the buyers of a good will lower the
a. price paid by buyers and lower the equilibrium quantity.
b. price paid by buyers and raise the equilibrium quantity.
c. effective price received by sellers and lower the equilibrium quantity.
d. effective price received by sellers and raise the equilibrium quantity.
Assume that Greece has a comparative advantage in fish and Germany has a
comparative advantage in cars. Also assume that Germany has an absolute advantage in
both fish and cars. If these two countries specialize and trade so as to maximize the
benefits of specialization and trade, then
a. the two countries’ combined output of both goods will be higher than it would be in
the absence of trade.
b. Greece will produce more fish than it would produce in the absence of trade.
c. Germany will produce more cars than it would produce in the absence of trade.
d. All of the above are correct.
If the supply of a product decreases, then we would expect equilibrium price
a. to increase and equilibrium quantity to decrease.
b. to decrease and equilibrium quantity to increase.
c. and equilibrium quantity to both increase.
d. and equilibrium quantity to both decrease.

Trade makes costs
a. higher and reduces the variety of goods and services available.
b. higher but raises the variety of goods and services available.
c. lower but reduces the variety of goods and services available.
d. lower and raises the variety of goods and services available.
Annie is an excellent baker and Sam has a plentiful farm. If Sam trades eggs and butter
to Annie for some of Annie’s bread and pastries,
a. only Sam is made better off by trade.
b. only Annie is made better off by trade.
c. both Sam and Annie are made better off by trade.
d. neither Sam nor Annie are made better off by trade.
Suppose Susan can wash three windows per hour or she can iron six shirts per hour.
Paul can wash two windows per hour or he can iron five shirts per hour.
a. Susan has an absolute advantage over Paul in washing windows.
b. Susan has a comparative advantage over Paul in washing windows.
c. Paul has a comparative advantage over Susan in ironing shirts.
d. All of the above are correct.
When describing the opportunity cost of two producers, economists use the term
a. natural advantage.
b. trading advantage.

c. comparative advantage.
d. absolute advantage.
Differences in scientific judgment between economists are similar to all of the
following except
a. astronomers debating whether the sun or earth was at the center of the solar system.
b. meteorologists debating the existence of global warming.
c. two politicians arguing about the fairness of the tax code.
d. explorers debating whether or not the earth was flat before the time of Christopher
Columbus.
Economic models
a. are constructed to mirror reality as closely as possible, and in this respect economic
models are no different from other scientific models.
b. are constructed to mirror reality as closely as possible, and in this respect economic
models are very different from other scientific models.
c. are simplifications of reality, and in this respect economic models are no different
from other scientific models.
d. are simplifications of reality, and in this respect economic models are very different
from other scientific models.
Table 710
The following table represents the costs of five possible sellers.
SellerCost
Abby$1,600
Bobby$1,300
Dianne$1,100
Evaline$900
Carlos$800
Refer to Table 710. If the market price is $1,200, the producer surplus in the market is
a. $100.
b. $800.
c. $400.
d. $500.
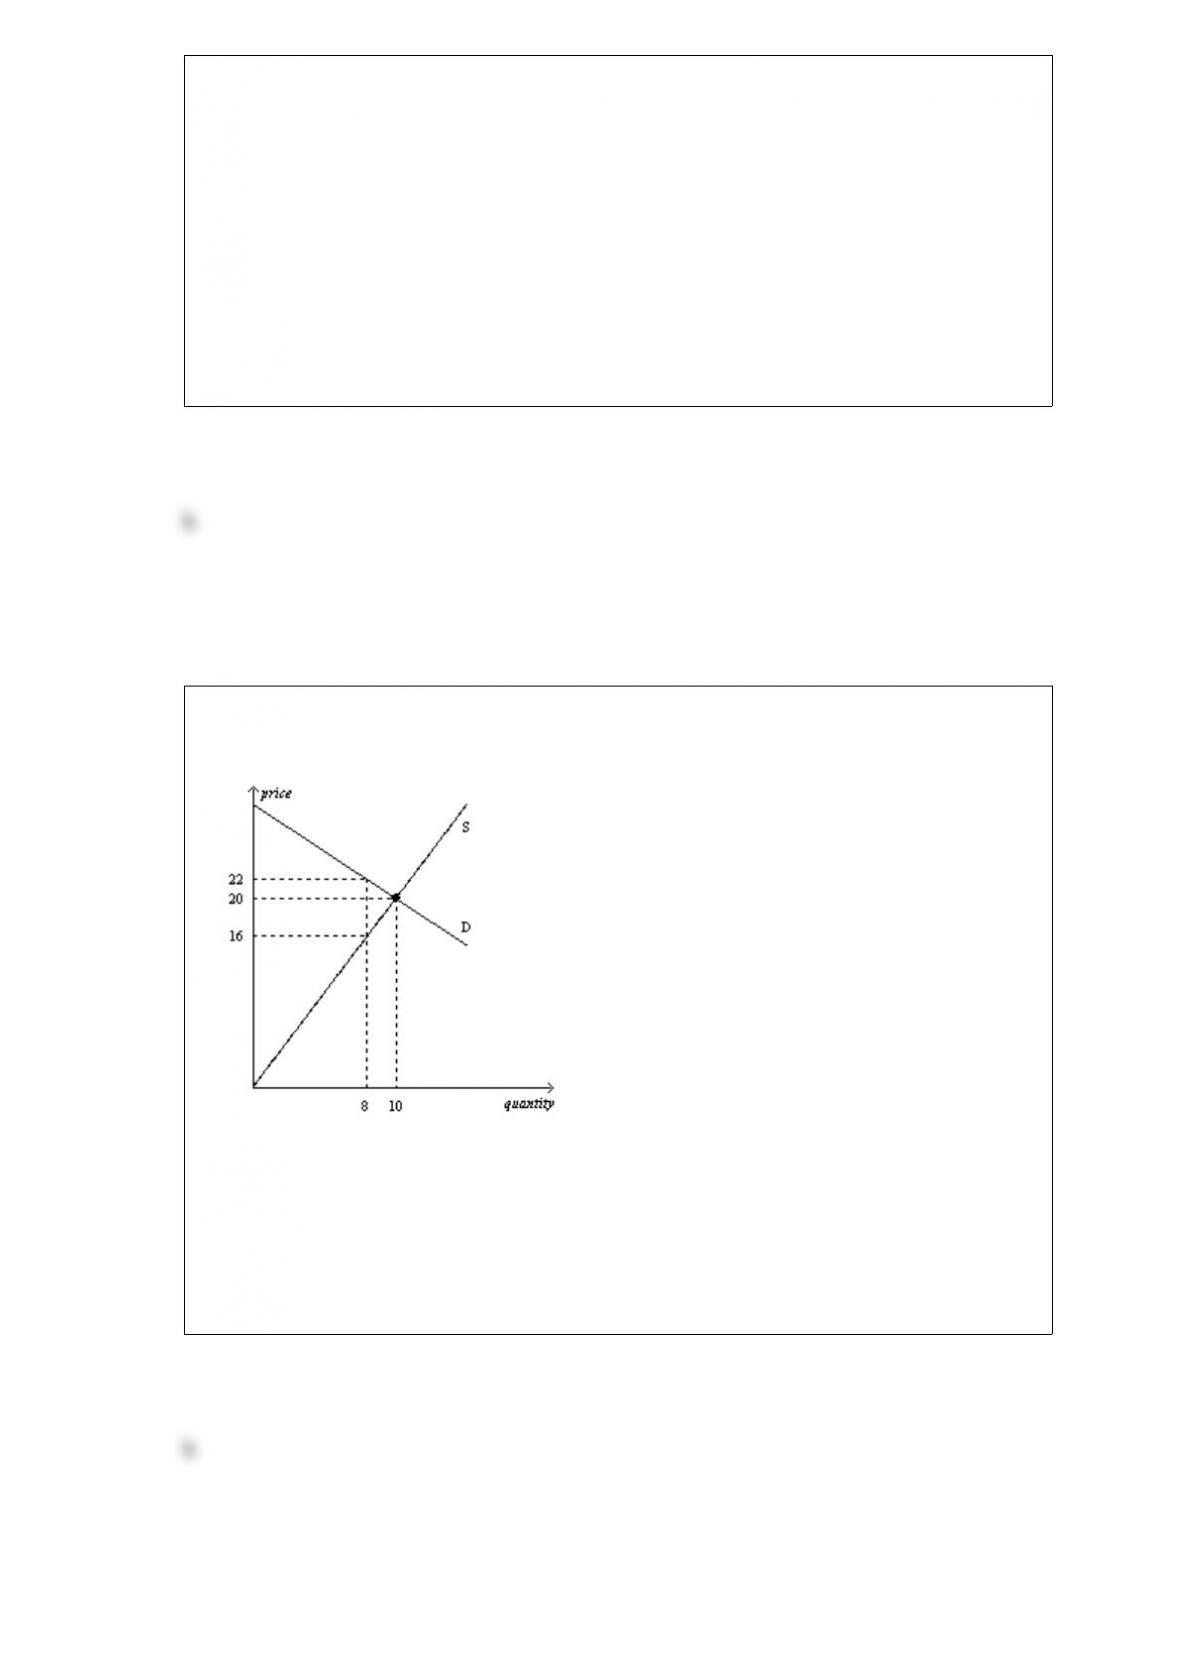
Figure 627
This figure shows the market demand and market supply curves for good Z.
Refer to Figure 627. Suppose a tax of $3 per unit is imposed on this market. How
much will sellers receive per unit after the tax is imposed?
a. $16
b. between $16 and $20
c. between $20 and $22
d. $22
Billie Jean has $120 to spend and wants to buy either a new amplifier for her guitar or a
new mp3 player to listen to music while working out. Both the amplifier and the mp3
player cost $120, so she can only buy one. This illustrates the basic concept that
a. trade can make everyone better off.
b. people face tradeoffs.
c. rational people think at the margin.
d. decisions made at the margin are not particularly important.
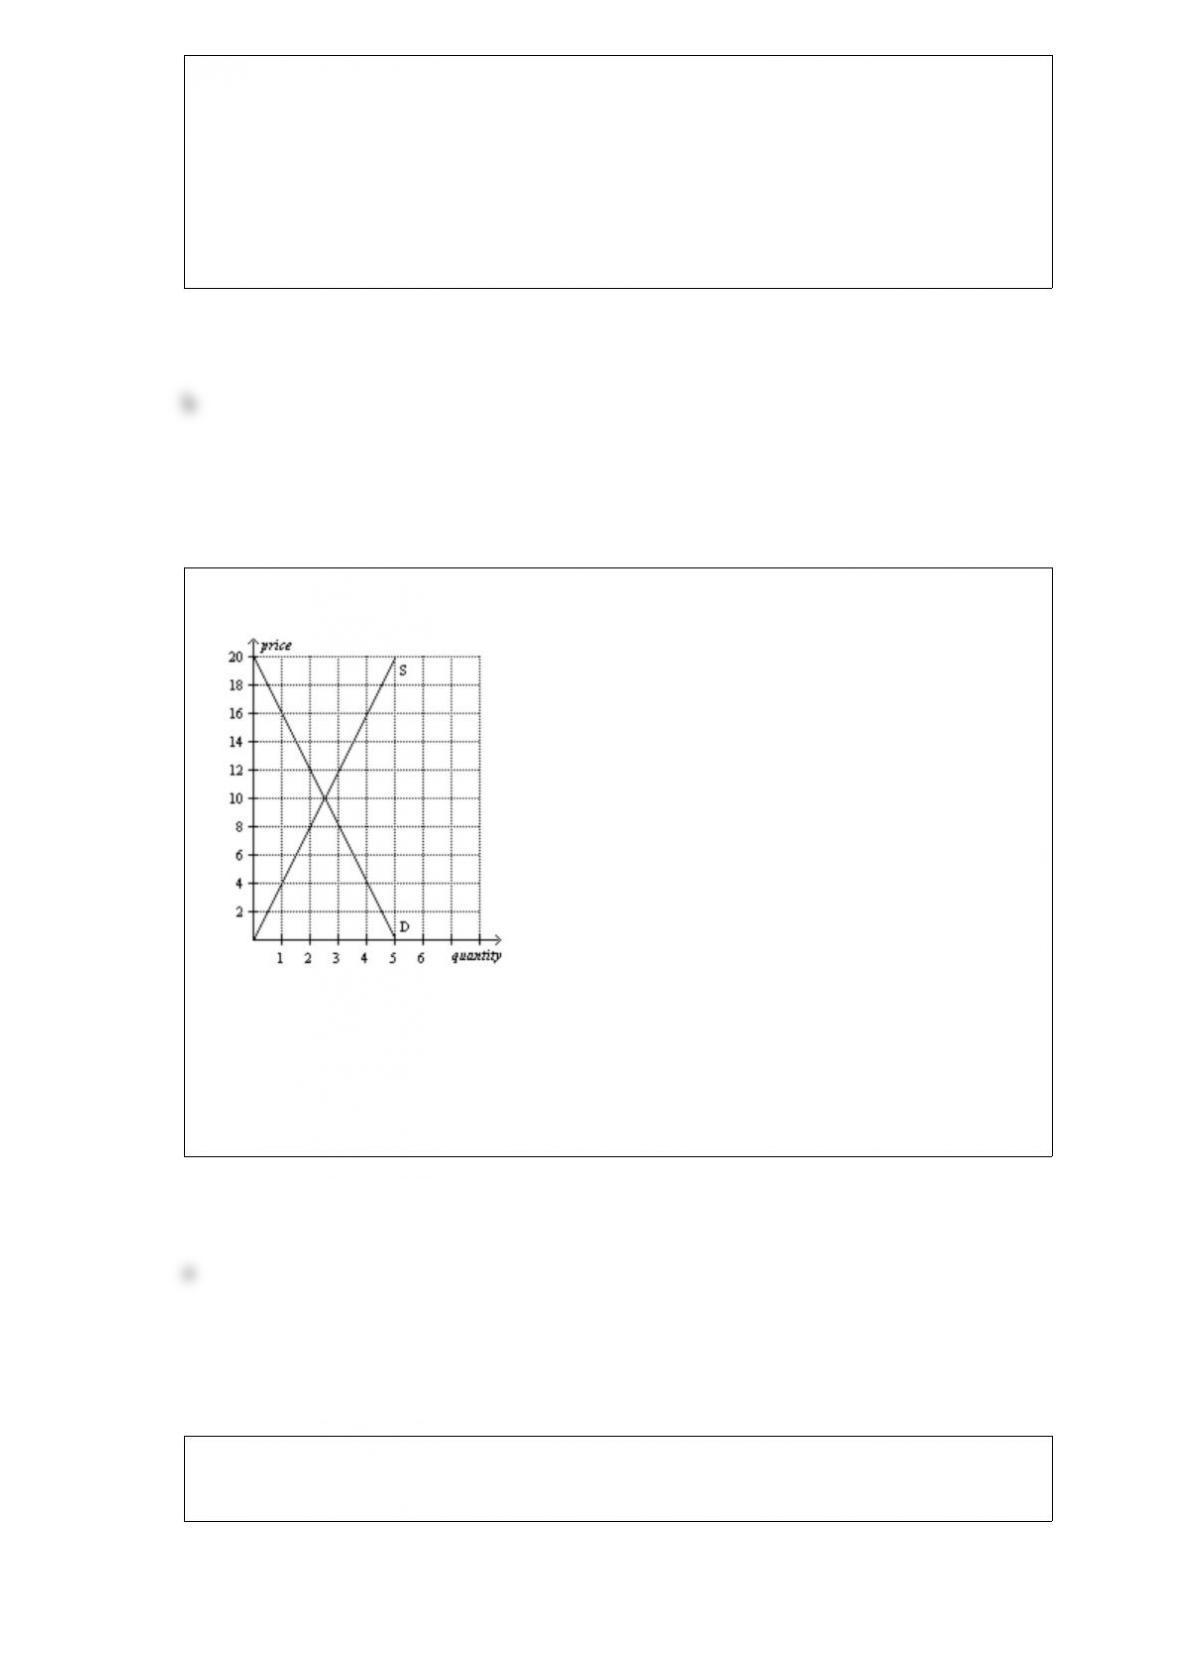
Figure 421
Refer to Figure 421. What is the equilibrium quantity in this market?
a. 2.5 units
b. 5 units
c. 7.5 units
d. 10 units
Figure 715
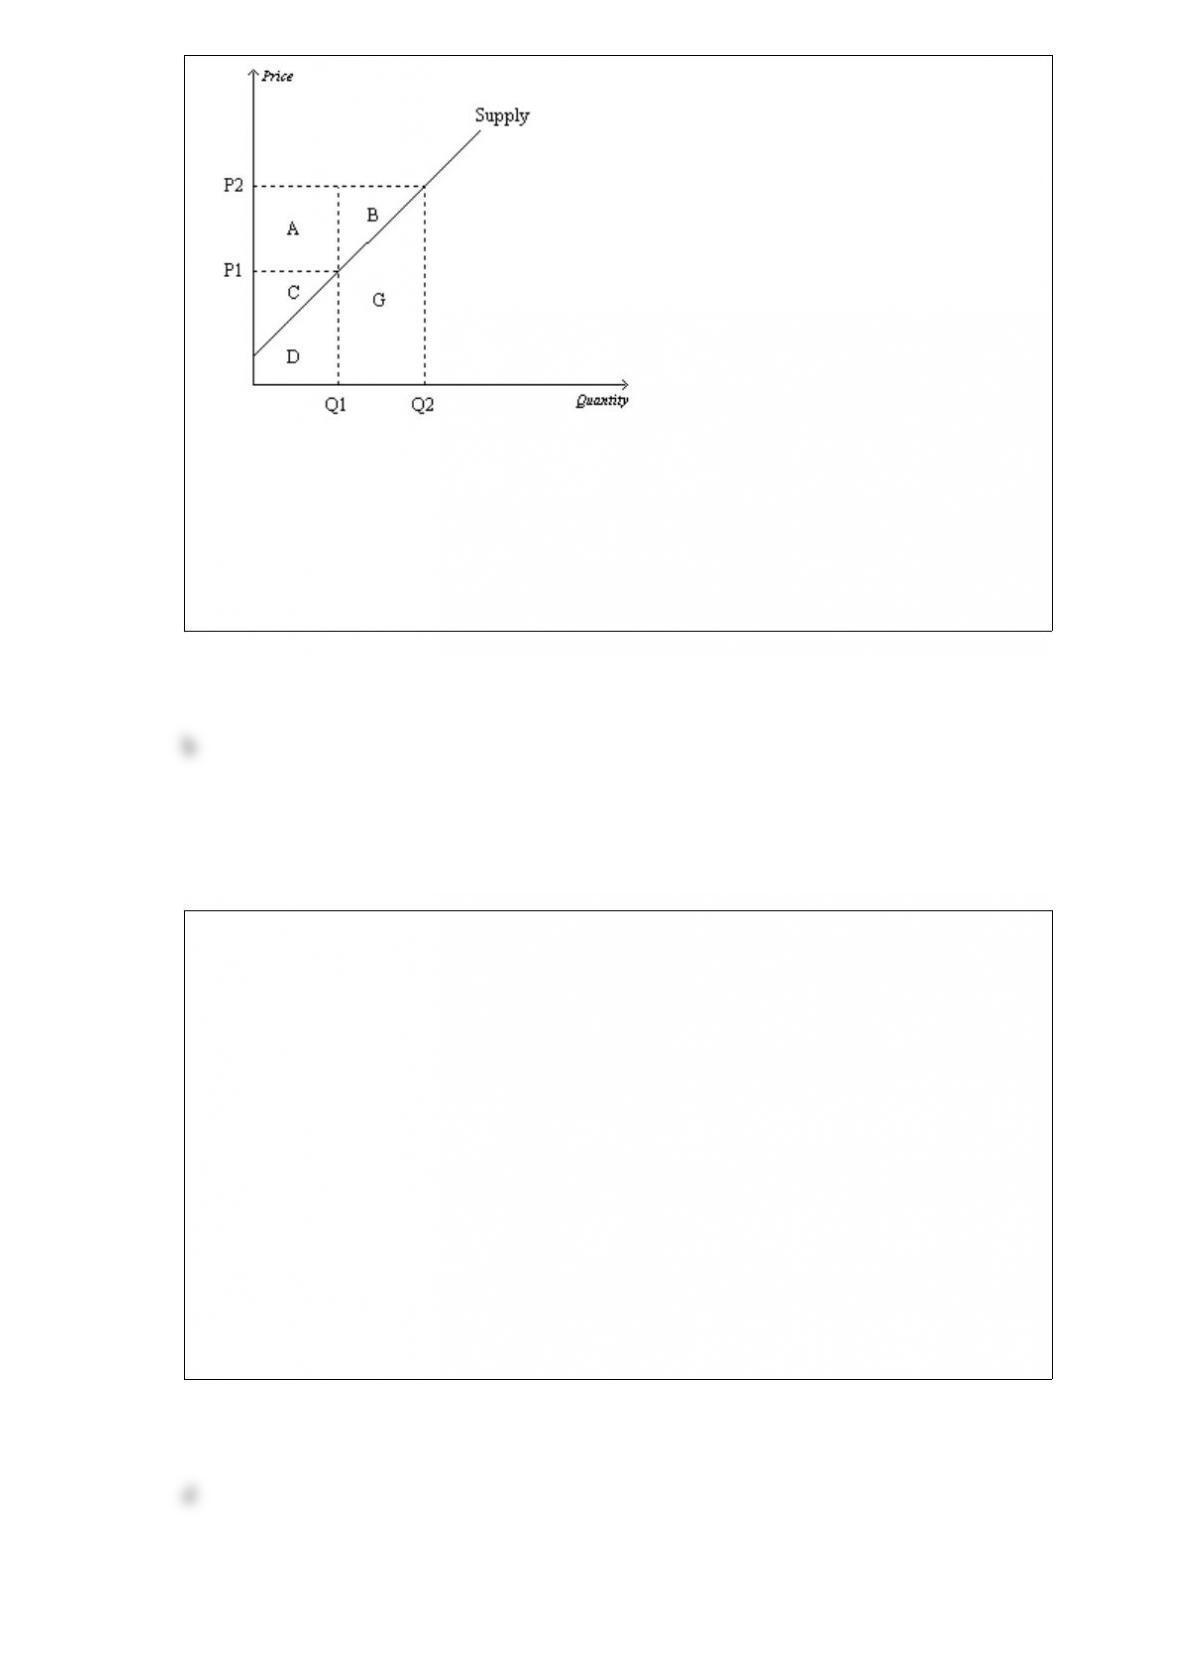
Refer to Figure 715. When the price rises from P1 to P2, which area represents the
increase in producer surplus due to new producers entering the market?
a. A
b. B
c. A+B
d. G
Table 311
Assume that Max and Min can switch between producing mittens and producing hats at
a constant rate.
Labor Hours Needed to Make 1Quantity Produced in 36 Hours
MittensHatsMittensHats
Max26186
Min24189
Refer to Table 311. Which of the following points would not be on Max’s production
possibilities frontier, based on a 36hour production period?
a. (18 mittens, 0 hats)
b. (12 mittens, 2 hats)
c. (6 mittens, 4 hats)
d. (2 mittens, 6 hats)
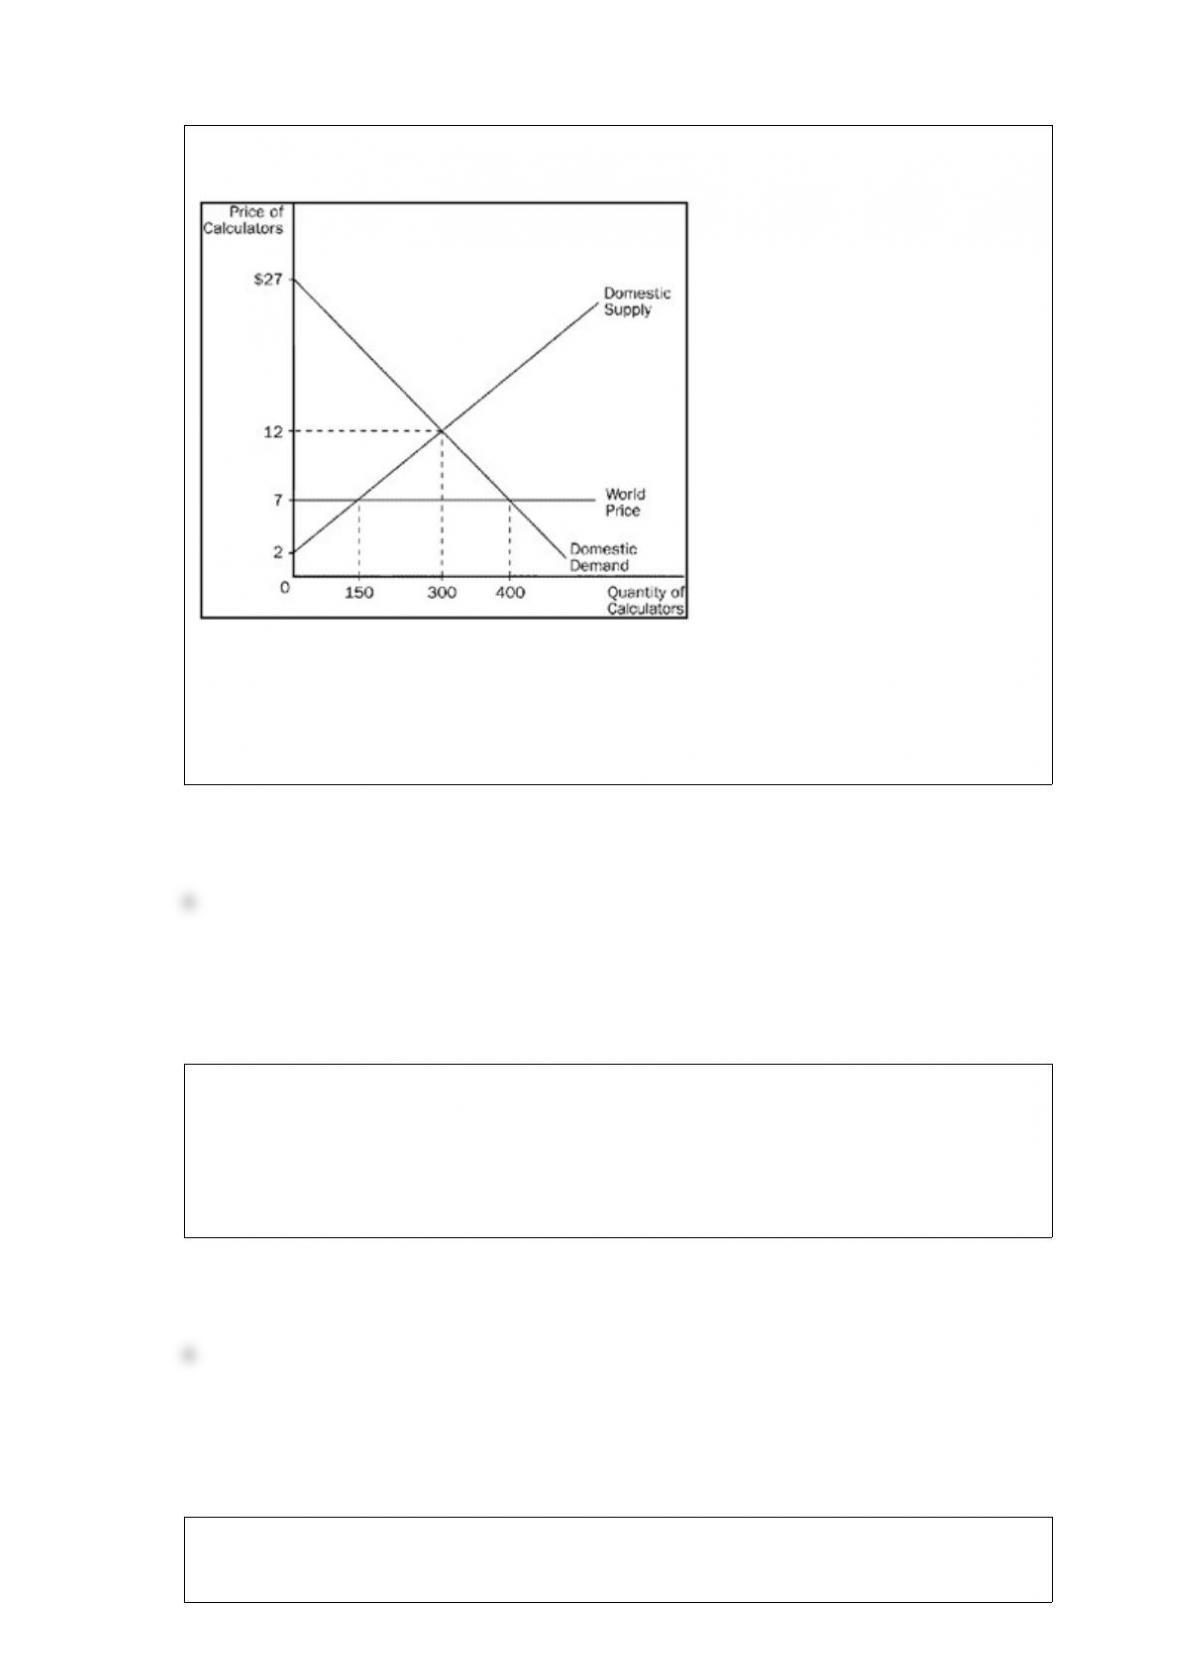
Figure 94. The domestic country is Nicaragua.
Refer to Figure 94. The change in total surplus in Nicaragua because of trade is
a. $625, and this is an increase in total surplus.
b. $750, and this is an increase in total surplus.
c. $625, and this is a decrease in total surplus.
d. $750, and this is a decrease in total surplus.
An increase in quantity demanded
a. results in a movement downward and to the right along a demand curve.
b. results in a movement upward and to the left along a demand curve.
c. shifts the demand curve to the left.
d. shifts the demand curve to the right.
Total output in an economy increases when each person specializes because
a. there is less competition for the same resources.

b. each person spends more time producing that product in which he or she has a
comparative advantage.
c. a wider variety of products will be produced within each country due to
specialization.
d. government necessarily plays a larger role in the economy due to specialization.
Assume, for Colombia, that the domestic price of coffee without international trade is
higher than the world price of coffee. This suggests that
a. other countries have a comparative advantage over Colombia in producing coffee.
b. Colombia has an absolute advantage over other countries in producing coffee.
c. Colombia will export coffee if international trade is allowed.
d. Colombian coffee buyers will become worse off if international trade is allowed.
The circularflow diagram is a
a. visual model of the economy.
b. visual model of the relationships among money, prices, and businesses.
c. model that shows the effects of government on the economy.
d. mathematical model of how the economy works.
Figure 39
Uzbekistan’s Production Possibilities FrontierAzerbaijan’s Production Possibilities
Frontier
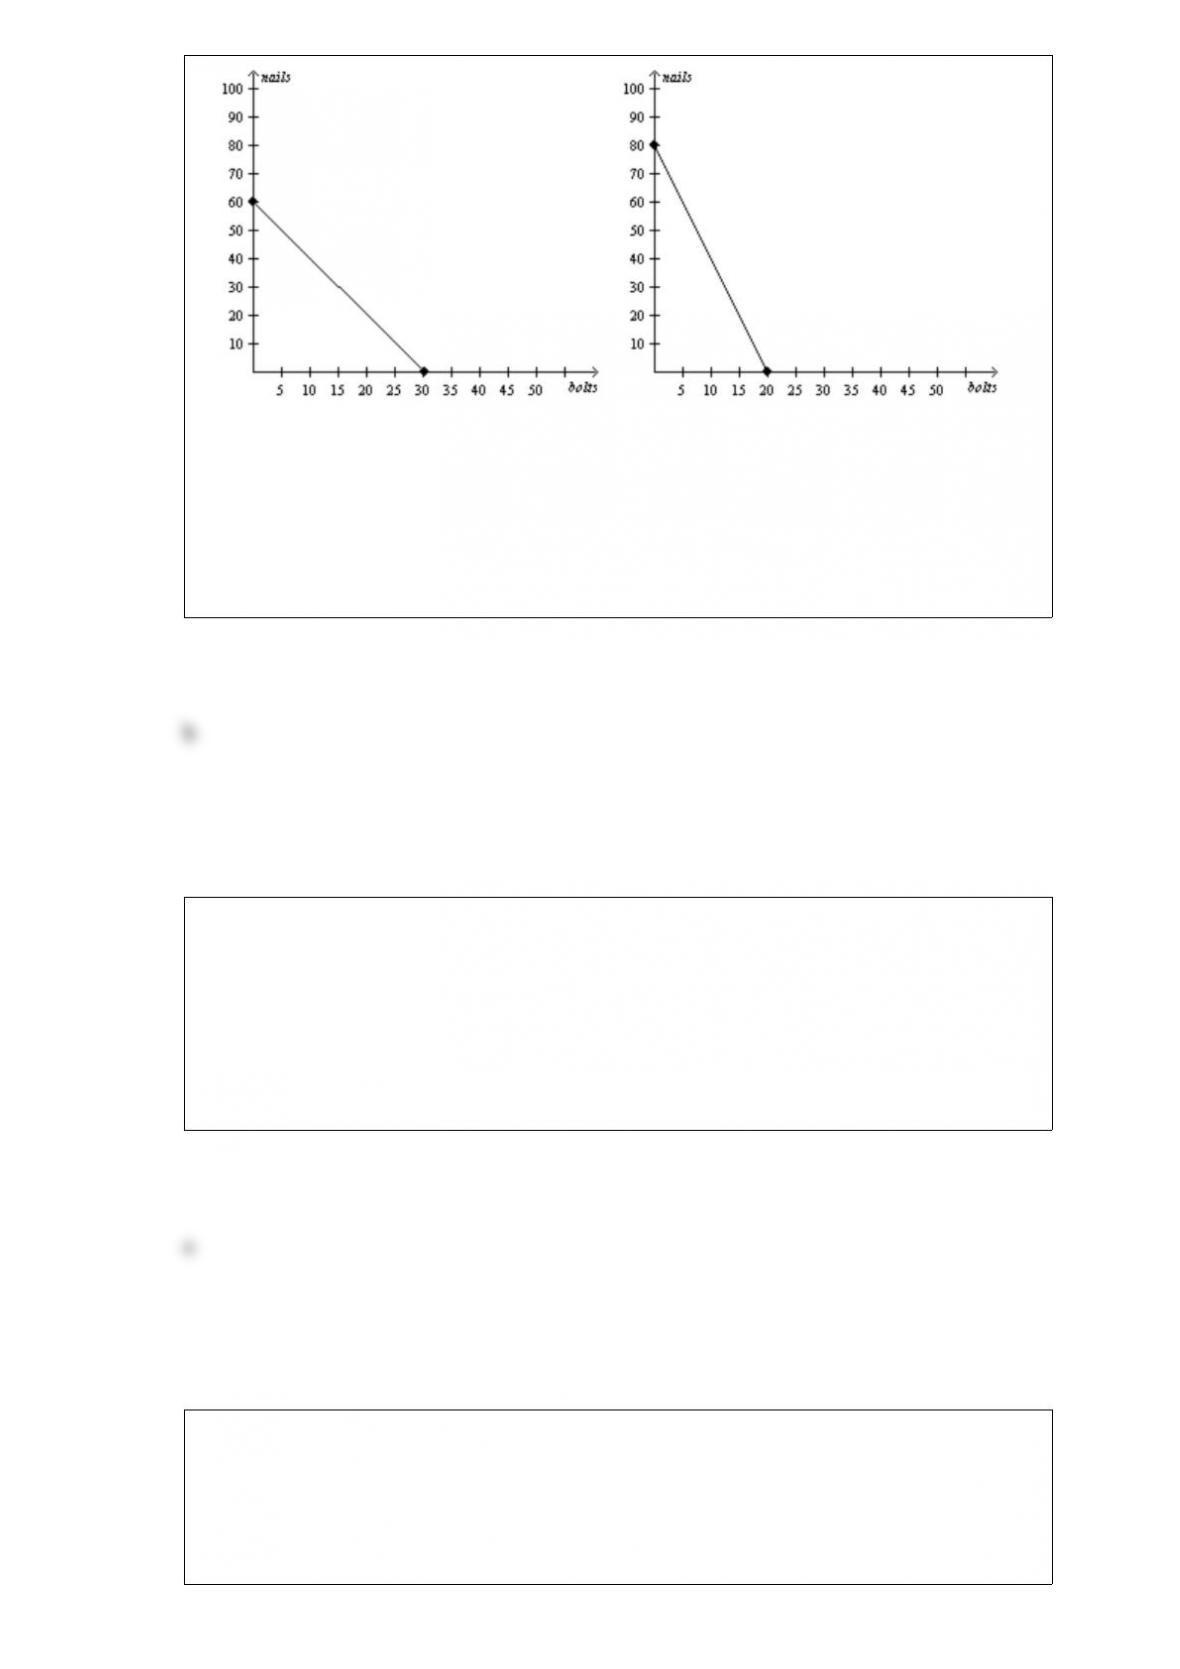
Refer to Figure 39. If Uzbekistan and Azerbaijan each divides its time equally between
making bolts and making nails, then total production is
a. 15 bolts and 40 nails.
b. 25 bolts and 70 nails.
c. 30 bolts and 80 nails.
d. 50 bolts and 140 nails.
When an economy is operating inside its production possibilities frontier, we know that
a. there are unused resources or inefficiencies in the economy.
b. all of the economy’s resources are fully employed.
c. economic growth would have to occur in order for the economy to move to a point on
the frontier.
d. in order to produce more of one good, the economy would have to give up some of
the other good.
Table 56
PriceTotal
Revenue
$10$5,000
$15$6,000
$20$6,000
$25$5,000
$30$3,000
Refer to Table 56. Using the midpoint method, demand is unit elastic when quantity
demanded changes from
a. 500 to 400.
b. 400 to 300.
c. 300 to 200.
d. 200 to 100.
Figure 711
Refer to Figure 711. If the demand curve is D and the supply curve shifts from S’ to S,
what is the change in producer surplus?
a. Producer surplus increases by $625.
b. Producer surplus increases by $1,875.
c. Producer surplus decreases by $625.
d. Producer surplus decreases by $1,875.