
1) If duopoly firms that are not colluding were able to successfully collude, then
a.price and quantity would rise.
b.price and quantity would fall.
c.price would rise and quantity would fall.
d.price would fall and quantity would rise.
2) The resources that a taxpayer devotes to complying with the tax laws are a type of
a.marginal tax.
b.administrative burden.
c.deadweight loss.
d.Both b and c are correct.
3) Suppose the cost to erect a tornado siren in a small town is $15,000. In addition,
suppose the value of a human life is $10 million. By what percentage would the siren
need to reduce the risk of a fatality for the benefits of the siren to exceed the costs of the
siren?
a.By at least 0.015 percentage points.
b.By at least 0.15 percentage points.
c.By at least 1.5 percentage points.
d.By at least 5 percentage points.
4) Figure 21-25
The figure pertains to a particular consumer. On the axes, X represents the quantity of
good X and Y represents the quantity of good Y.
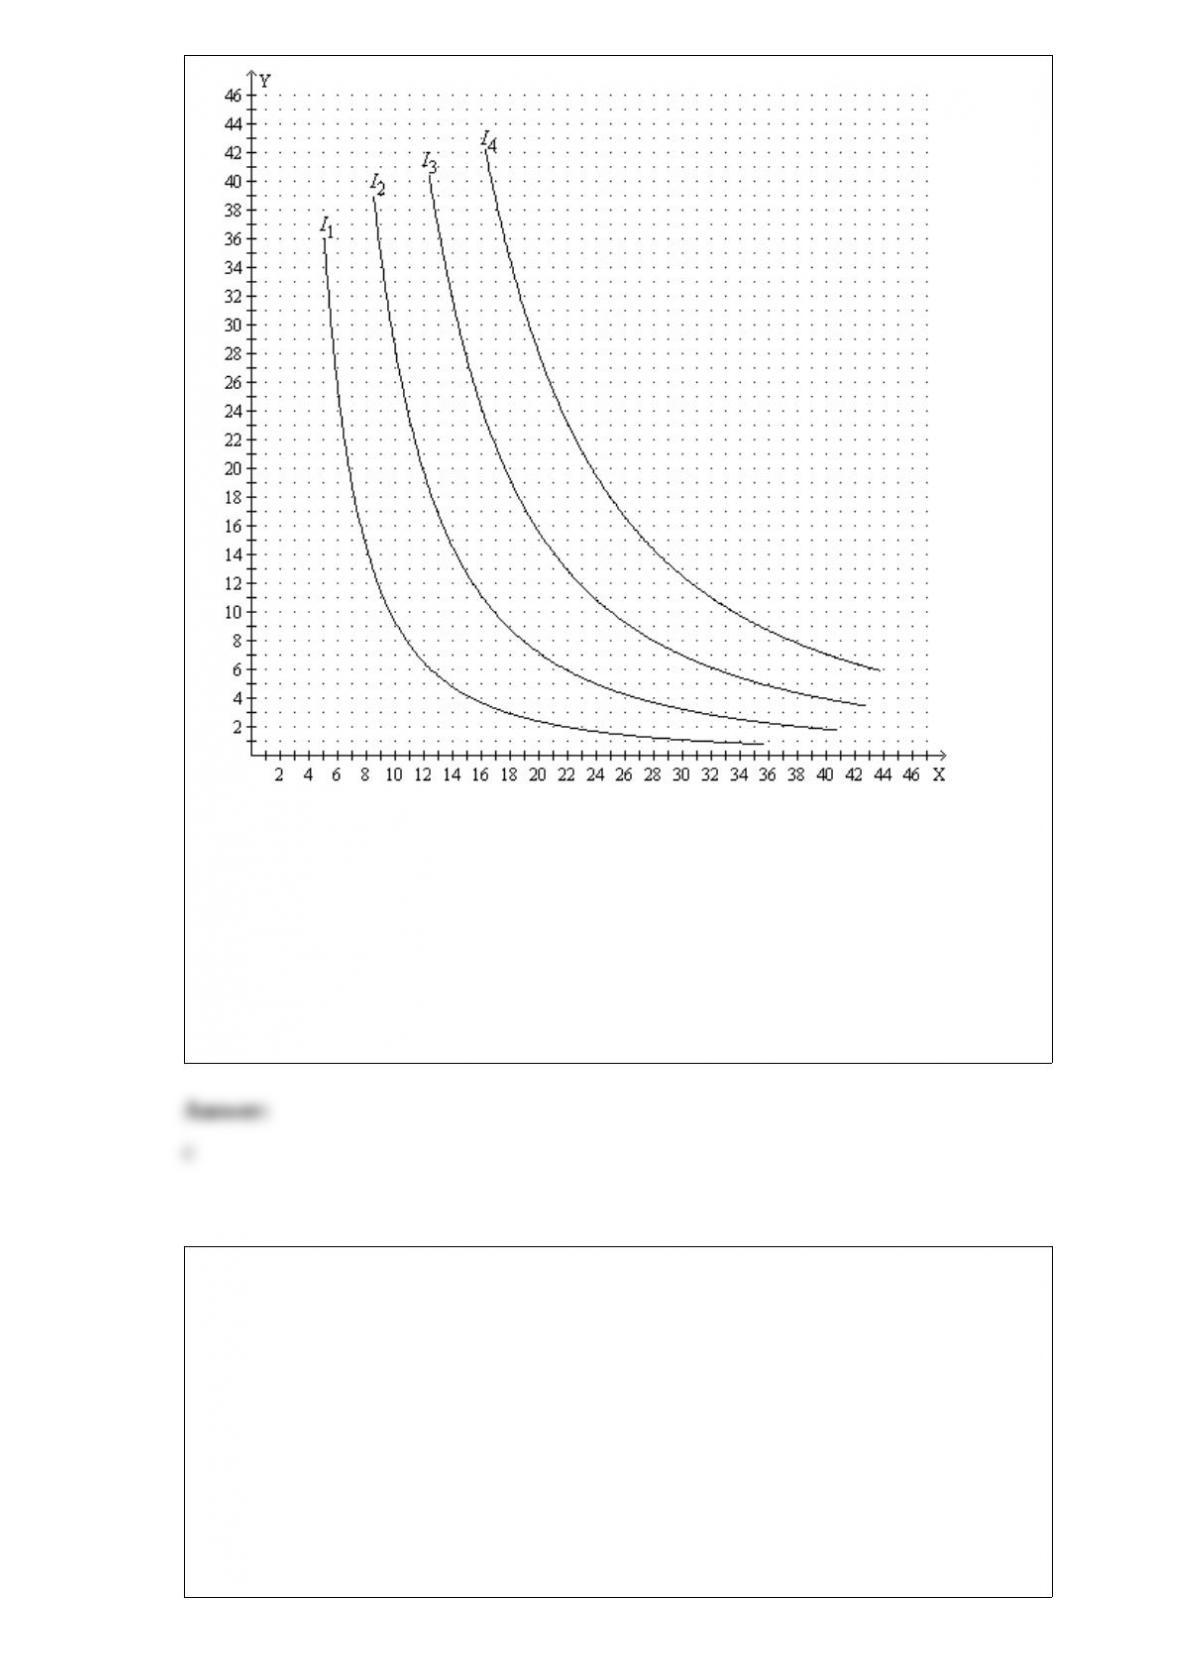
Refer to Figure 21-25. Suppose the price of good X is $15, the price of good Y is $10,
and the consumer’s income is $450. Then the consumer’s optimal choice is represented
by a point on which curve?
a.I1
b.I2
c.I3
d.I4
5) Scenario 22-3
At issue in a particular city vote is how much to spend, per person, on road repair next
year. Among the 10,000 voters, 2,900 prefer to spend $500 per person, but no more;
2,200 prefer to spend $600 per person, but no more; 1,900 prefer to spend $800 per
person, but no more; 1,600 prefer to spend $1,200 but no more, and 1,400 prefer to
spend $1,400 per person, but no more.
Refer to Scenario 22-3. If there is a vote on whether to spend $600 per person or $800
per person, the median voter will vote to spend
a.$800 per person and the voting outcome will be $800 per person.
b.$800 per person and the voting outcome will be $600 per person.
c.$600 per person and the voting outcome will be $800 per person.
d.$600 per person and the voting outcome will be $600 per person.
6) Revenues from social insurance taxes are earmarked to pay for Social Security and
Medicare.
a.True
b.False
7) When consumers are exposed to additional choices that result from the introduction
of a new product,
a.their satisfaction is likely to be lowered as a result of their having to make additional
choices.
b.a product-variety externality is said to occur.
c.an advertising externality is said to occur.
d.consumers are likely to experience negative consumption externalities.
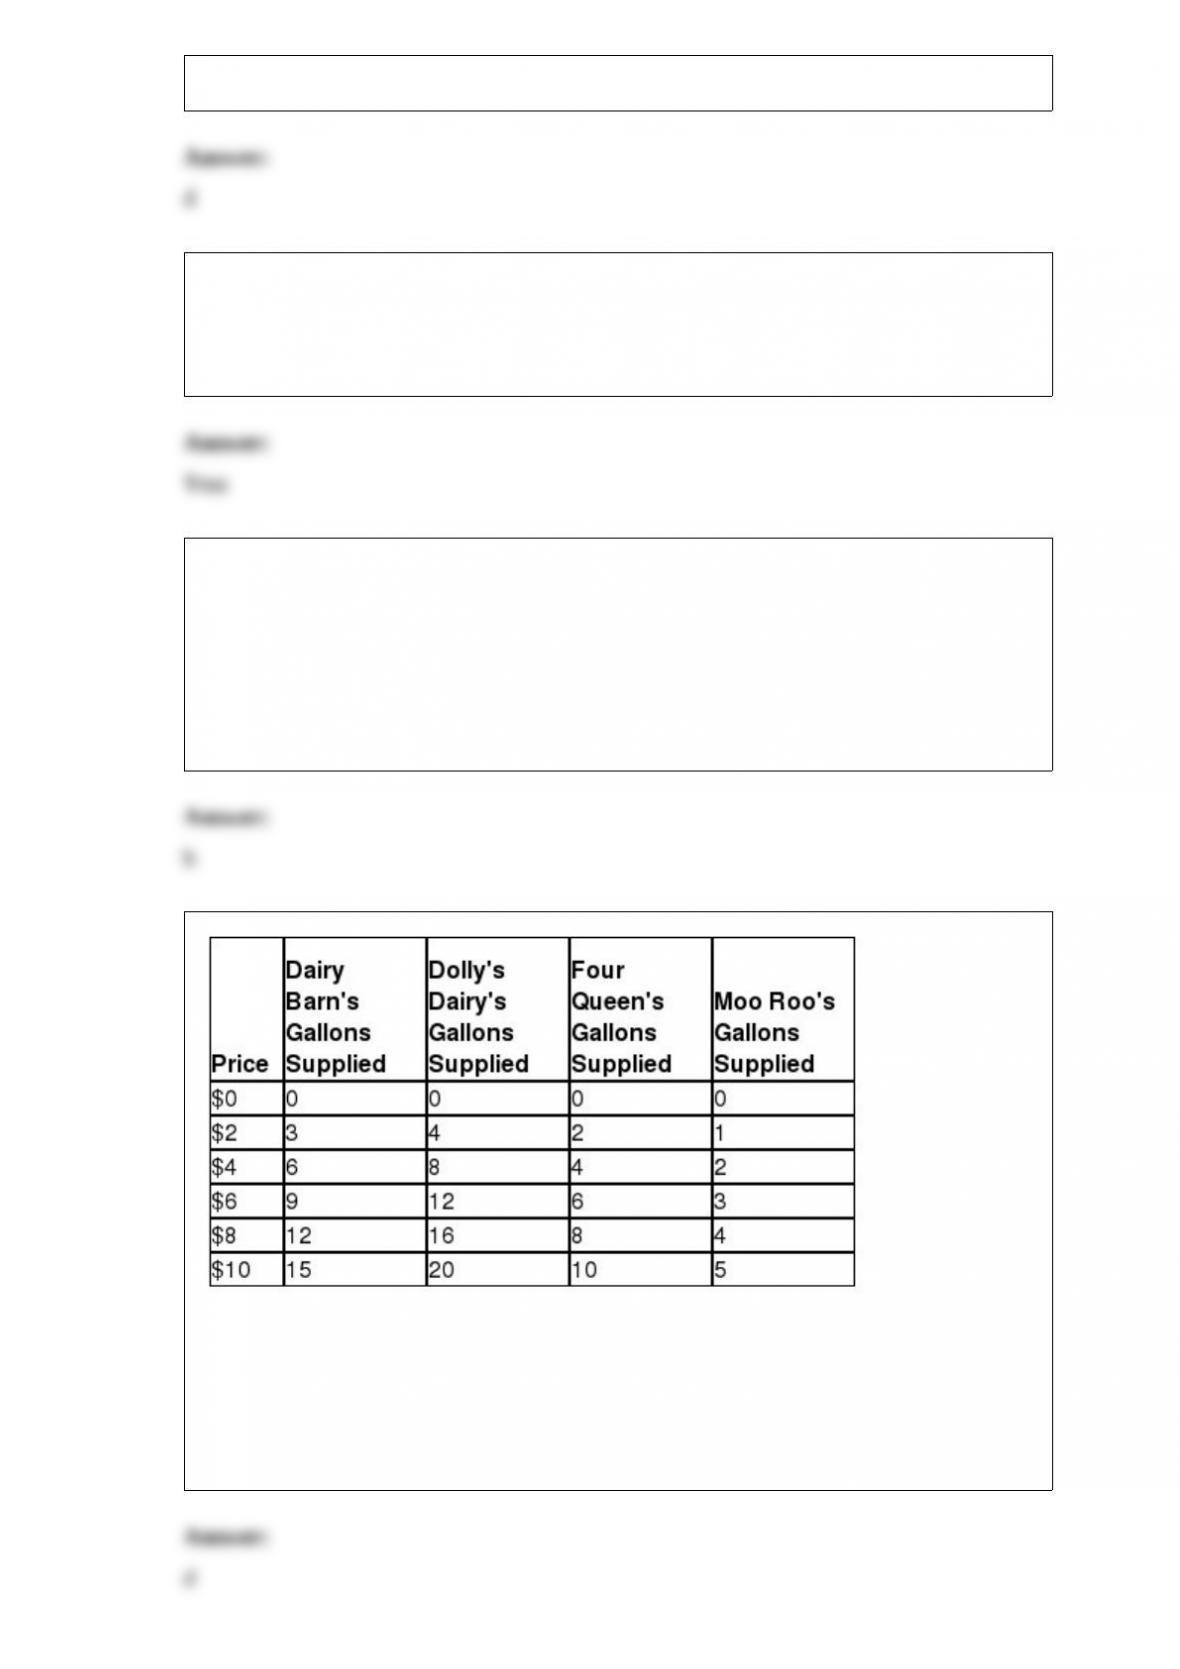
8) If these are the only four sellers in the market for ice cream, then the market quantity
supplied at a price of $8 is
a.10 gallons.
b.20 gallons.
c.32 gallons.
d.40 gallons.

9) The Smith family owns an apple orchard in Illinois. The Jones family owns an apple
orchard in Wisconsin. A late frost destroys half of the Smith family’s harvest for one
year. For the Jones family, their
a.transitory income for the year of the frost likely exceeds their permanent income.
b.permanent income likely exceeds their transitory income for the year of the frost.
c.permanent income will be more affected by the frost than their transitory income.
d.Both a and c are correct.
10) The market wage could be higher than the equilibrium wage if a worker
a.belongs to a labor union.
b.is covered by a minimum-wage law.
c.is paid an efficiency wage.
d.All of the above are correct.
11) In a competitive market with free entry and exit, if all firms have the same cost
structure, then
a.all firms will operate at their efficient scale in the short run.
b.all firms will operate at their efficient scale in the long run.
c.the price of the product will differ across firms.
d.Both a and b are correct.