One bag of flour is sold for $1.00 to a bakery, which uses the flour to bake bread that is
sold for $3.00 to consumers. A second bag of flour is sold for $1 to a grocery store who
sells it to a consumer for $2.00. Taking these four transactions into account, what is the
effect on GDP?
a. GDP increases by $3.00.
b. GDP increases by $5.00.
c. GDP increases by $6.00.
d. GDP increases by $7.00.
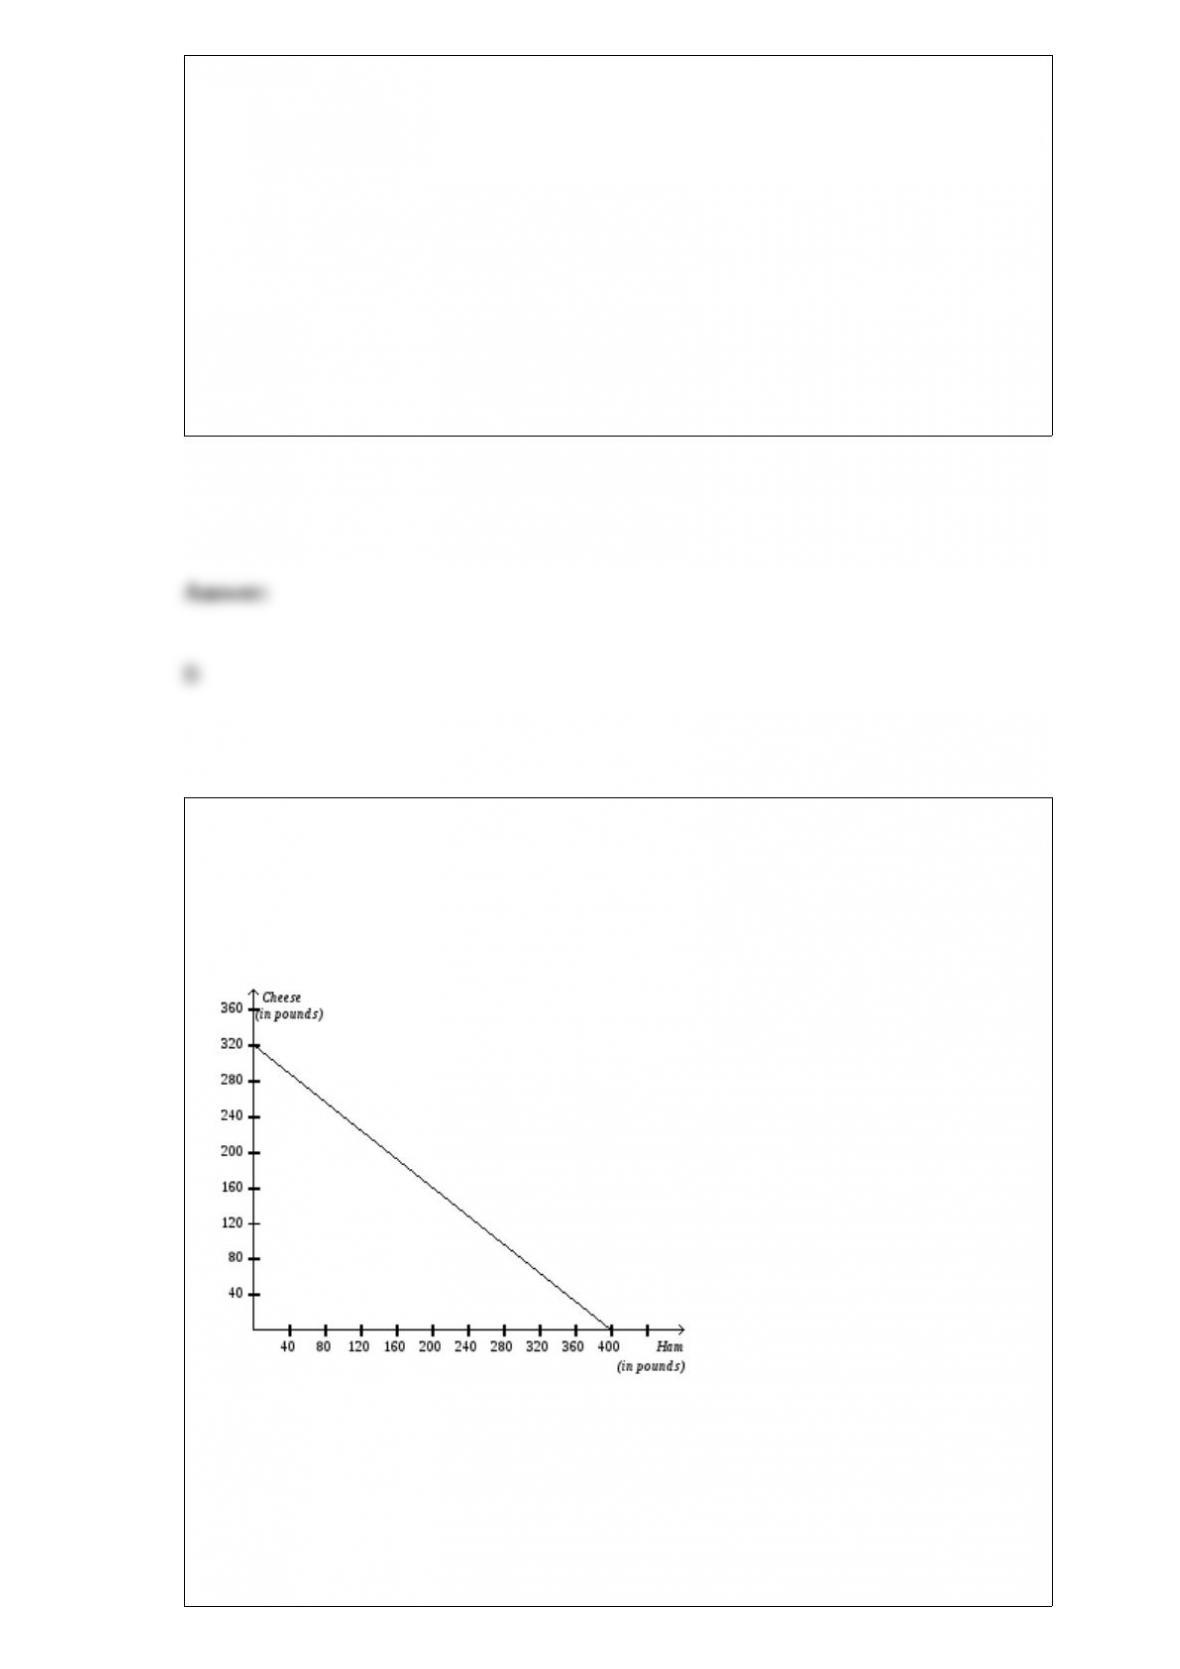
Figure 3-11
The graph below represents the various combinations of ham and cheese (in pounds)
that the nation of Bonovia could produce in a given month.
Refer to Figure 3-11. If the production possibilities frontier shown is for 240 hours of
production, then which of the following combinations of ham and cheese could
Bonovia produce in 240 hours?
a. 225 pounds of ham and 140 pounds of cheese
b. 280 pounds of ham and 100 pounds of cheese
c. 355 pounds of ham and 80 pounds of cheese
d. 330 pounds of ham and 60 pounds of cheese
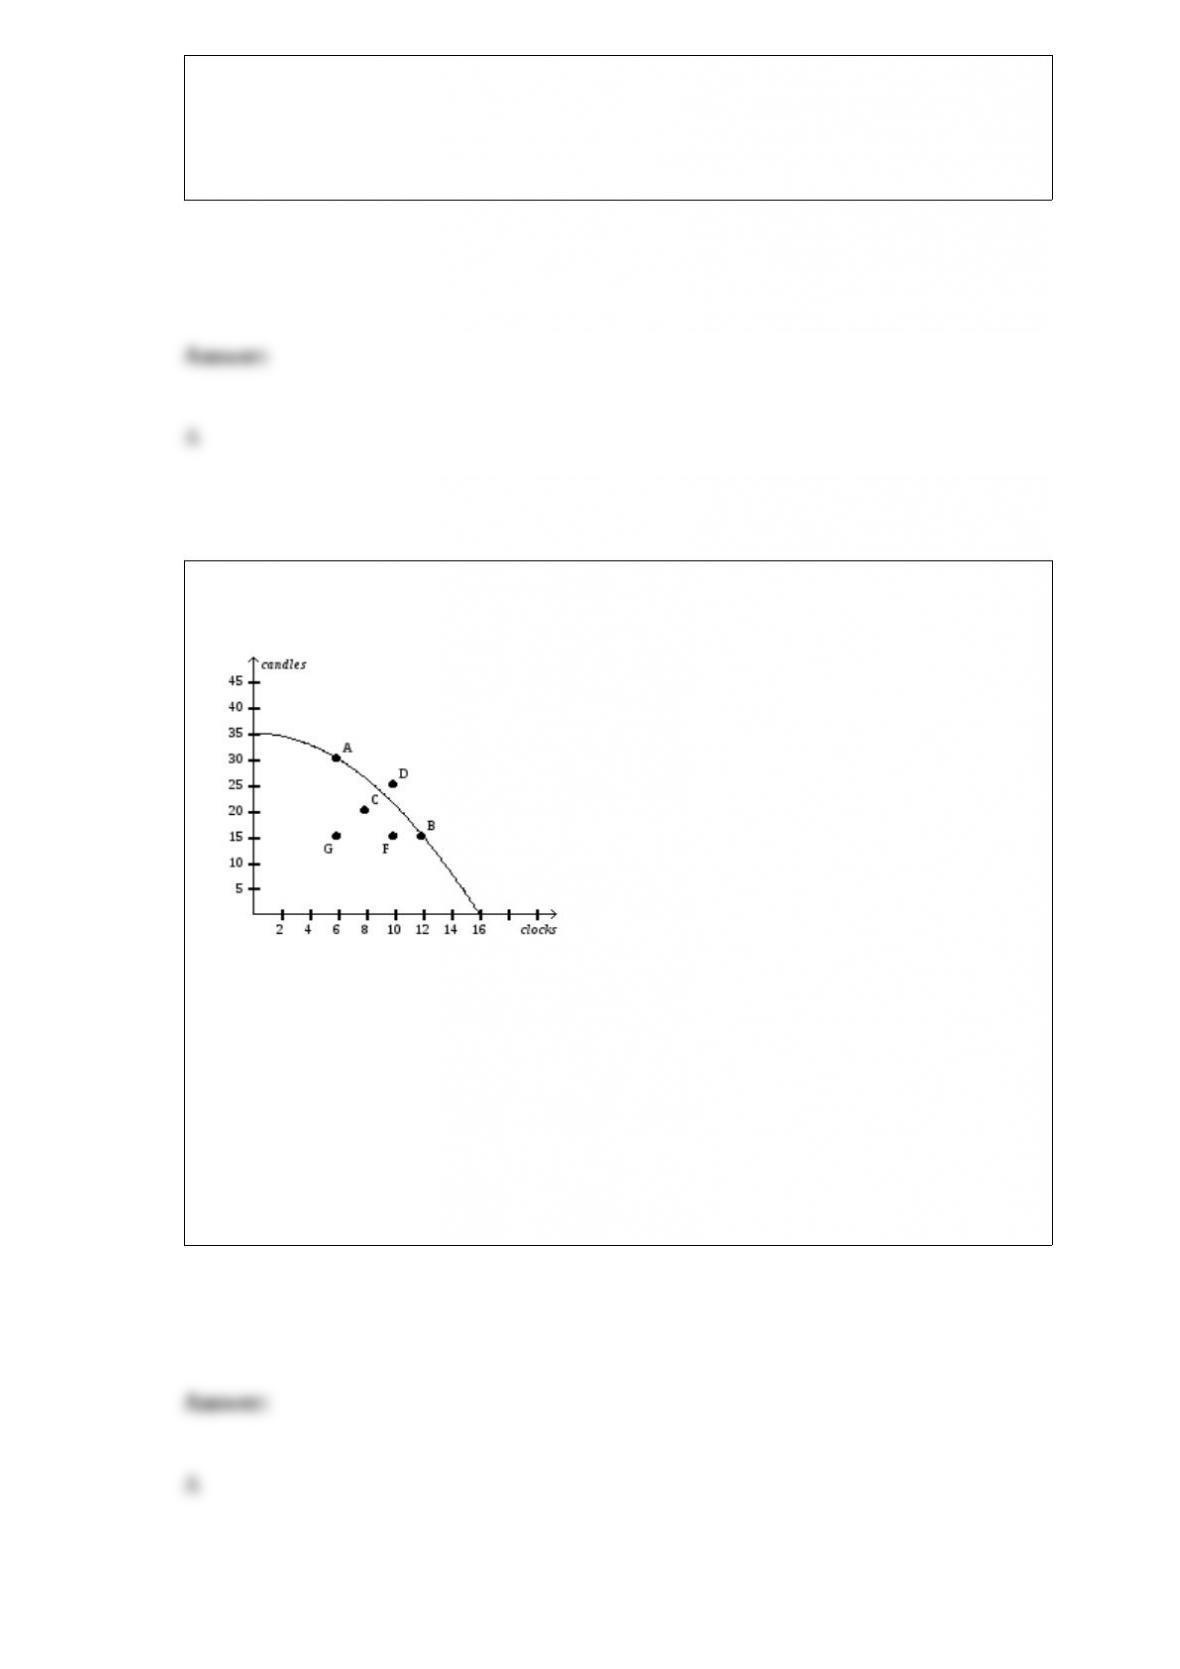
Figure 2-6
Refer to Figure 2-6. Efficient production is represented by which point(s)?
a. A, B
b. A, B, C, F, G
c. C, F, G
d. D
In the 1970s, in response to recessions caused by an increase in the price of oil, the
central banks in many countries increased their money supplies. The central banks
might have done this by
a. selling bonds on the open market, which would have raised the value of money.
b. purchasing bonds on the open market, which would have raised the value of money.
c. selling bonds on the open market, which would have raised the value of money.
d. purchasing bonds on the open market, which would have lowered the value of
money.
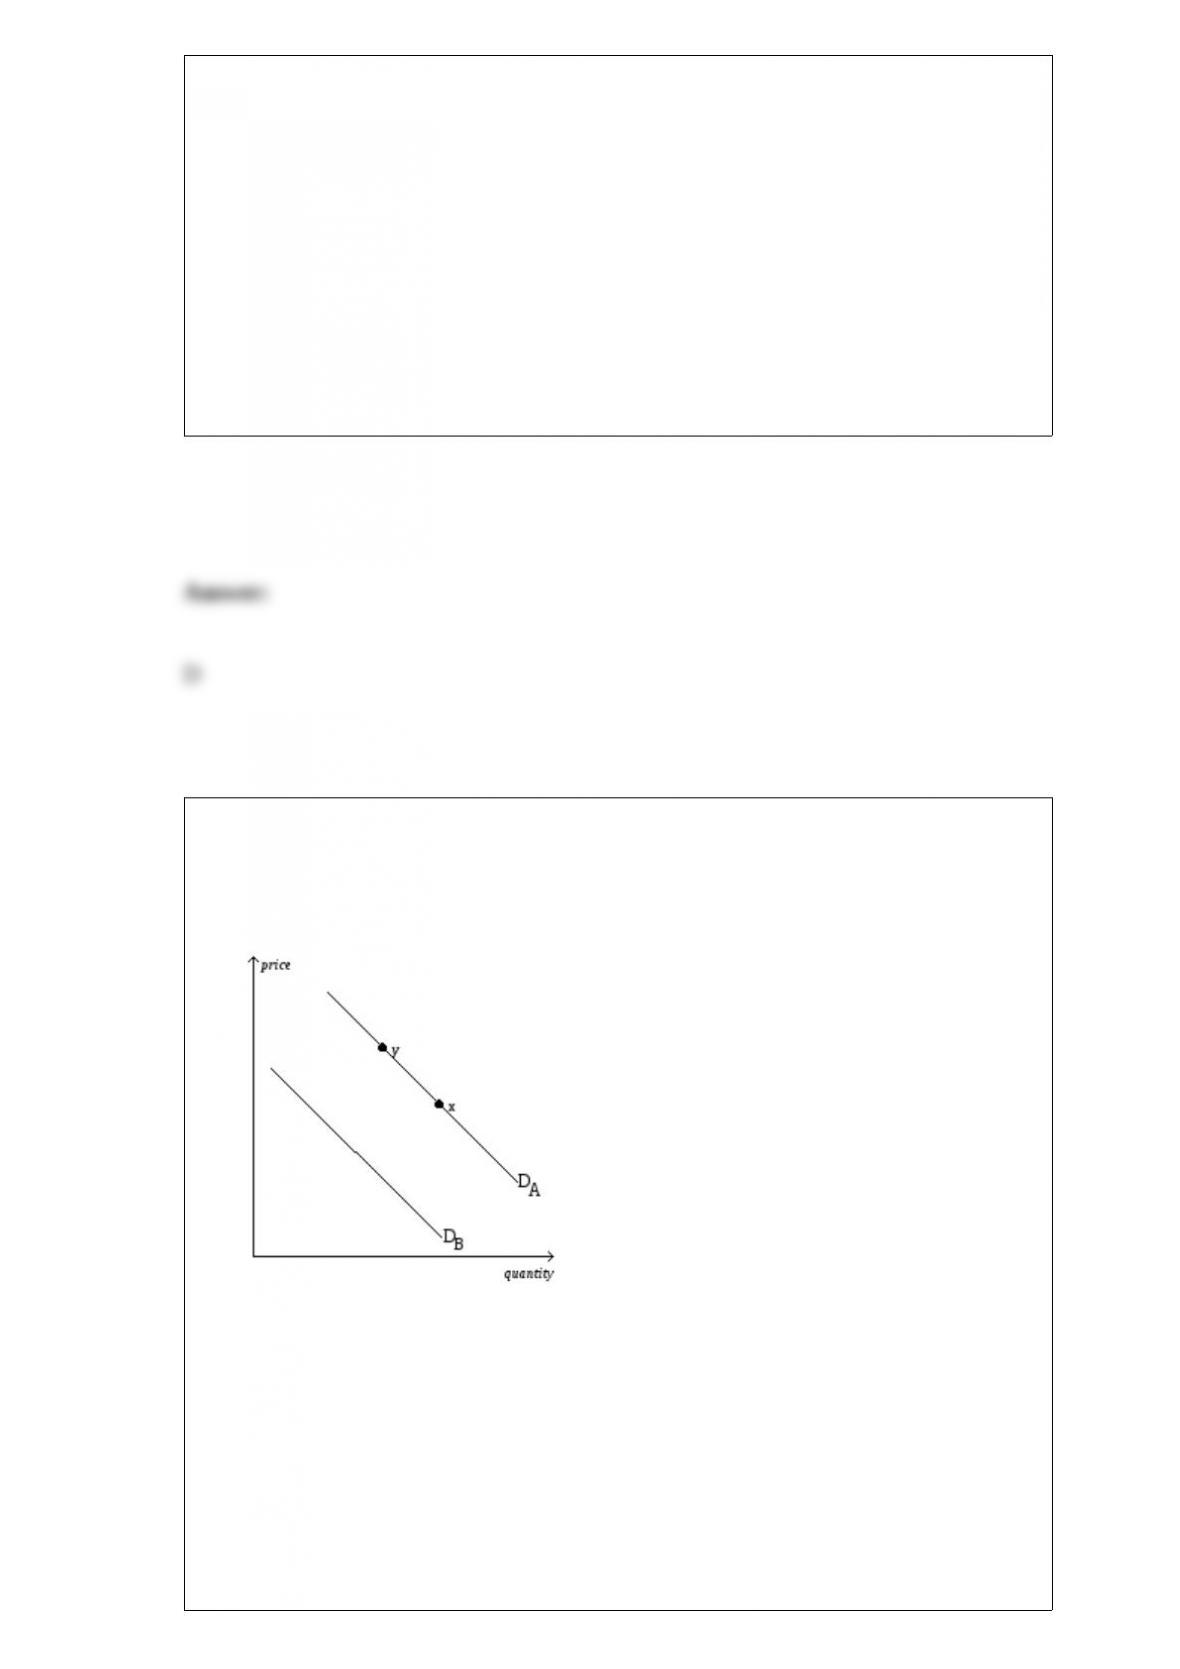
Figure 4-19
The diagram below pertains to the demand for turkey in the United States.
Refer to Figure 4-19. All else equal, an increase in the productivity of turkey farmers
would cause a move from
a. DA to DB.
b. DB to DA.
c. x to y.

d. y to x.
In building economic models, economists often omit
a. assumptions.
b. theories.
c. details.
d. equations.
The short-run effects on the interest rate are
a. shown equally well using either liquidity preference theory or classical theory.
b. best shown using classical theory.
c. best shown using liquidity preference theory.
d. not shown well by either liquidity preference theory or classical theory.

An increase in the price level and a reduction in output would result from
a. a fall in stock prices.
b. natural disasters such as hurricanes, floods, and droughts.
c. declining government expenditures.
d. tax rebates.
According to 2009 data on the U.S. population, which of the following groups of adults
(ages 20 and older) had the highest labor-force participation rate?
a. white males
b. white females
c. black males
d. black females

An assumption an economist might make while studying international trade is
a. there are only two countries.
b. countries only produce two goods.
c. technology does not change.
d. All of the above are possible assumptions.
Suppose the money market, drawn with the value of money on the vertical axis, is in
equilibrium. If the money supply increases, then at the old value of money there is an
a. excess demand for money that will result in an increase in spending.
b. excess demand for money that will result in a decrease in spending.
c. excess supply of money that will result in an increase in spending.
d. excess supply of money that will result in a decrease in spending.
Figure 22-4

Refer to figure 22-4. In this order, which curve is a long-run Phillips curve and which
is a short-run Phillips curve?
a. A, B
b. A, D
c. C, B
d. None of the above is correct.
Specialization and trade are closely linked to
a. absolute advantage.
b. comparative advantage.
c. gains to some traders that exactly offset losses to other traders.
d. shrinkage of the economic pie.

A market supply curve shows how the total quantity supplied of a good varies as
a. production technology varies.
b. price varies.
c. input prices vary.
d. demand varies.
Which of the following is an example of barter?
a. A parent gives a teenager a $10 bill in exchange for her babysitting services.
b. A homeowner gives an exterminator a check for $50 in exchange for extermination
services.
c. A barber gives a plumber a haircut in exchange for the plumber fixing the barber’s
leaky faucet.
d. All of the above are examples of barter.

The Fed can influence unemployment in
a. the short run and in the long run.
b. the short run, but not in the long run.
c. the long run, but not in the short run.
d. neither the short nor the long run.
When a binding price ceiling is imposed on a market to benefit buyers,
a. no buyers actually benefit.
b. some buyers benefit, but no buyers are harmed.
c. some buyers benefit, and some buyers are harmed.
d. all buyers benefit.
Figure 2-4
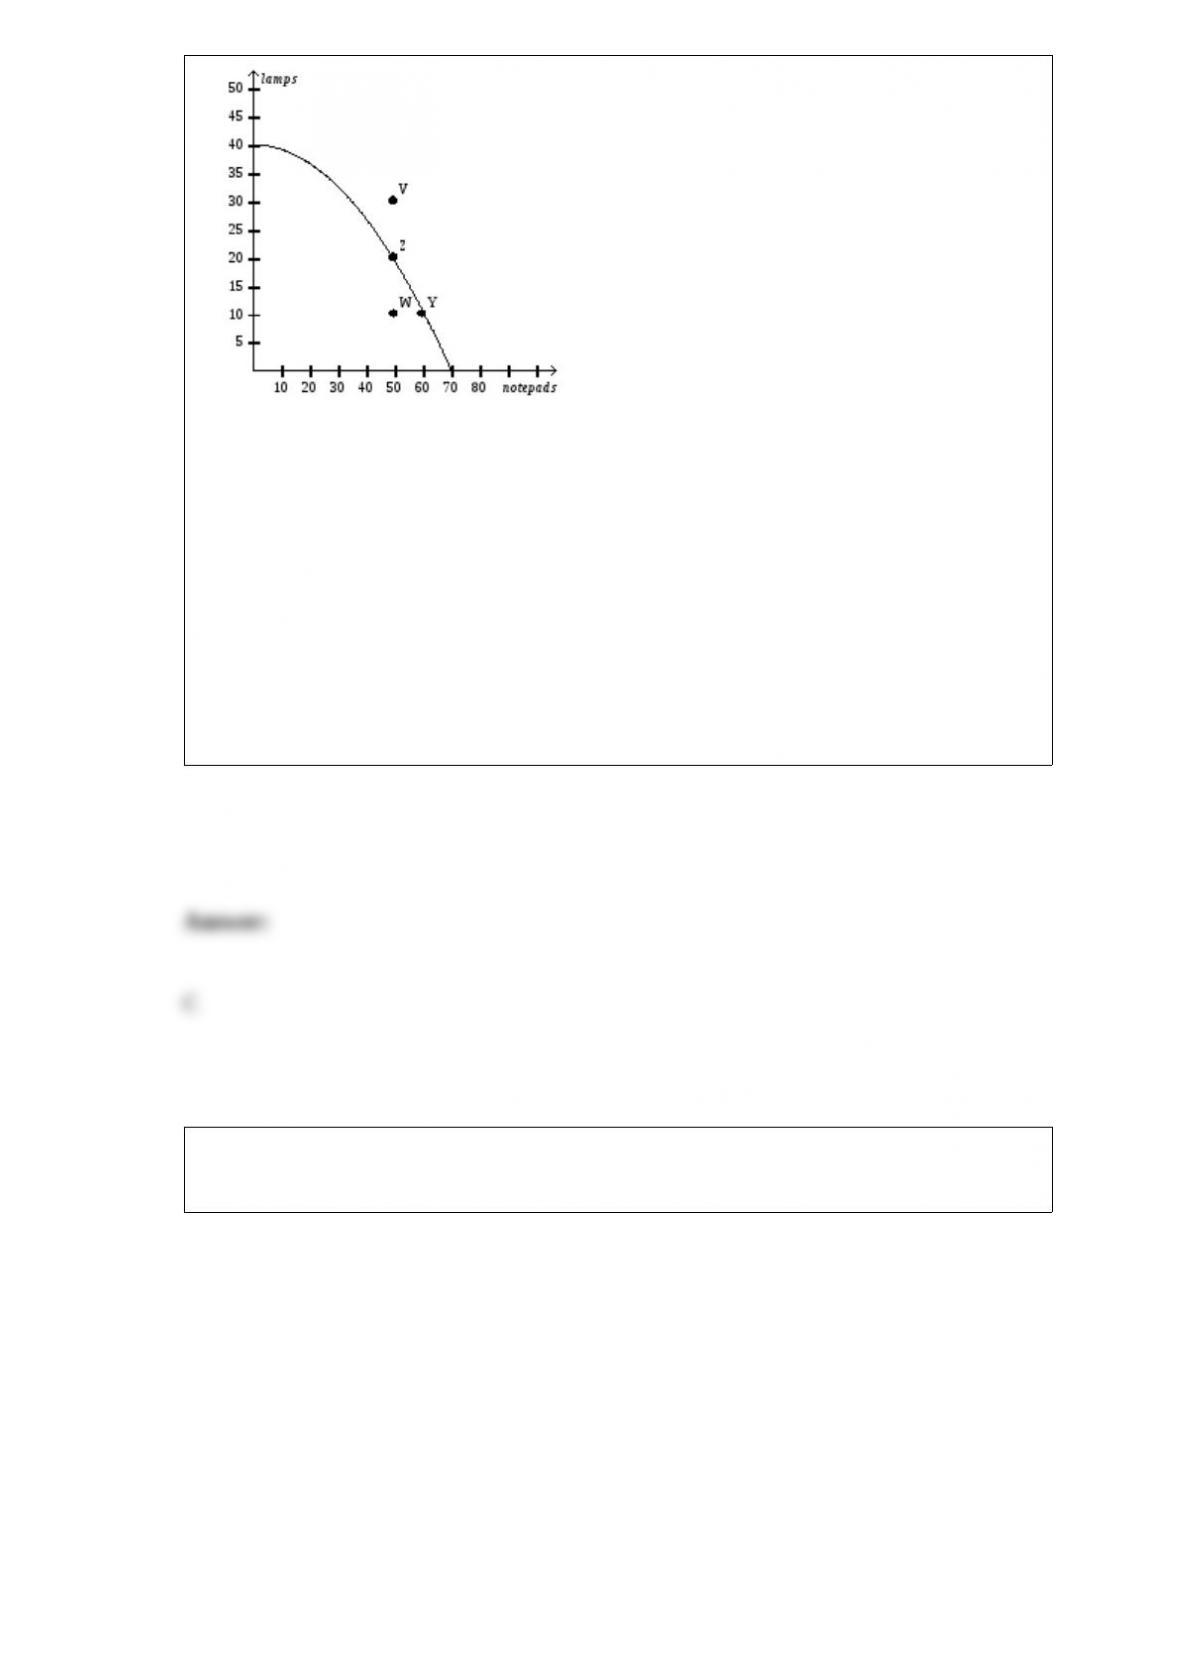
Refer to Figure 2-4. This economy cannot currently produce 30 notepads and 45 lamps
because
a. some of its resources are unemployed.
b. inefficiencies exist in this economy’s production process.
c. given its current technology, it does not have the resources to produce that level of
output.
d. All of the above are correct.
Figure 6-18

Refer to Figure 6-18. Buyers pay how much of the tax per unit?
a. $1.
b. $1.50.
c. $2.50.
d. $3.50.
The particular price that results in quantity supplied being equal to quantity demanded
is the best price because it
a. maximizes costs of the seller.
b. maximizes tax revenue for the government.
c. maximizes the combined welfare of buyers and sellers.
d. minimizes the expenditure of buyers.

In the U.S., each additional year of schooling has historically raised a person’s wage on
average by about
a. 5 percent. In less developed countries the gap between the wages of educated and
uneducated workers is smaller.
b. 10 percent. In less developed countries the gap between the wages of educated and
uneducated workers is smaller.
c. 5 percent. In less developed countries the gap between the wages of educated and
uneducated workers is larger.
d. 10 percent. In less developed countries the gap between the wages of educated and
uneducated workers is larger.
A decrease in the number of sellers in the market causes
a. the supply curve to shift to the left.
b. the supply curve to shift to the right.
c. a movement up and to the right along a stationary supply curve.
d. a movement downward and to the left along a stationary supply curve.

The labor force equals the
a. number of people employed.
b. number of people employed plus the number of people unemployed.
c. number of people employed plus the number of people unemployed plus teenagers
between ages 14 and 16 who work at least 10 hours a week.
d. adult population.
The CPI differs from the GDP deflator in that
a. the CPI is a price index, while the GDP deflator is an inflation index.
b. substitution bias is not a problem with the CPI, but it is a problem with the GDP
deflator.
c. increases in the prices of foreign produced goods that are sold to U.S. consumers
show up in the CPI but not in the GDP deflator.
d. increases in the prices of domestically produced goods that are sold to the U.S.
government show up in the CPI but not in the GDP deflator.

An increase in demand is represented by a
a. movement downward and to the right along a demand curve.
b. movement upward and to the left along a demand curve.
c. rightward shift of a demand curve.
d. leftward shift of a demand curve.
In recent years, the Federal Reserve has conducted policy by setting a target for the
a. size of the money supply.
b. growth rate of the money supply.
c. federal funds rate.
d. discount rate.
If money demand shifted to the right and the Federal Reserve desired to return the
interest rate to its original value, it could
a. buy bonds to increase the money supply.

b. buy bonds to decrease the money supply.
c. sell bonds to increase the money supply.
d. sell bonds to decrease the money supply.
If people anticipate higher inflation, but inflation remains the same then
a. the short-run Phillips curve would shift right and unemployment would rise.
b. the short-run Phillips curve would shift right and unemployment would fall.
c. the short-run Phillips curve would shift left and unemployment would rise.
d. the short-run Phillips curve would shift left and unemployment would fall.
Of the following groups, who is eligible for unemployment insurance benefits?
a. the unemployed who quit their jobs
b. the unemployed who were laid off because their previous employers no longer
needed their skills
c. the unemployed who were fired for cause
d. the unemployed who just entered the labor force
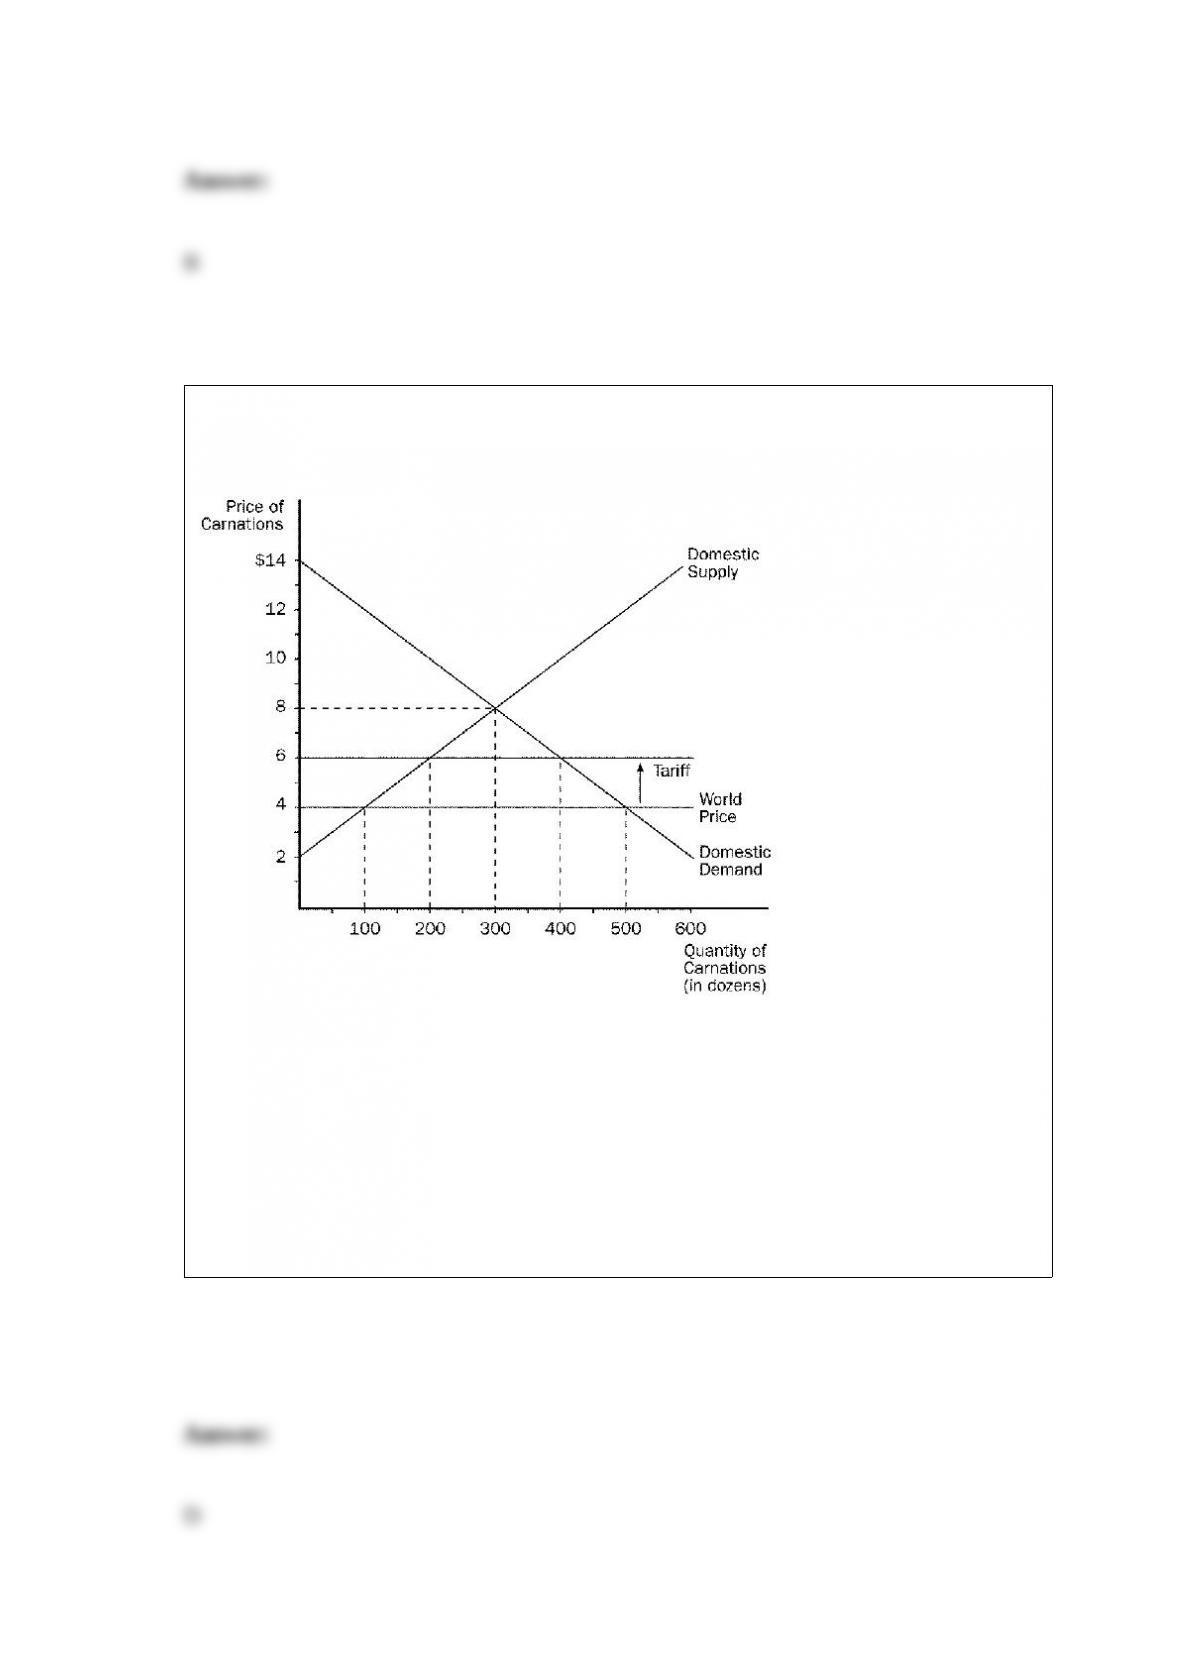
Figure 9-6
Refer to Figure 9-6. The size of the tariff on carnations is
a. $8 per dozen.
b. $6 per dozen.
c. $4 per dozen.
d. $2 per dozen.

The difference between a supply schedule and a supply curve is that a supply schedule
a. incorporates demand and a supply curve does not.
b. incorporates profit and a supply curve does not.
c. can shift, but a supply curve cannot shift.
d. is a table, and a supply curve is drawn on a graph.
The open-economy macroeconomic model examines the determination of
a. the output growth rate and the real interest rate.
b. unemployment and the exchange rate.
c. the output growth rate and the inflation rate.
d. the trade balance and the exchange rate.