Table 337
Output of pottery in one sixhour session
VasesMugs
Sarah 8 32
Charles 10 25
Refer to Table 337. Sarah and Charles are both potters and each can switch between
the production of vases and mugs at a constant rate. The table shows the total number of
vases or decorative mugs that each person can produce in a sixhour session of
producing pottery. Sarah’s opportunity cost to produce one vase is
a. 0.25 mugs and Charles’s opportunity cost of producing one vase is 2.5 mugs
b. 4 mugs and Charles’s opportunity cost of producing one vase is 2.5 mugs
c. 0.25 mugs and Charles’s opportunity cost of producing one vase is 0.40 mugs
d. 4 mugs and Charles’s opportunity cost of producing one vase is 0.40 mugs
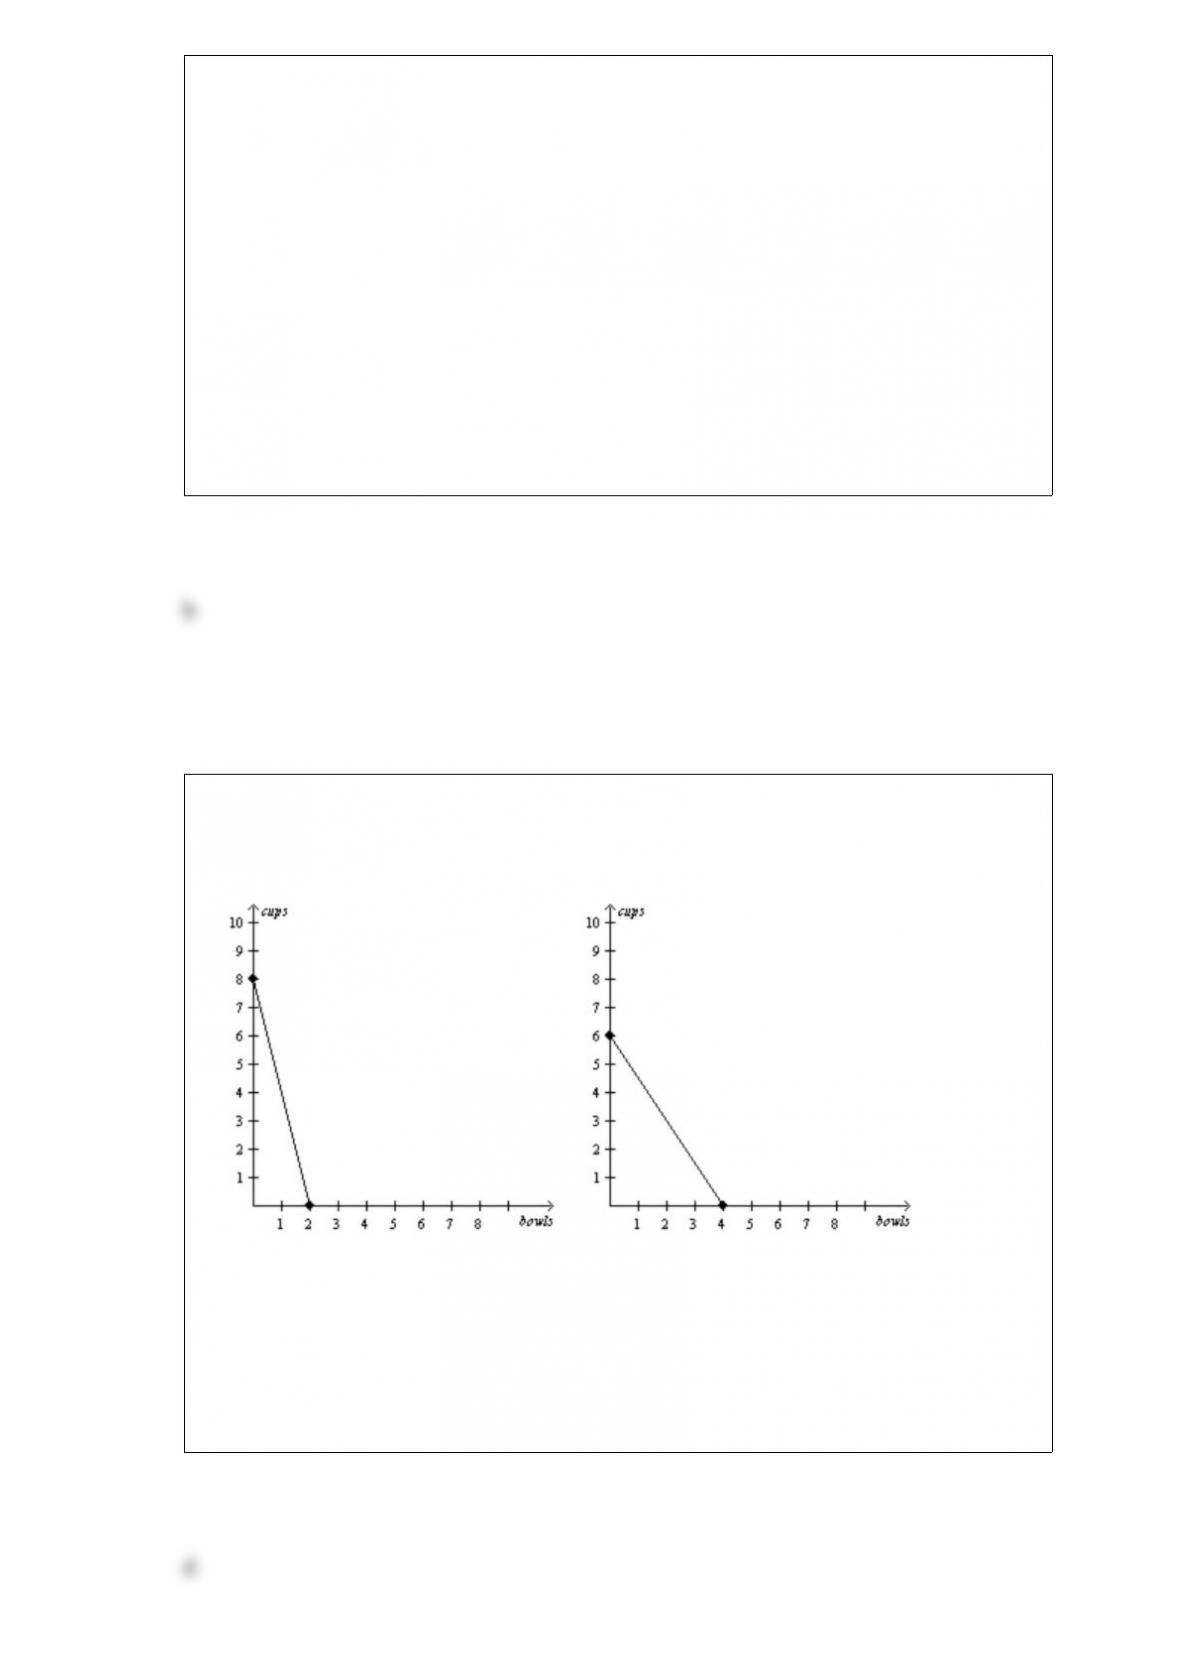
Figure 37
Bintu’s Production Possibilities FrontierJuba’s Production Possibilities Frontier
Refer to Figure 37. If Bintu and Juba both spend all of their time making bowls, then
total production is
a. 2 bowls.
b. 3 bowls.
c. 4 bowls.
d. 6 bowls.
The supply curve for stand up paddle boards
a. shifts when the price of stand up paddle boards changes because the price of stand up
paddle boards is measured on the vertical axis of the graph.
b. shifts when the price of stand up paddle boards changes because the quantity
supplied of stand up paddle boards is measured on the horizontal axis of the graph.
c. does not shift when the price of stand up paddle boards changes because the price of
stand up paddle boards is measured on the vertical axis of the graph.
d. does not shift when the price of stand up paddle boards changes because the price of
stand up paddle boards is measured on the horizontal axis of the graph.
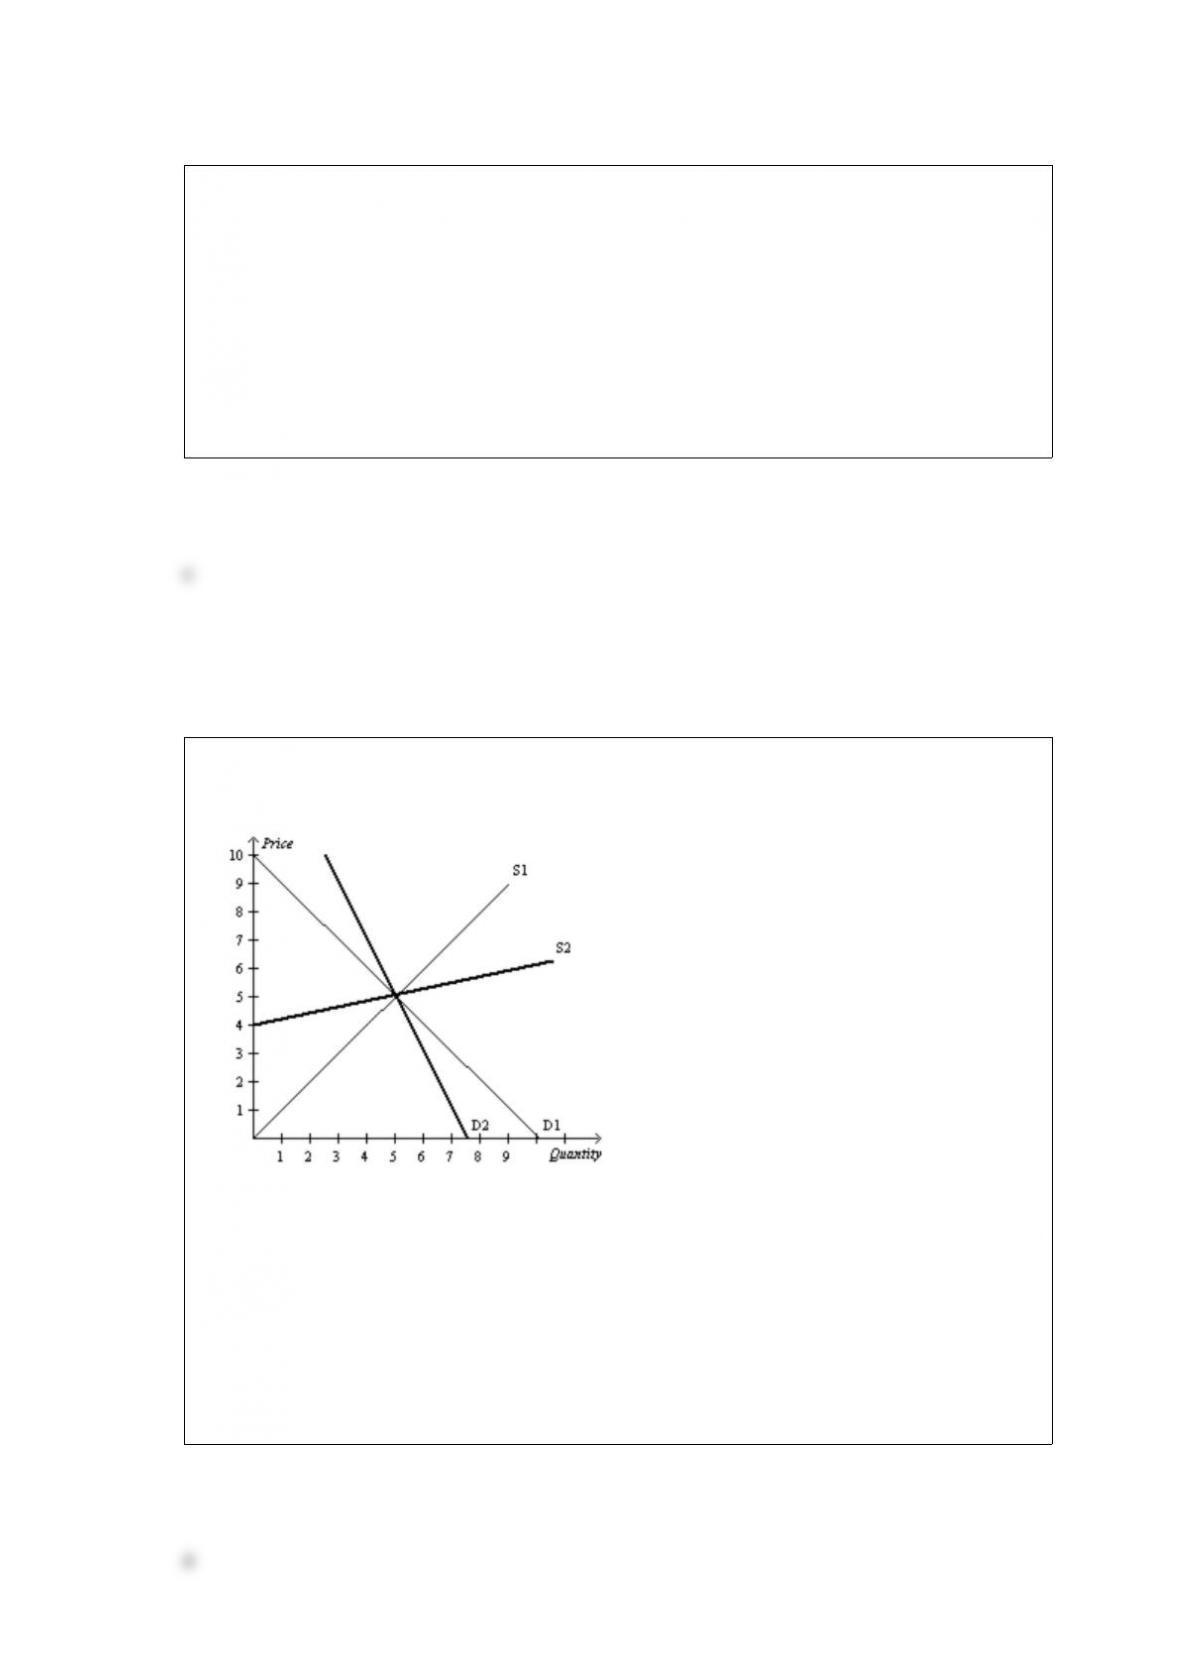
Figure 629
Suppose the government imposes a $2 on this market.
Refer to Figure 629. Suppose D1 represents the demand curve for gasoline in both the
short run and long run, S1 represents the supply curve for gasoline in the short run, and
S2 represents the supply curve for gasoline in the long run. After the imposition of the
$2, the price paid by buyers will be
a. higher in the long run than in the short run.
b. higher in the short run than in the long run.
c. equivalent in the short run and the long run.
d. unable to be determined without additional information.
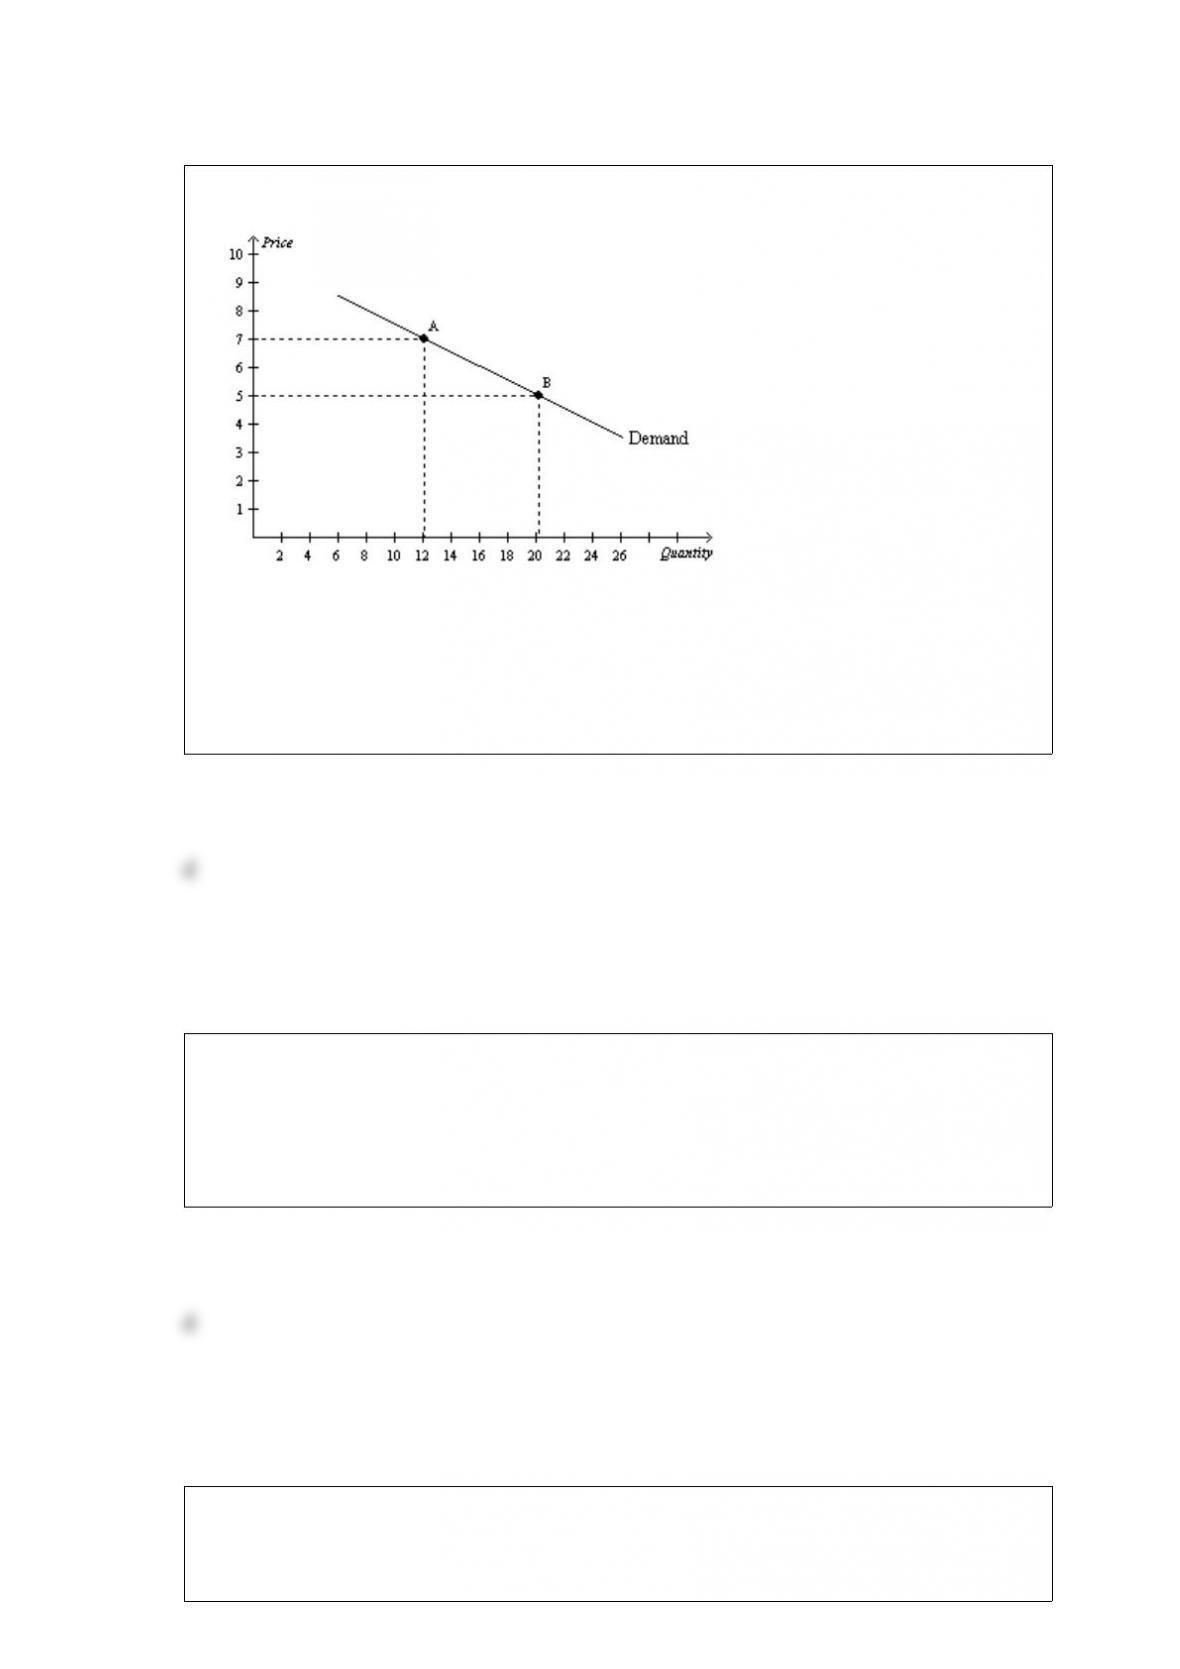
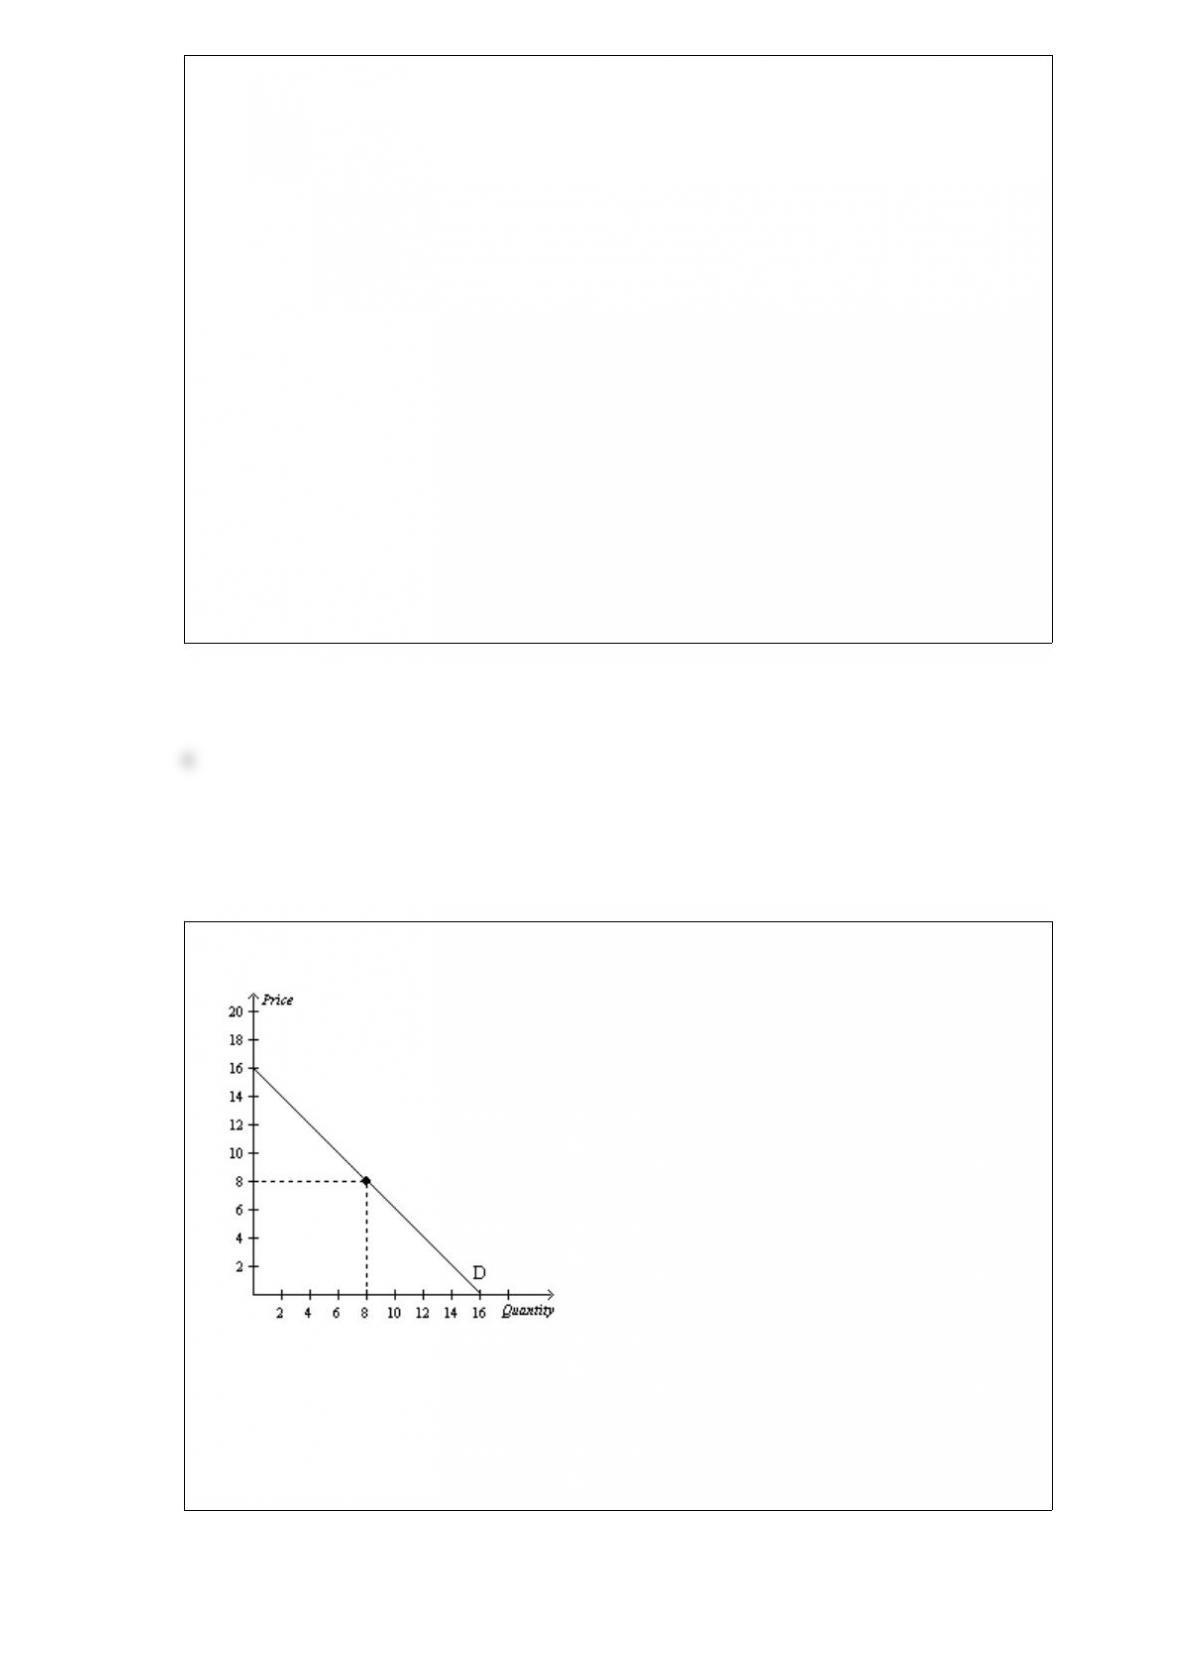
Figure 51
Refer to Figure 51. Between point A and point B on the graph, demand is
a. perfectly elastic.
b. inelastic.
c. unit elastic.
d. elastic, but not perfectly elastic.
The quantity supplied of a good is the amount that
a. buyers are willing and able to purchase.
b. sellers are able to produce.
c. buyers and sellers agree will be brought to market.
d. sellers are willing and able to sell.
Other things equal, the deadweight loss of a tax
a. decreases as the size of the tax increases.
b. increases as the size of the tax increases, but the increase in the deadweight loss is
less rapid than the increase in the size of the tax.
c. increases as the size of the tax increases, and the increase in the deadweight loss is
more rapid than the increase in the size of the tax.
d. increases as the price elasticities of demand and/or supply increase, but the
deadweight loss does not change as the size of the tax increases.
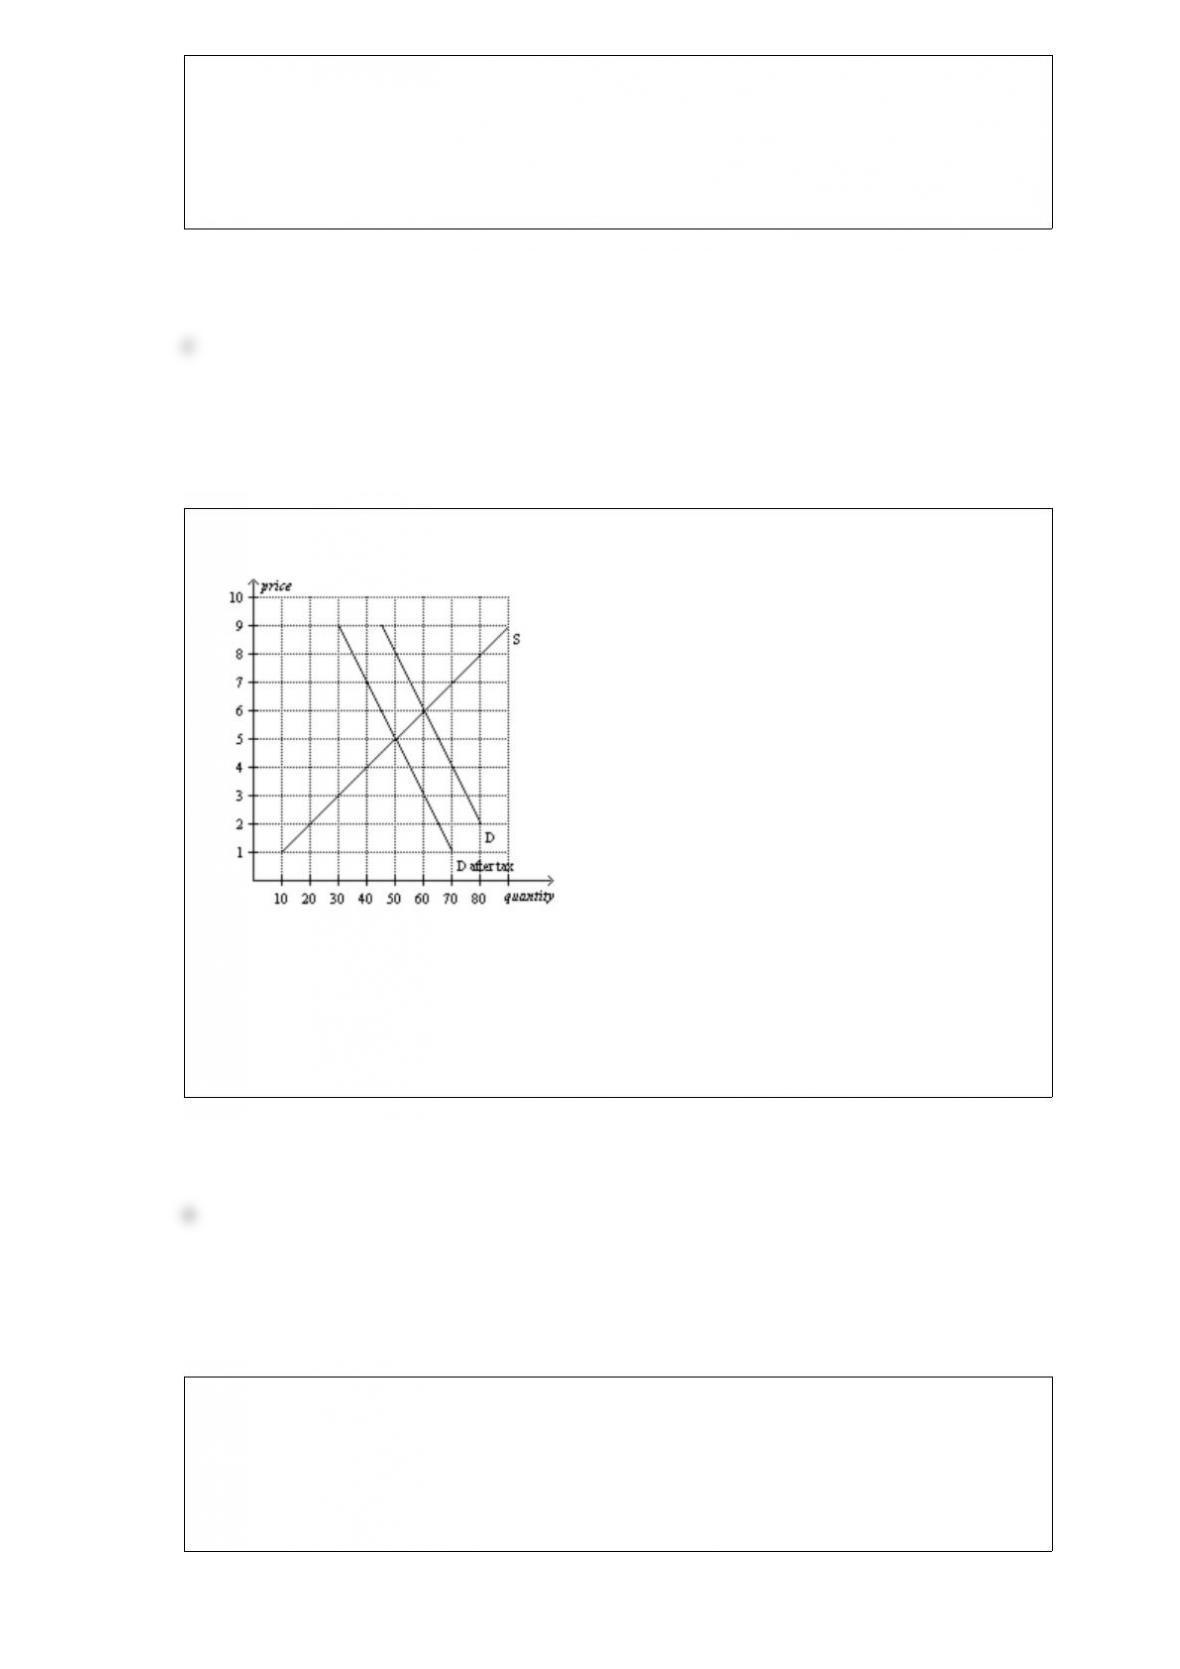
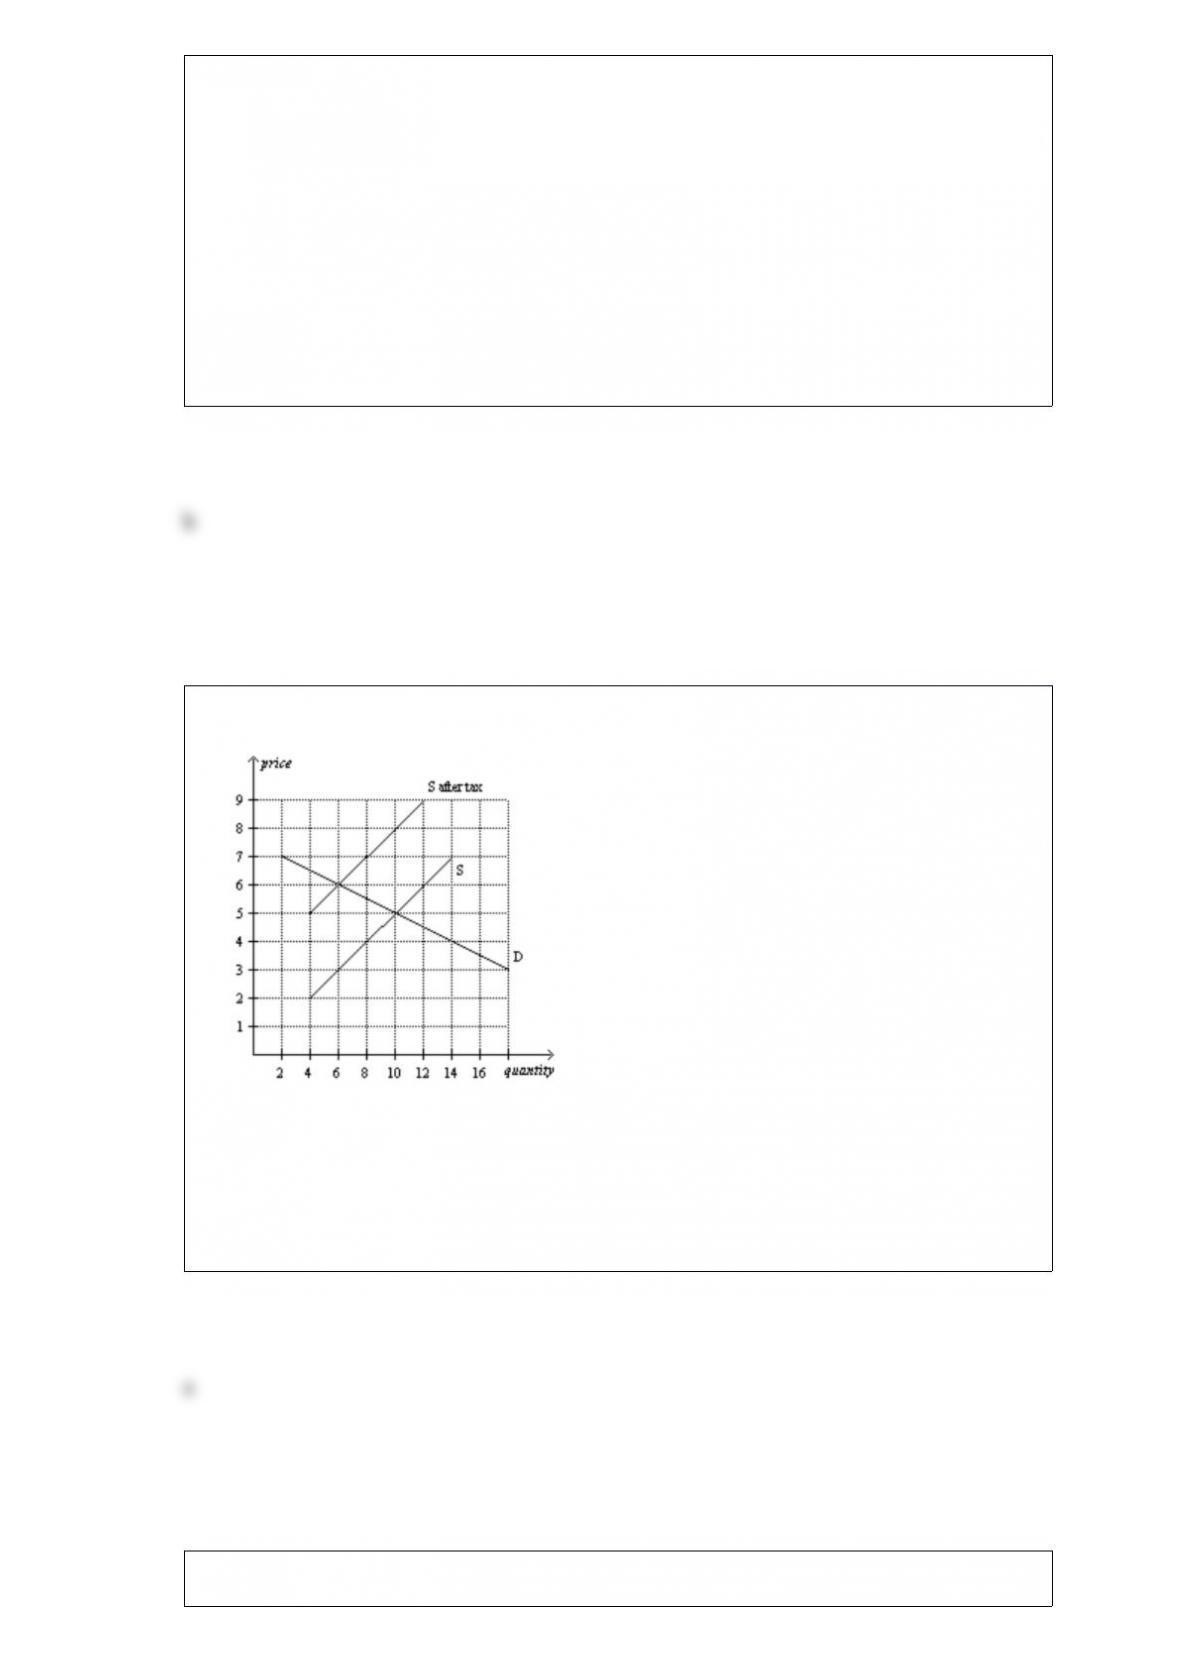
Figure 625
Refer to Figure 625. The effective price that sellers receive after the tax is imposed is
a. $5.
b. $6.
c. $7.
d. $8.
Which of the following events must cause equilibrium quantity to fall?
a. demand increases and supply decreases
b. demand and supply both decrease
c. demand decreases and supply increases
d. demand and supply both increase
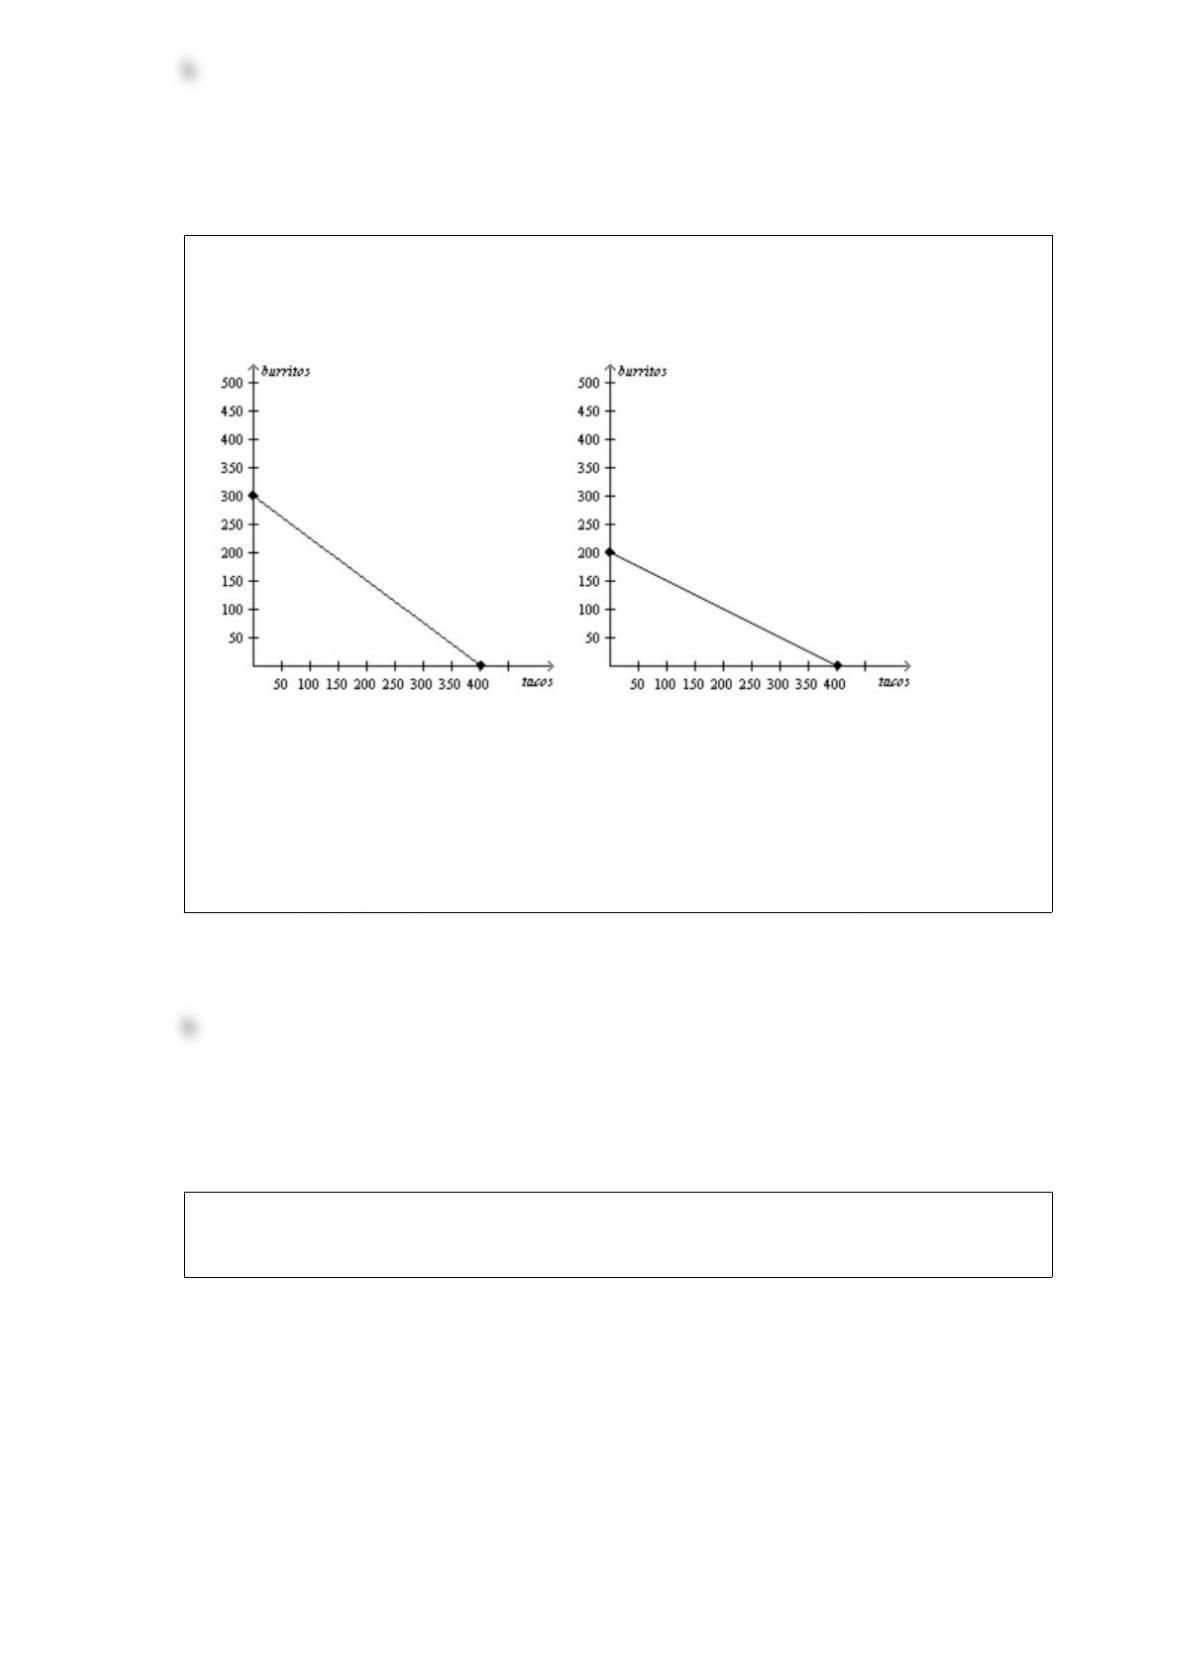
Figure 33
Arturo’s Production Possibilities FrontierDina’s Production Possibilities Frontier
Refer to Figure 33. If Arturo and Dina each divides his/her time equally between the
production of tacos and burritos, then total production is
a. 200 tacos and 150 burritos.
b. 400 tacos and 250 burritos.
c. 400 tacos and 300 burritos.
d. 800 tacos and 500 burritos.
Figure 85
Suppose that the government imposes a tax of P3 P1.
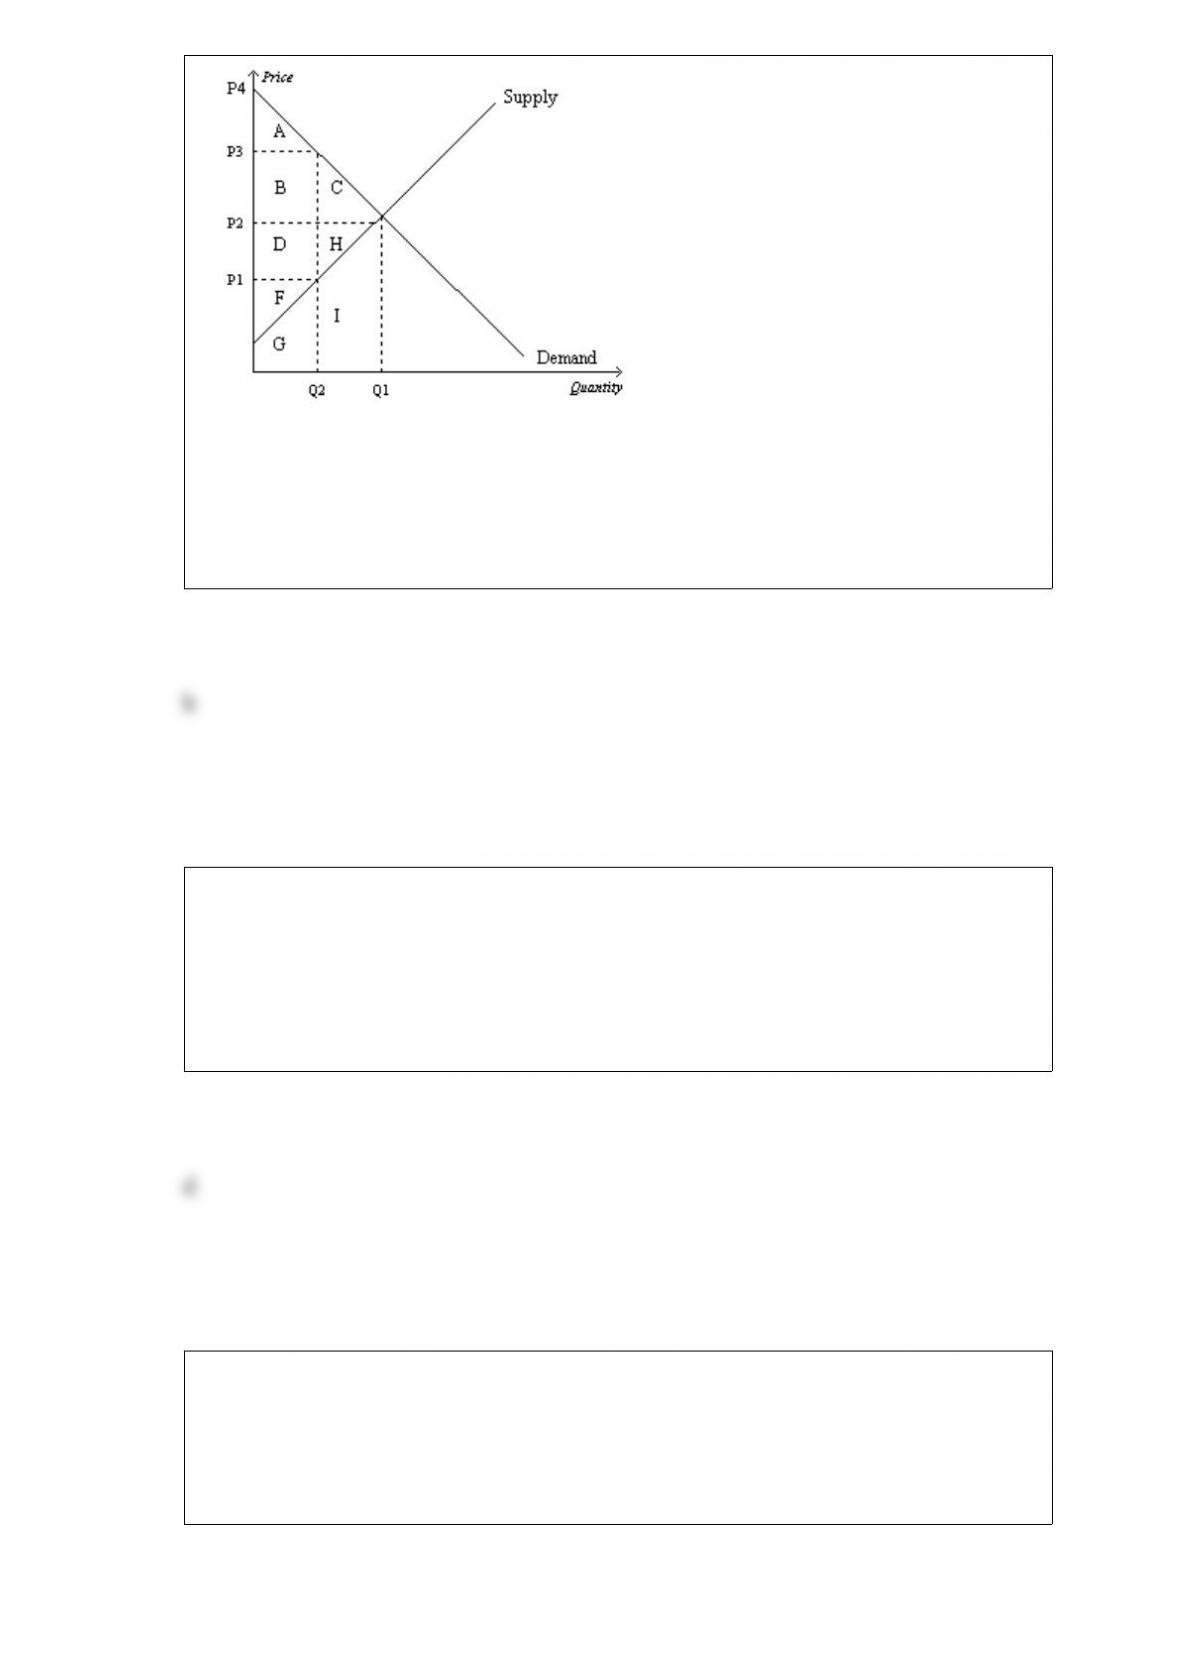
Refer to Figure 85. The equilibrium price before the tax is imposed is
a. P1.
b. P2.
c. P3.
d. P4.
There are several criticisms of the minimum wage. Which of the following is not one of
those criticisms? The minimum wage
a. often hurts those people who it is intended to help.
b. results in an excess supply of lowskilled labor.
c. prevents some unskilled workers from getting needed onthejob training.
d. fails to raise the wage of any employed person.
Today’s supply curve for gasoline could shift in response to a change in
a. today’s price of gasoline.
b. the expected future price of gasoline.
c. the number of buyers of gasoline.
d. All of the above are correct.
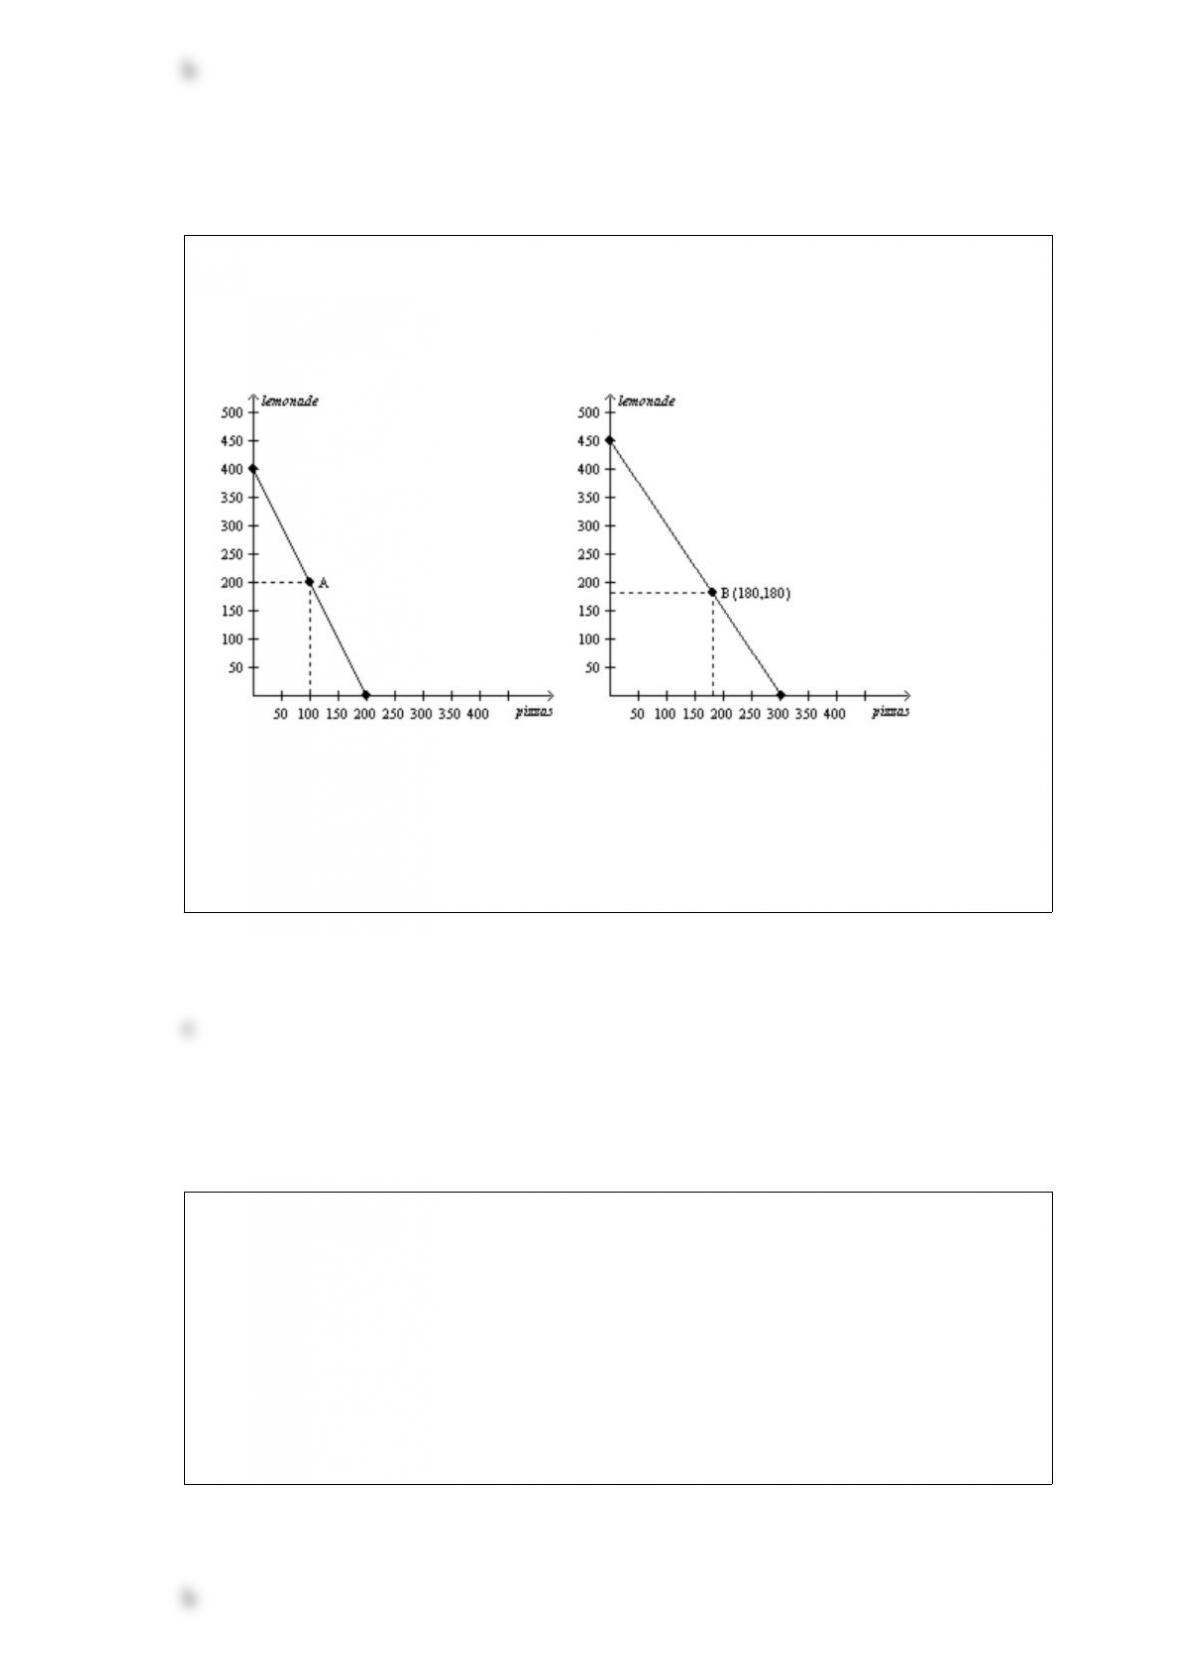
Figure 310
Alice and Betty’s Production Possibilities in one 8hour day.
Alice’s Production Possibilities FrontierBetty’s Production Possibilities Frontier
Refer to Figure 310. If Alice produces only lemonade, she can produce
a. 200 pitchers per day.
b. 300 pitchers per day.
c. 400 pitchers per day.
d. 450 pitchers per day.
In the circularflow diagram,
a. taxes flow from households to firms, and transfer payments flow from firms to
households.
b. income payments flow from firms to households, and sales revenue flows from
households to firms.
c. resources flow from firms to households, and goods and services flow from
households to firms.
d. inputs and outputs flow in the same direction as the flow of dollars, from firms to
households.
A CPA recently has come to expect higher prices for expert tax advice in the near
future. We would expect
a. the CPA to supply more expert tax advice now than she was supplying previously.
b. the CPA to supply less expert tax advice now than she was supplying previously.
c. the demand for this CPA’s expert tax advice to fall.
d. no change in the CPA’s current supply; instead, future supply will be affected.
The line that relates the price of a good and the quantity supplied of that good is called
the supply
a. schedule, and it usually slopes upward.
b. schedule, and it usually slopes downward.
c. curve, and it usually slopes upward.
d. curve, and it usually slopes downward.
Figure 59
Refer to Figure 59. If the price falls from point A to point B, total revenue
a. increases, and demand is price elastic.

b. decreases, and demand is price elastic.
c. increases, and demand is price inelastic.
d. decreases, and demand is price inelastic.
A legal maximum on the price at which a good can be sold is called a price
a. floor.
b. subsidy.
c. support.
d. ceiling.
In addition to advising the president, one duty of the Council of Economic Advisers is
to
a. prepare the federal budget.
b. write government regulations.
c. advise Congress on economic matters.
d. write the annual Economic Report of the President.
Table 47
PriceDairy
Barn’s
Gallons
SuppliedDolly’s Dairy’s
Gallons
SuppliedFour Queen’s
Gallons
SuppliedMoo
Roo’s
Gallons
Supplied
$00000
$23421
$46842
$691263
$8121684
$101520105
Refer to Table 47. If these are the only four sellers in the market for ice cream, then the
market quantity supplied at a price of $4 is
a. 4 gallons.
b. 5 gallons.
c. 20 gallons.
d. 80 gallons.
Figure 56
Refer to Figure 56. For prices below $8, demand is price
a. elastic, and total revenue will rise as price rises.
b. inelastic, and total revenue will rise as price rises.
c. elastic, and total revenue will fall as price rises.
d. inelastic, and total revenue will fall as price rises.

If mayonnaise and Miracle Whip are substitutes, then which of the following would
increase the demand for Miracle Whip?
a. a decrease in the price of Miracle Whip
b. an increase in the price of mayonnaise
c. a decrease in the price of mayonnaise
d. Both a and b are correct.
Assume, for Mexico, that the domestic price of oranges without international trade is
lower than the world price of oranges. This suggests that, in the production of oranges,
a. Mexico has a comparative advantage over other countries and Mexico will export
oranges.
b. Mexico has a comparative advantage over other countries and Mexico will import
oranges.
c. other countries have a comparative advantage over Mexico and Mexico will export
oranges.
d. other countries have a comparative advantage over Mexico and Mexico will import
oranges.
Instead of conducting laboratory experiments to generate data to test their theories,
economists often
a. ask winners of the Nobel Prize in Economics to evaluate their theories.
b. argue that data is impossible to collect in economics.
c. gather data from historical episodes of economic change.
d. assume that data would support their theories.
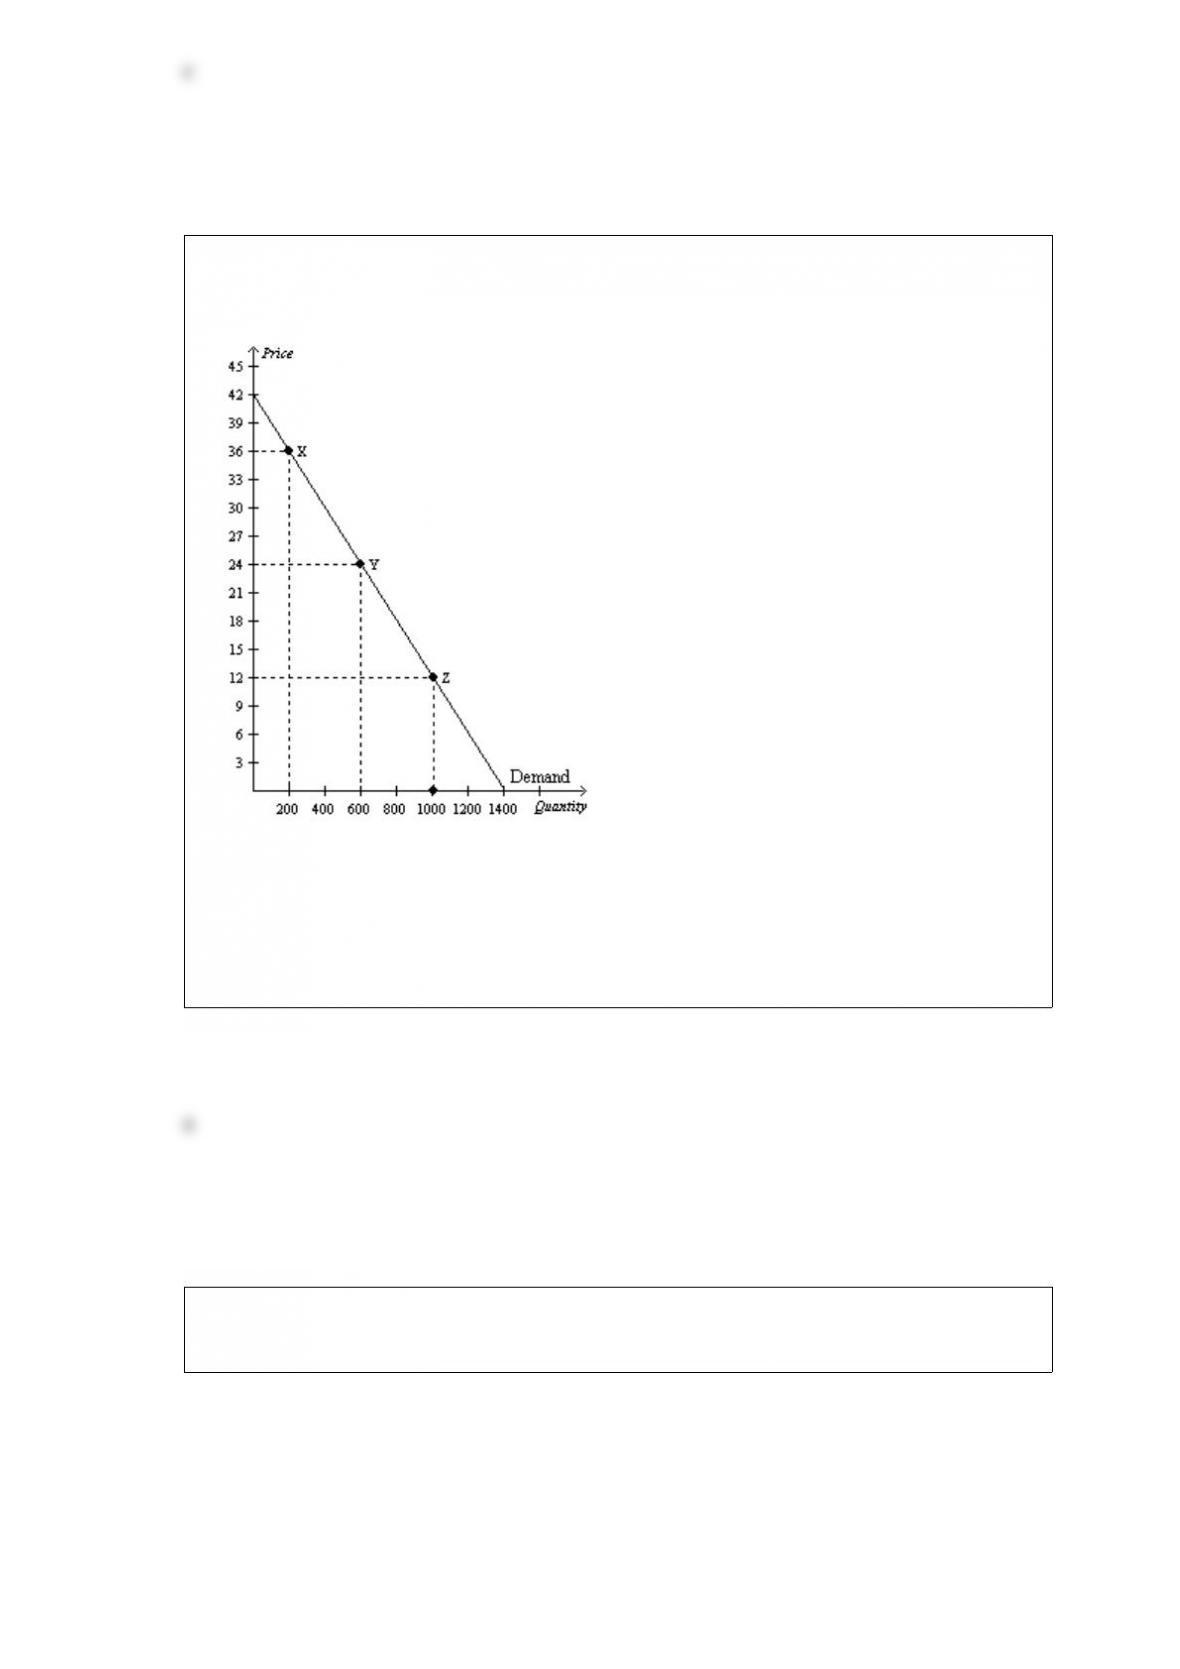
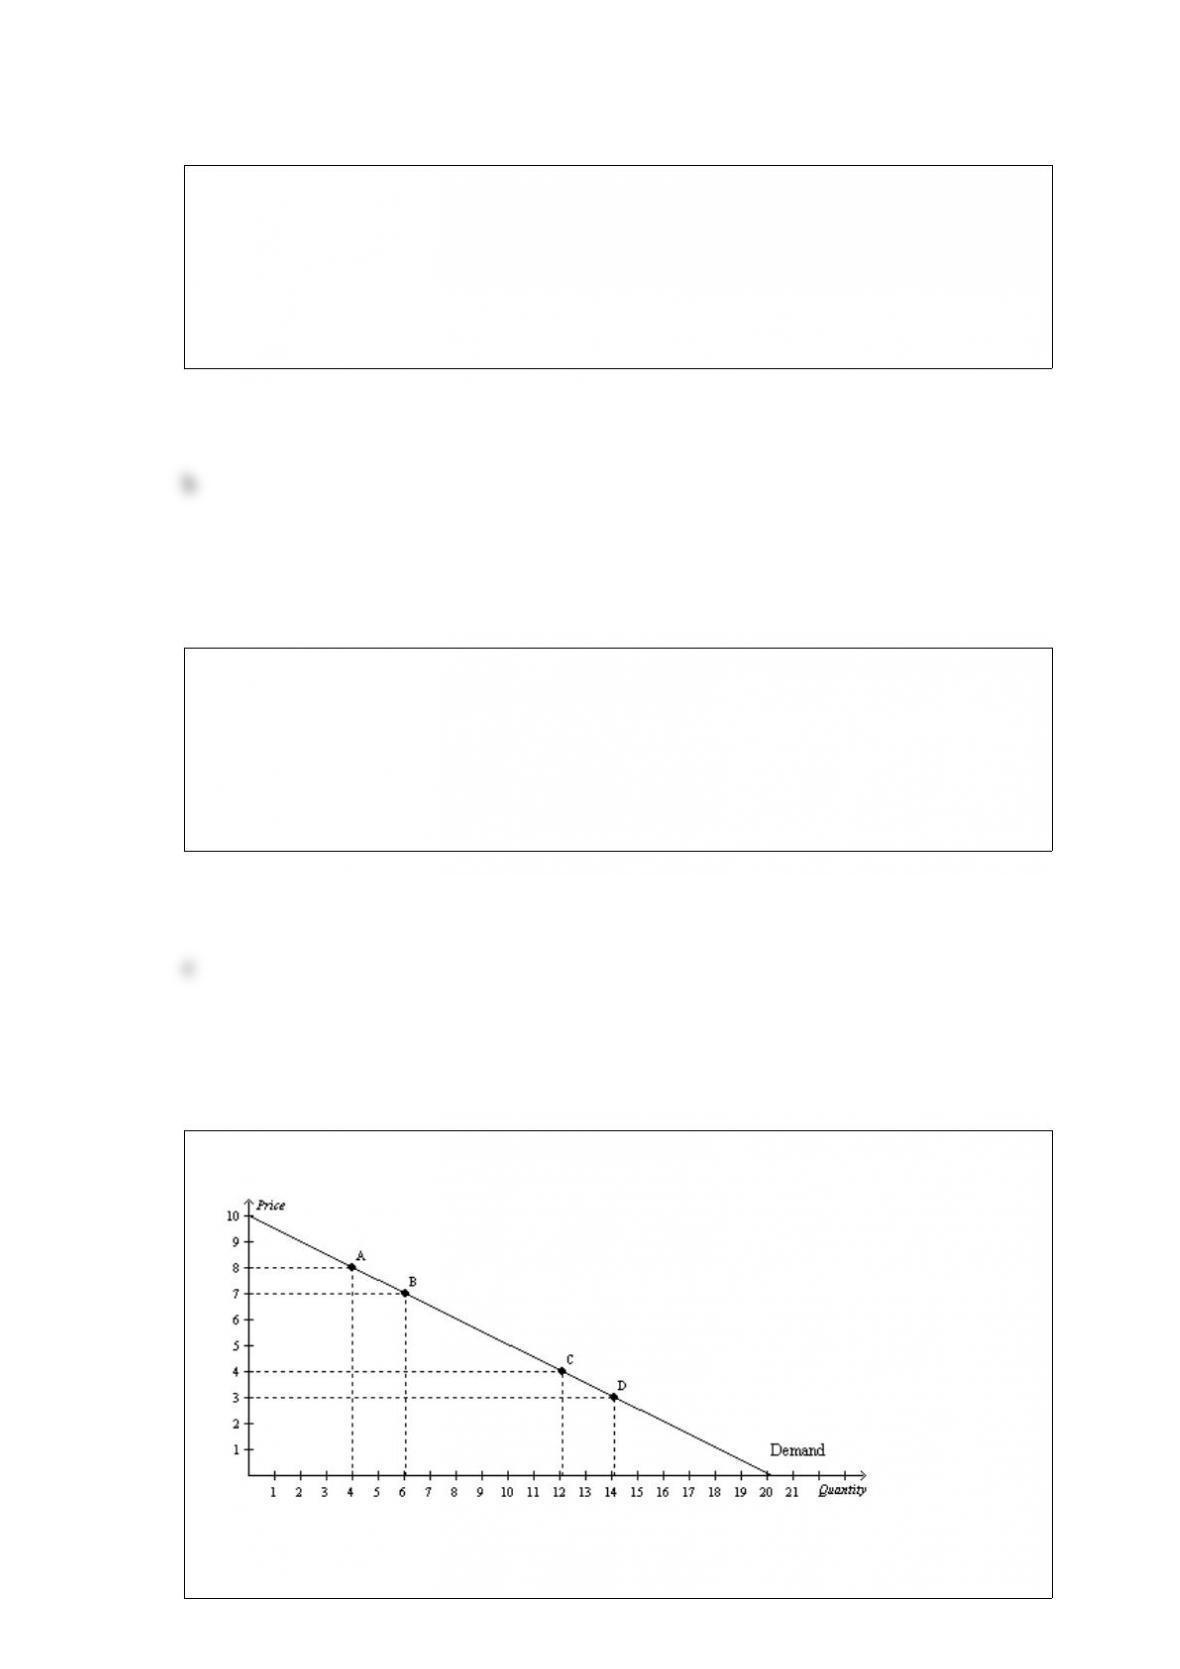
Figure 512
Refer to Figure 512. If the price decreased from $36 to $12, total revenue would
a. increase by $4,800, and demand is elastic between points X and Z.
b. increase by $7,200, and demand is elastic between points X and Z.
c. decrease by $4,800, and demand is inelastic between points X and Z.
d. decrease by $7,200, and demand is inelastic between points X and Z.
Figure 914. On the diagram below, Q represents the quantity of crude oil and P
represents the price of crude oil.
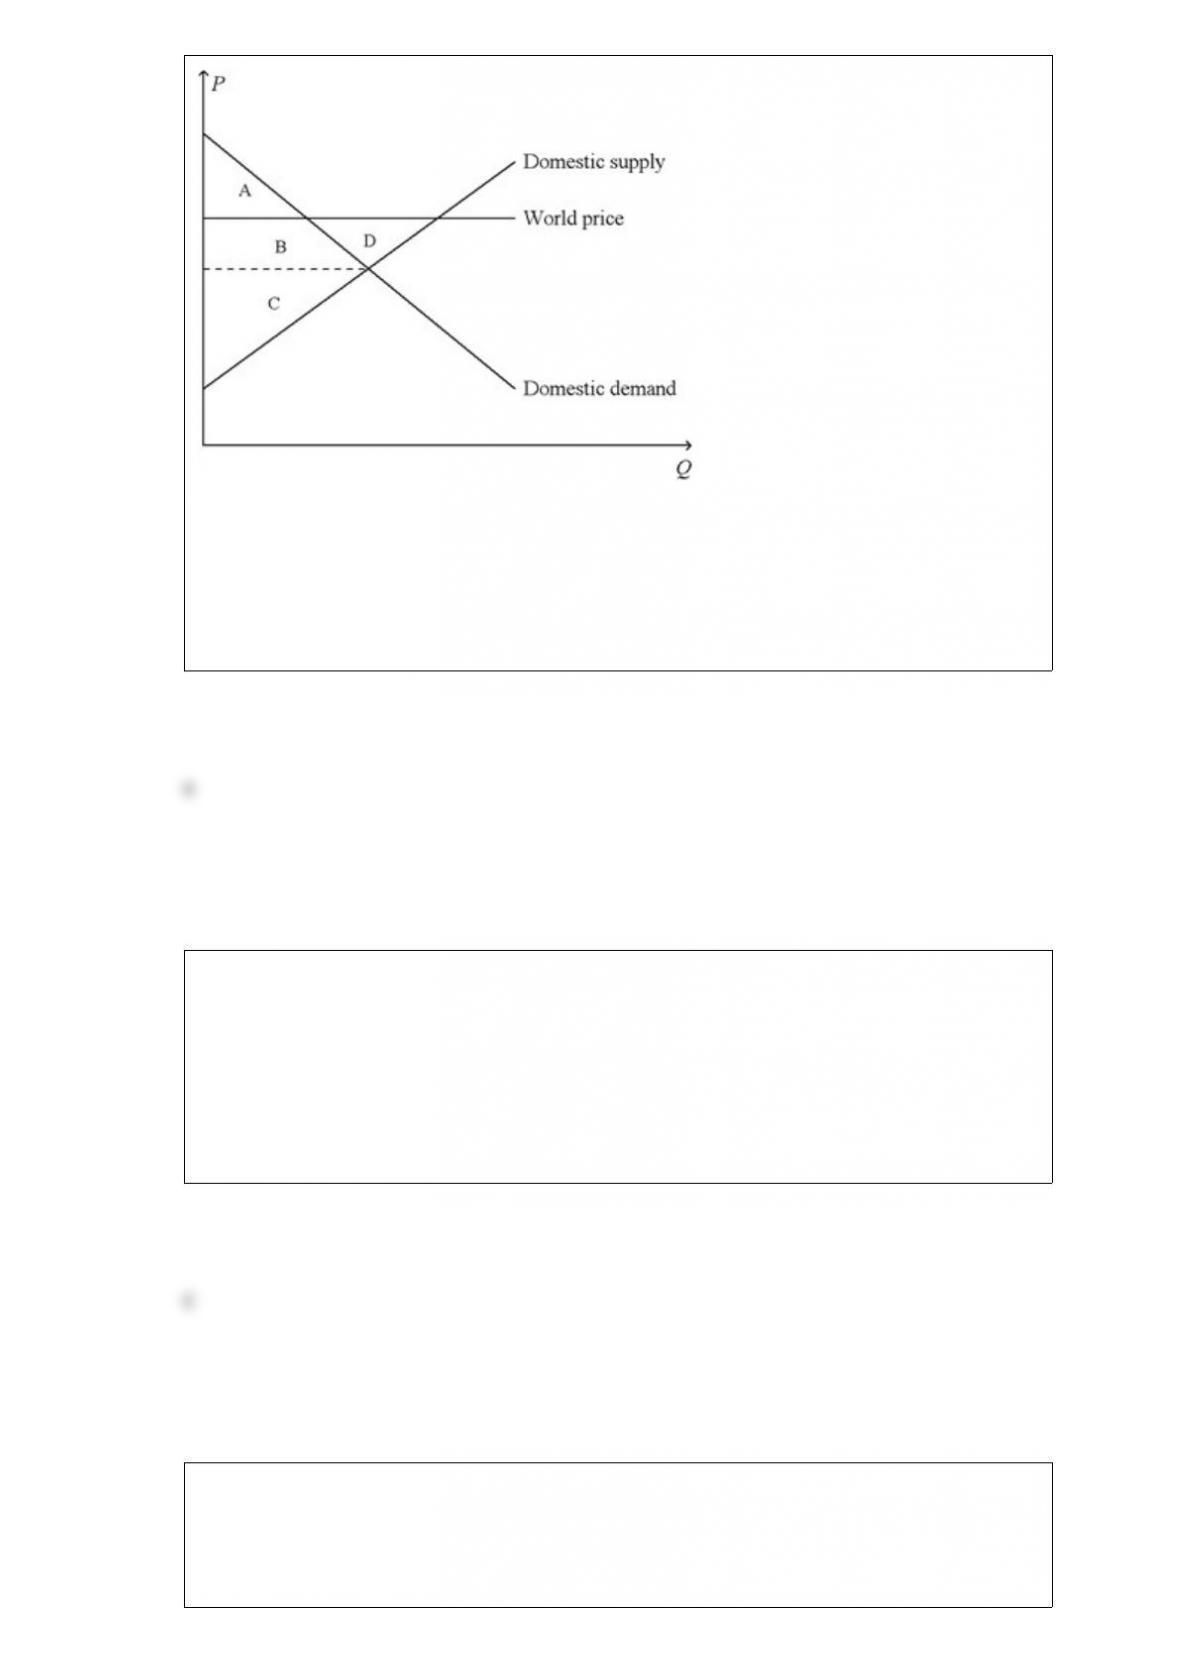
Refer to Figure 914. When the country for which the figure is drawn allows
international trade in crude oil,
a. consumer surplus for domestic crudeoil consumers decreases.
b. the demand for crude oil by domestic crudeoil consumers decreases.
c. the losses of the domestic losers outweigh the gains of the domestic winners.
d. domestic crudeoil producers sell less crude oil.
A key determinant of the price elasticity of supply is the
a. number of close substitutes for the good in question.
b. extent to which buyers alter their quantities demanded in response to changes in
prices.
c. length of the time period.
d. extent to which buyers alter their quantities demanded in response to changes in their
incomes.
Table 62
PriceQuantity
DemandedQuantity
Supplied
$03750
$530050
$10225100
$15150150
$2075200
$250250
Refer to Table 62. A price floor set at $20 will
a. be binding and will result in a surplus of 75 units.
b. be binding and will result in a surplus of 125 units.
c. be binding and will result in a surplus of 200 units.
d. not be binding.
Figure 623
Refer to Figure 623. The effective price received by sellers after the tax is imposed is
a. $3.
b. $4.
c. $5.
d. $6.
Joe and Fred are economists. Joe thinks that the wealthiest 10% of the US population

should be taxed a rate higher than the rest of society because they can better afford it.
Fred thinks that everyone should be taxed at the same rate because that is the fairest
scenario and the wealthy should not be penalized for their success. In this example, Joe
and Fred
a. disagree about the validity of a positive theory.
b. have different normative views about tax policy.
c. must both be incorrect because tax policy is never that simple.
d. None of the above is correct.