
If a firm has excess capacity, it means
A) that the firm expends too much of its resources on advertising its product without
seeing an appreciable increase in sales.
B) that the firm is not producing its minimum efficient scale of output.
C) that the firm’s long-run average cost of producing a given quantity exceeds its
short-run cost of producing that same quantity.
D) that the firm’s quantity supplied exceeds its quantity demanded.
If the number of unemployed workers is 200 million, and the number in the labor force
is 500 million, what is the unemployment rate?
A) 0.4%
B) 4%
C) 14%
D) 40%
The government budget for the country of Economia is in surplus in 2011, and in deficit
in the following year, 2012. We can conclude the
A) government must have raised tax rates or cut spending.
B) government must have cut tax rates or increased spending.

C) government fiscal policy did not change between 2011 and 2012.
D) none of the above
Monthly expenditures for a family of 4 in 2012 averaged $1,400. In 2013, the cost of
the same purchases was $1,500. If 2012 is the base year, what was the CPI in 2013?
A) 110
B) 107
C) 100
D) 93
The United States has a trade ________ with all its major trading partners and a trade
________ with every region of the world except for Latin America.
A) deficit; deficit
B) deficit; surplus
C) surplus; deficit
D) surplus; surplus
E) deficit; balance
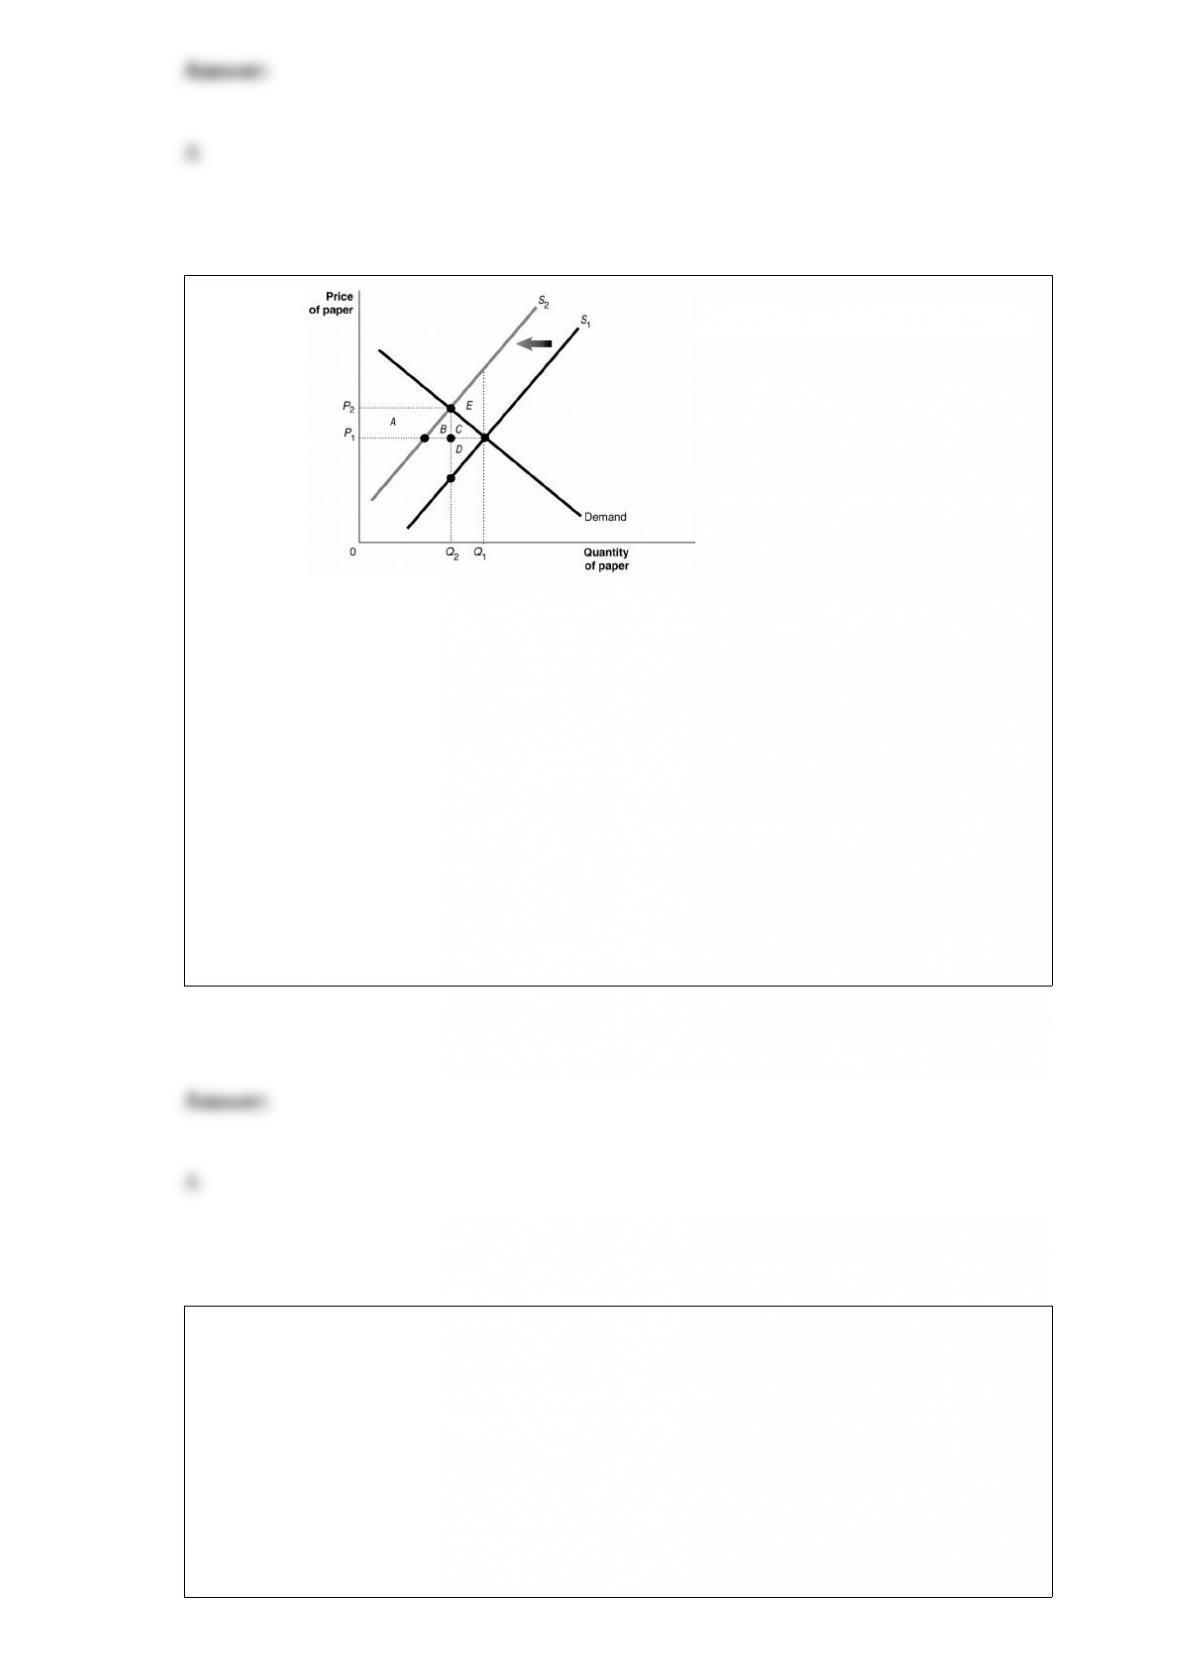
Figure 5-4 Suppose there are several paper
mills producing paper for a market. These mills, located upstream from a fishing
village, discharge a large amount of wastewater into the river. The waste material
affects the number of fish in the river, and the use of the river for recreation and as a
public water supply source. Figure 5-4 shows the paper market. Use this Figure to
answer the following question(s). What does S2 represent?
A) the market supply curve that reflects social cost
B) the market supply curve that reflect private cost
C) the market supply curve that reflects external cost
D) the market supply curve that reflects social benefit
Calculate the income elasticity if an 8 percent increase in income leads to a 4 percent
increase in quantity demanded for organic produce.
A) -0.66
B) 0.5
C) 1.5
D) 2
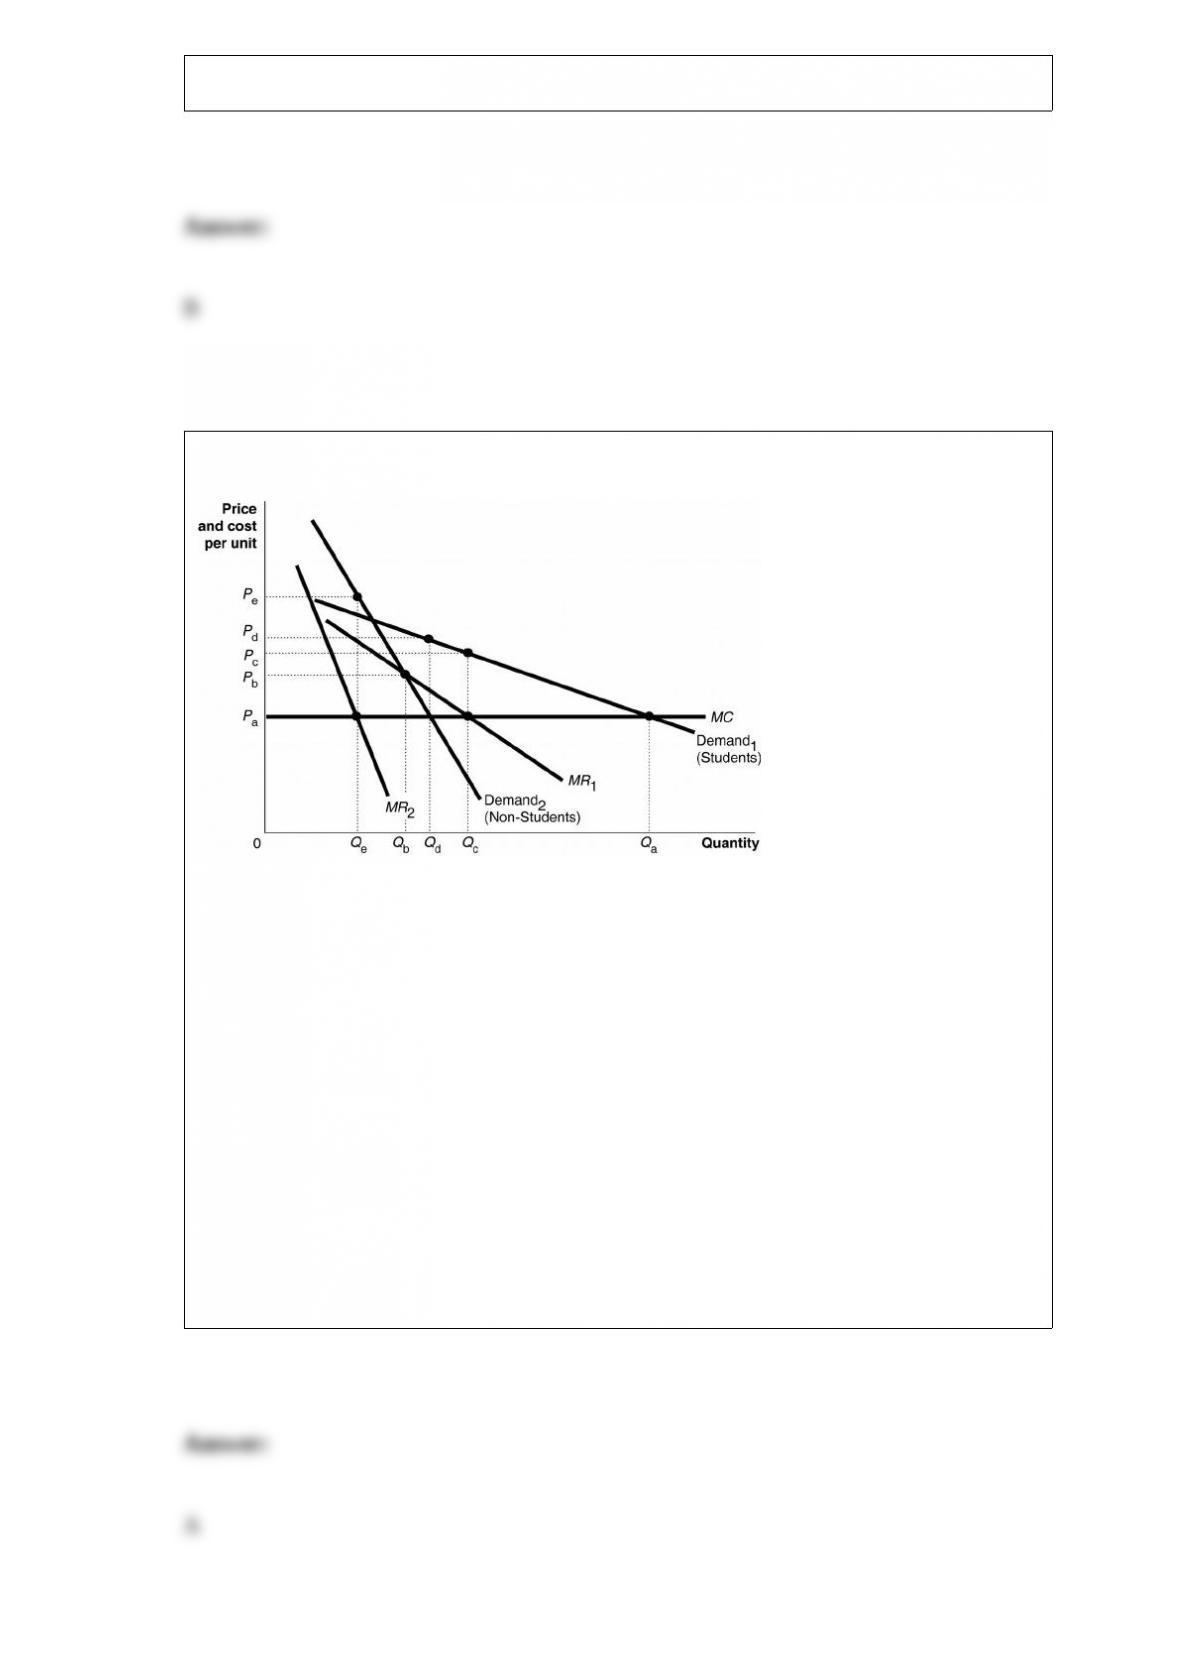
Figure 16-2
Plato Playhouse, a theatre
company in the university town of Wegg, caters to two groups of customers: students
and the non-student population. Figure 16-2 shows the demand curves for the two
groups of customers. Suppose Plato Playhouse charges a single price of Pd for each
performance. Which of the following statements is true?
A) The company is selling more than the profit-maximizing quantity in the non-student
market and less than the profit-maximizing quantity in the student market.
B) The company is selling less than the profit-maximizing quantity in the non-student
market and more than the profit-maximizing quantity in the student market.
C) The company is selling less than the profit-maximizing quantity in both markets but
it is maximizing its revenue.
D) The company is selling less than the profit-maximizing quantity in both markets.
________ describes the relationship between consumption spending and disposable
income.
A) Household wealth
B) The liquidity trap
C) The consumption function
D) The paradox of thrift
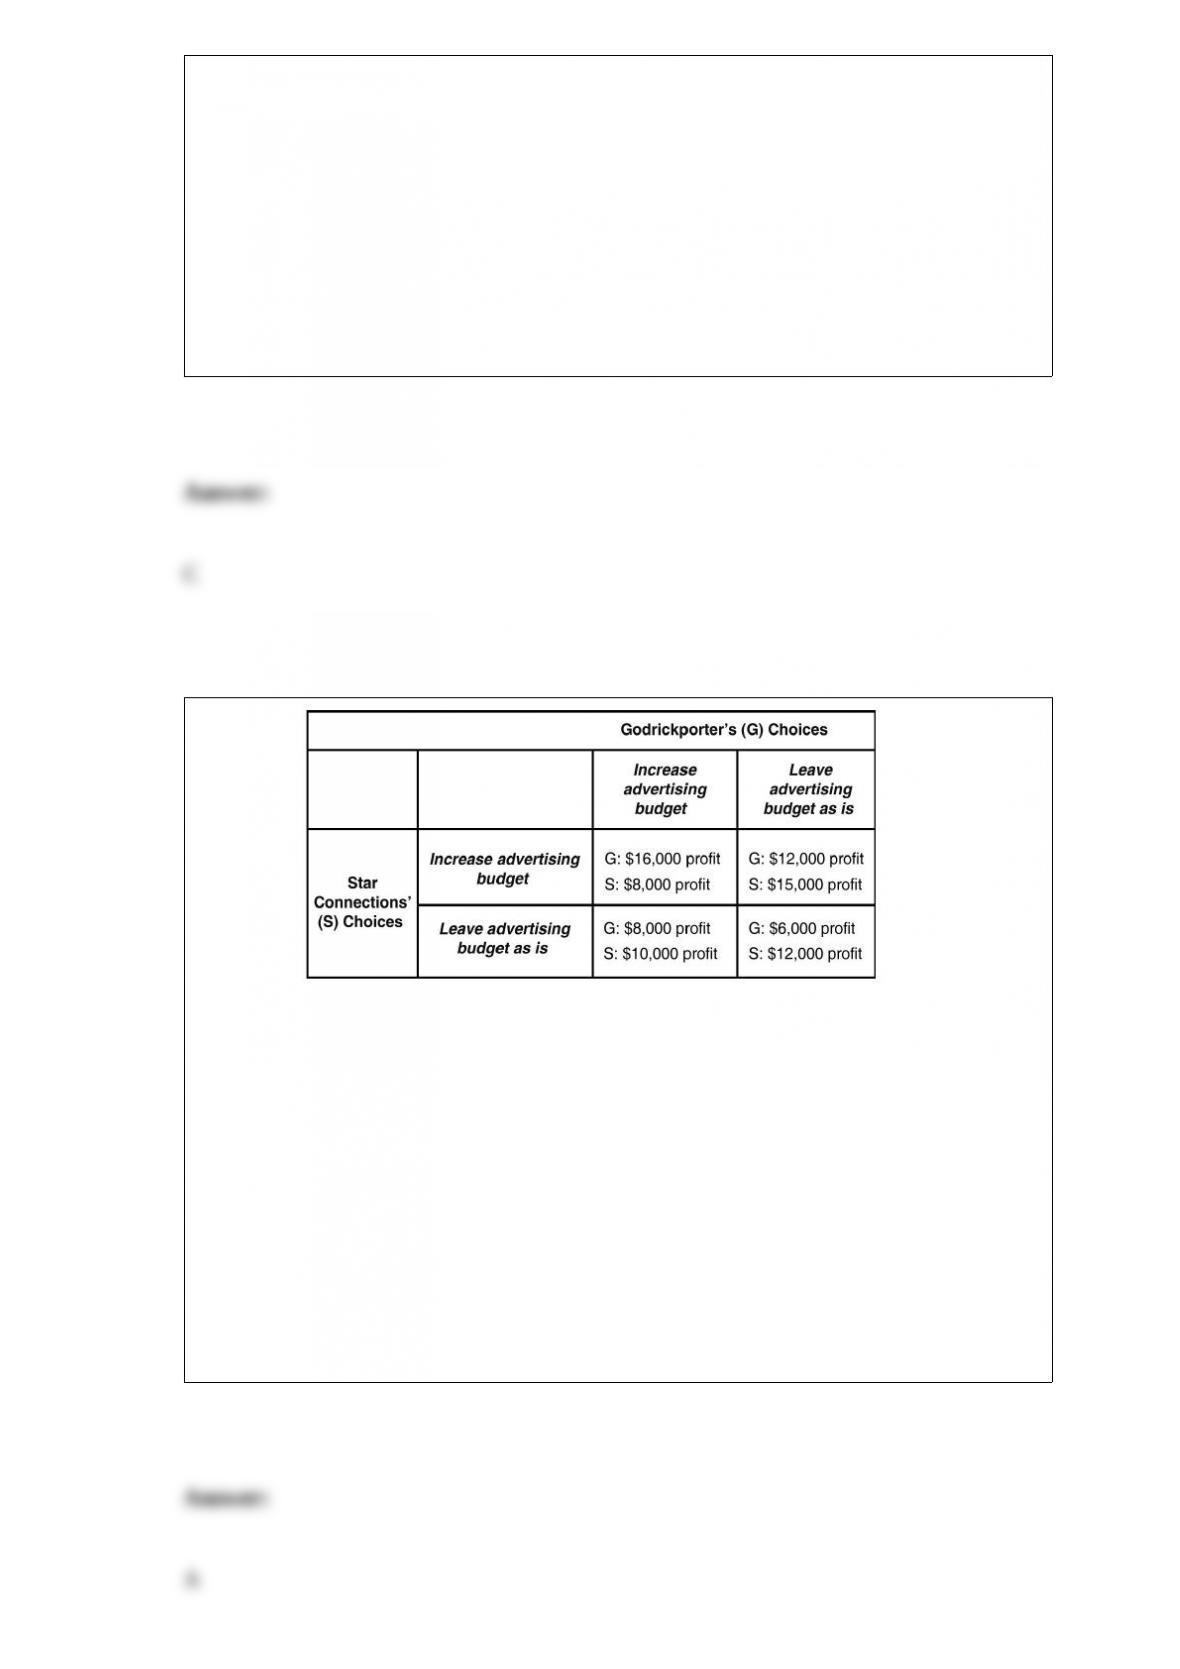
Table 14-1 Godrickporter
and Star Connections are the only two airport shuttle and limousine rental service
companies in the mid-sized town of Godrick Hollow. Each firm must decide on whether
to increase its advertising spending to compete for customers. Table 14-1 shows the
payoff matrix for this advertising game. Is there a dominant strategy for Star
Connections and if so, what is it?
A) No, its outcome depends on what Godrickporter does.
B) Yes, Star Connections should increase its advertising spending.
C) Yes, Star Connections should reduce its advertising spending.
D) Yes, Star Connections’ dominant strategy is to collude with Godrickporter.

During 1970-1997, the U.S. federal government was
A) in surplus every year.
B) balanced every year.
C) in deficit every year.
D) in deficit most of those years.
Refer to Figure 18-1. Area F+G represents
A) the portion of sales tax revenue borne by consumers.
B) the portion of sales tax revenue borne by producers.
C) the excess burden of the sales tax.
D) sales tax revenue collected by the government.
A perfectly competitive market is in long-run equilibrium. At present there are 100
identical firms each producing 5,000 units of output. The prevailing market price is $20.
Assume that each firm faces increasing marginal cost. Now suppose there is a sudden
increase in demand for the industry’s product which causes the price of the good to rise
to $24. Which of the following describes the effect of this increase in demand on a
typical firm in the industry?

A) In the short run, the typical firm increases its output and makes an above normal
profit.
B) In the short run, the typical firm’s output remains the same but because of the higher
price, its profit increases.
C) In the short run, the typical firm increases its output but its total cost also rises,
resulting in no change in profit.
D) In the short run, the typical firm increases its output but its total cost also rises.
Hence, the effect on the firm’s profit cannot be determined without more information.
A demand curve which is ________ represents perfectly inelastic demand, and a
demand curve which is ________ represents inelastic demand.
A) downward sloping; vertical
B) horizontal; downward sloping
C) vertical; downward sloping
D) upward sloping; horizontal
Figure 4-1
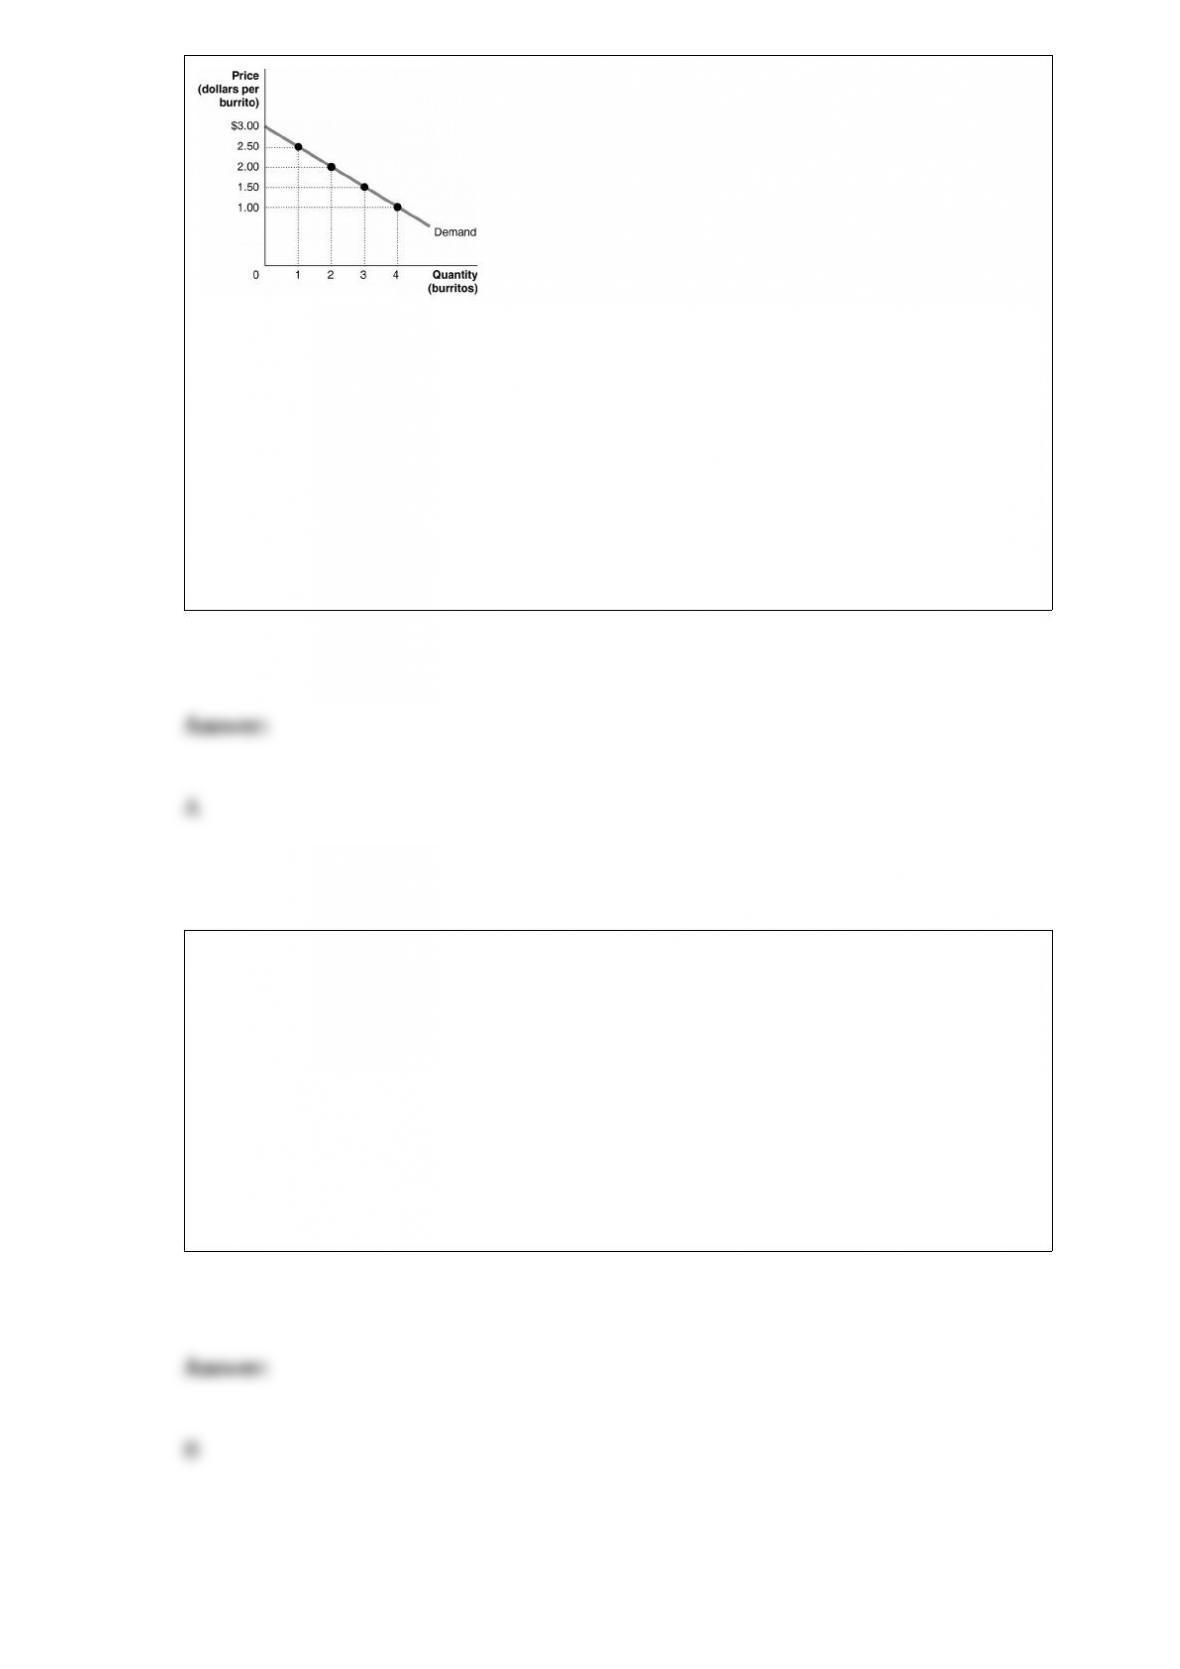
Figure 4-1 shows Arnold’s demand curve for burritos.
If the market price is $1.00, what is the consumer surplus on the third burrito?
A) $0.50
B) $1.00
C) $1.50
D) $7.50
The increased generosity of unemployment insurance programs in Canada as compared
to the United States should
A) decrease the duration of unemployment in Canada as compared to the United States.
B) increase the duration of unemployment in Canada as compared to the United States.
C) have no impact on the duration of unemployment in Canada.
D) raise the duration of unemployment in the United States.
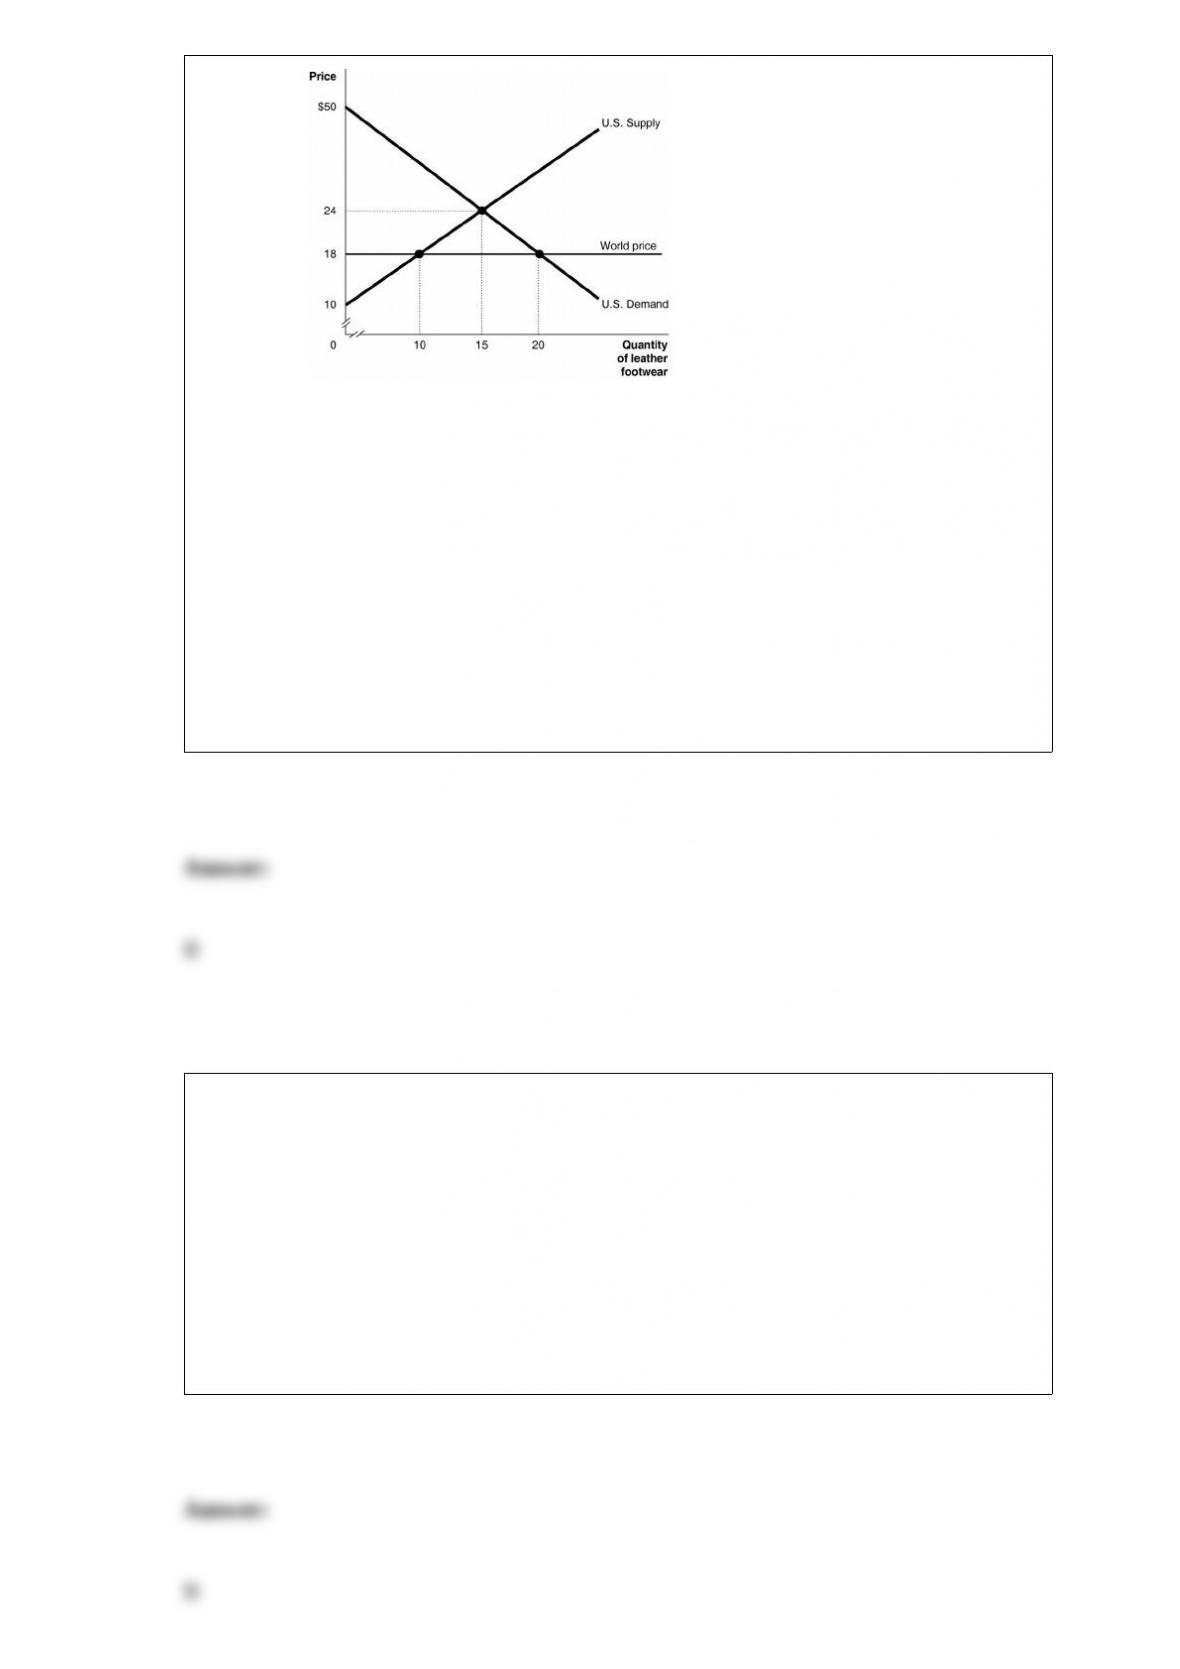
Figure 9-1 Figure 9-1 shows the U.S. demand
and supply for leather footwear.
Suppose the government allows imports of leather footwear into the United States.
What will be the domestic quantity supplied?
A) 5 units
B) 10units
C) 15 units
D) 20 units
According to Robert Fogel, economic growth ________ health, and health ________
economic growth.
A) improves; worsens
B) improves; improves
C) worsens; improves
D) worsens; worsens
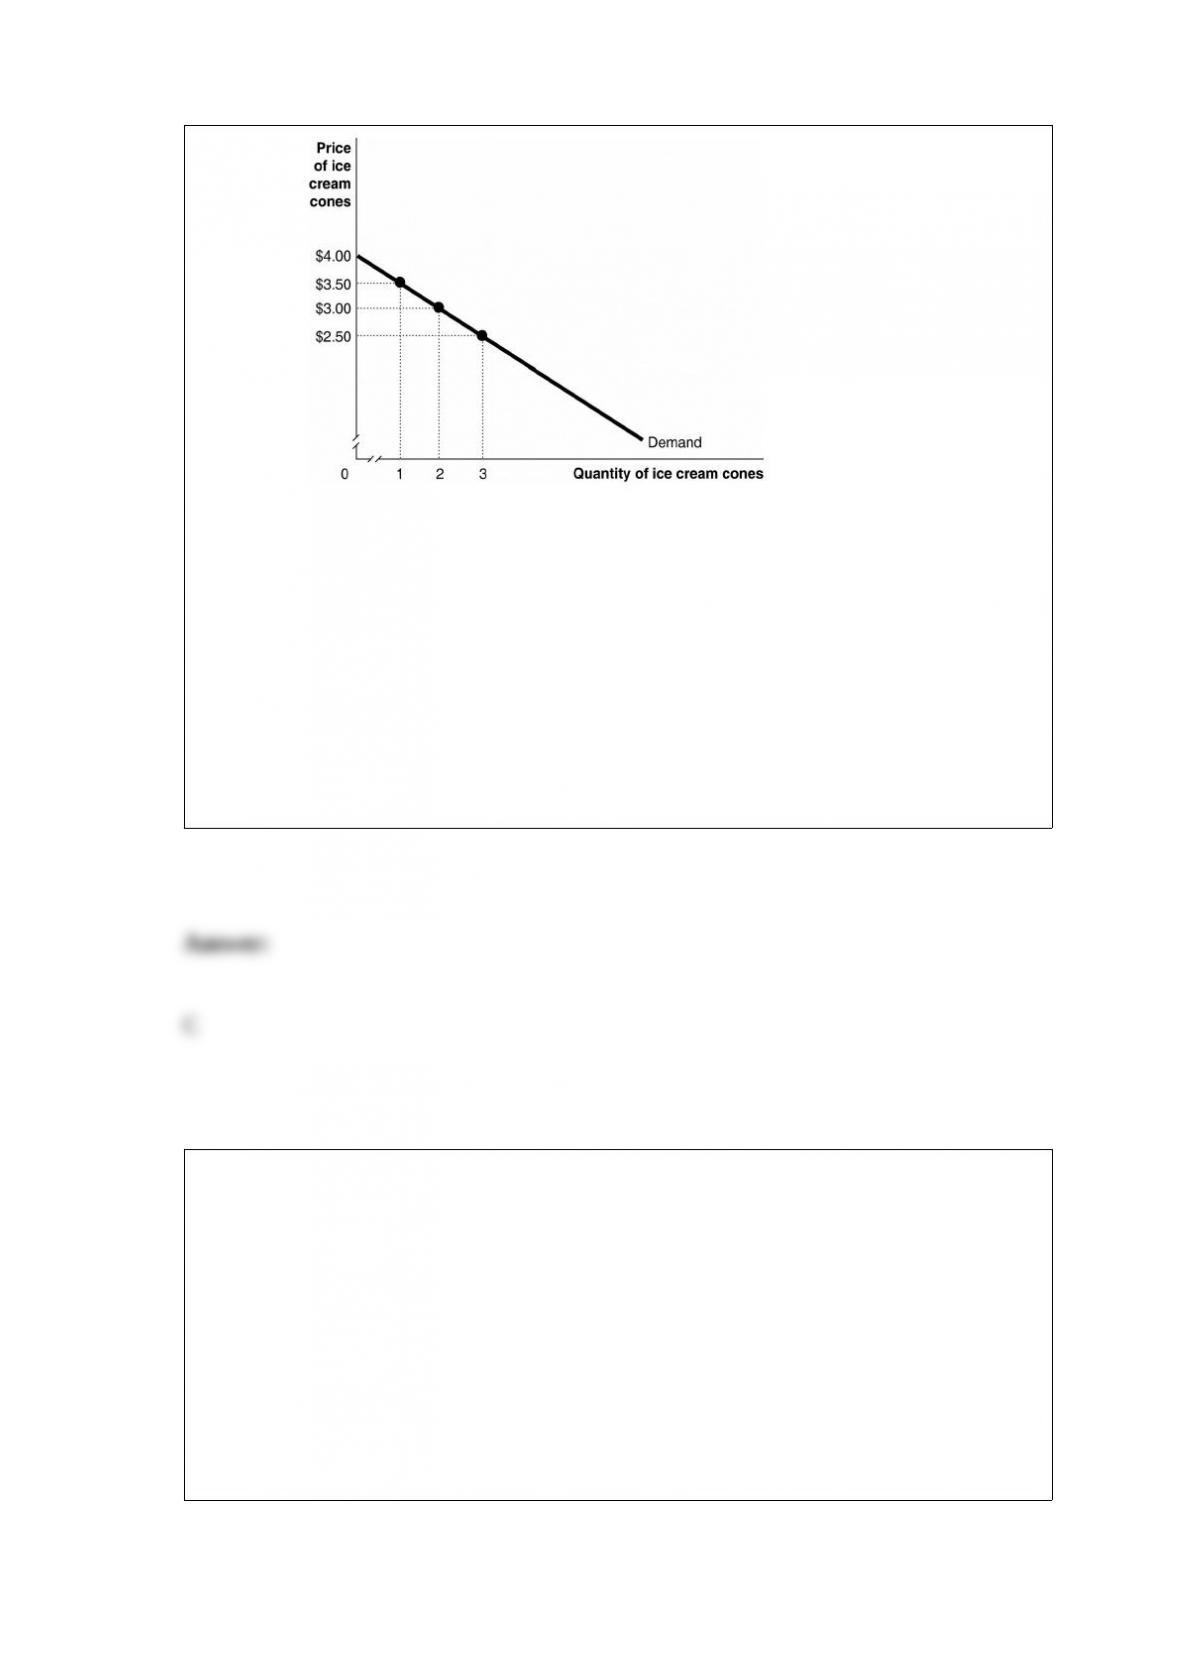
Figure 4-1 Figure 4-1 shows Kendra’s
demand curve for ice-cream cones.
Kendra’s marginal benefit from consuming the first ice cream cone is
A) $9.00
B) $7.50
C) $3.50
D) $0.50
A perfectly competitive firm will maximize its profit at the rate of output where the
vertical distance between its total revenue and total cost is the largest. This is the same
rate of output where
A) average total cost equals marginal revenue.
B) marginal revenue equals marginal profit.
C) marginal revenue equals marginal cost.
D) marginal revenue equals average revenue.