
The interest payment on a bond is called
A) the coupon payment.
B) principal.
C) the interest rate.
D) the face value.
Because of the slope(s) of the ________, we can say that a decrease in the price level
leads to a higher level of real GDP demanded.
A) aggregate demand curve
B) short-run aggregate supply curve
C) long-run aggregate supply curve
D) short-run and long-run aggregate supply curves
If, when a firm doubles all its inputs, its average cost of production decreases, then
production displays
A) diminishing returns.
B) economies of scale.
C) diseconomies of scale.

D) declining fixed costs.
In the long run,
A) the firm’s fixed costs are greater than its fixed costs in the short run.
B) all of the firm’s costs are explicit costs; there are no implicit costs of production.
C) the firm is more profitable than it is in the short run.
D) all of the firm’s costs are variable costs.
Productive efficiency is achieved when firms produce goods and services
A) most desired by society.
B) at the highest profit margin.
C) at the lowest cost.
D) of the highest quality.

Economics is the study of the ________ people make to attain their goals, given their
________ resources.
A) purchases; unlimited
B) choices; scarce
C) income; available
D) decisions; household
Assume that the demand curve for DVD players shifts to the left and the supply curve
for DVD players shifts to the right, but the supply curve shifts less than the demand
curve. As a result
A) both the equilibrium price and quantity of DVD players will decrease.
B) the equilibrium price of DVD players will decrease; the equilibrium quantity may
increase or decrease.
C) the equilibrium price of DVD players may increase or decrease; the equilibrium
quantity will increase.
D) the equilibrium price of DVD players will decrease; the equilibrium quantity will
increase.
Figure 13-9
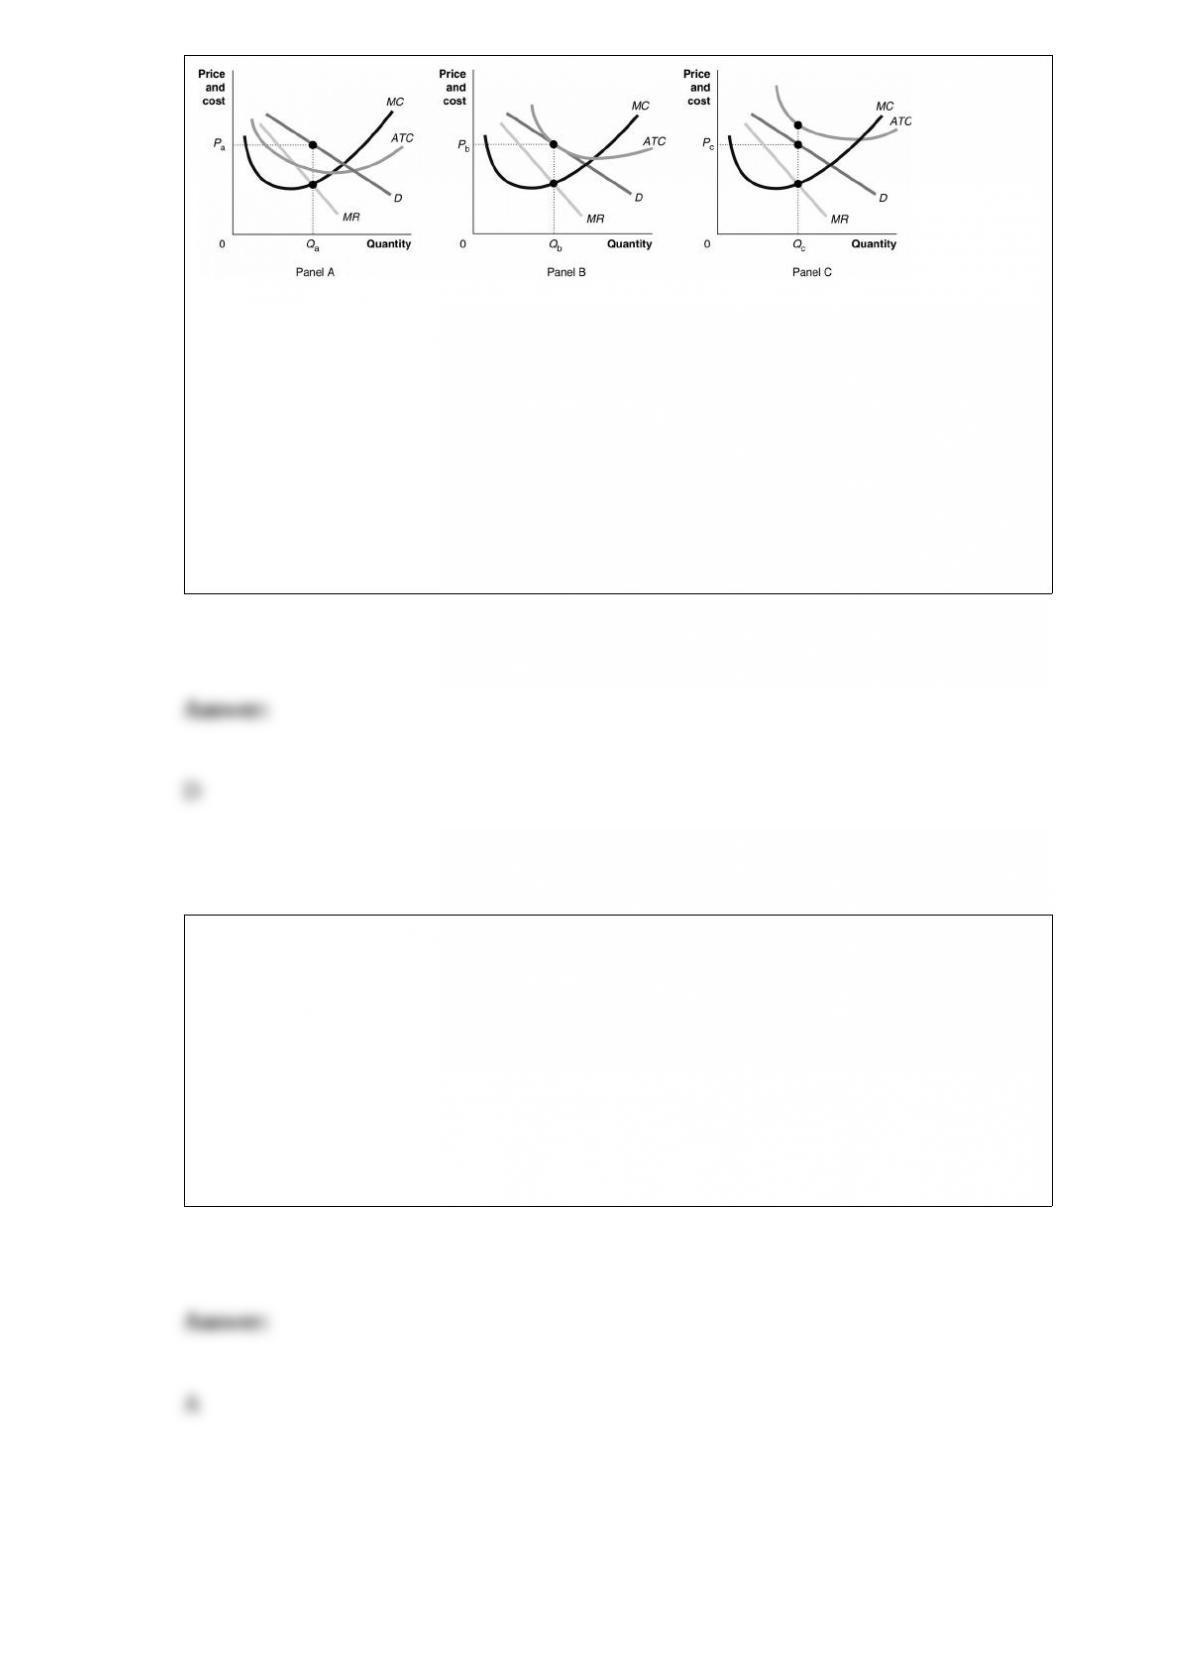
Which of the
graphs in the figure depicts a monopolistically competitive firm that is earning
economic profits?
A) Panel A
B) Panel B
C) Panel C
D) Panel A and Panel B
If firms pay what are called “efficiency wages,” they pay wages that
A) motivate workers to increase their productivity.
B) are lower than average to ensure maximum profit.
C) will eventually lower the unemployment rate.
D) are mandated by the government.
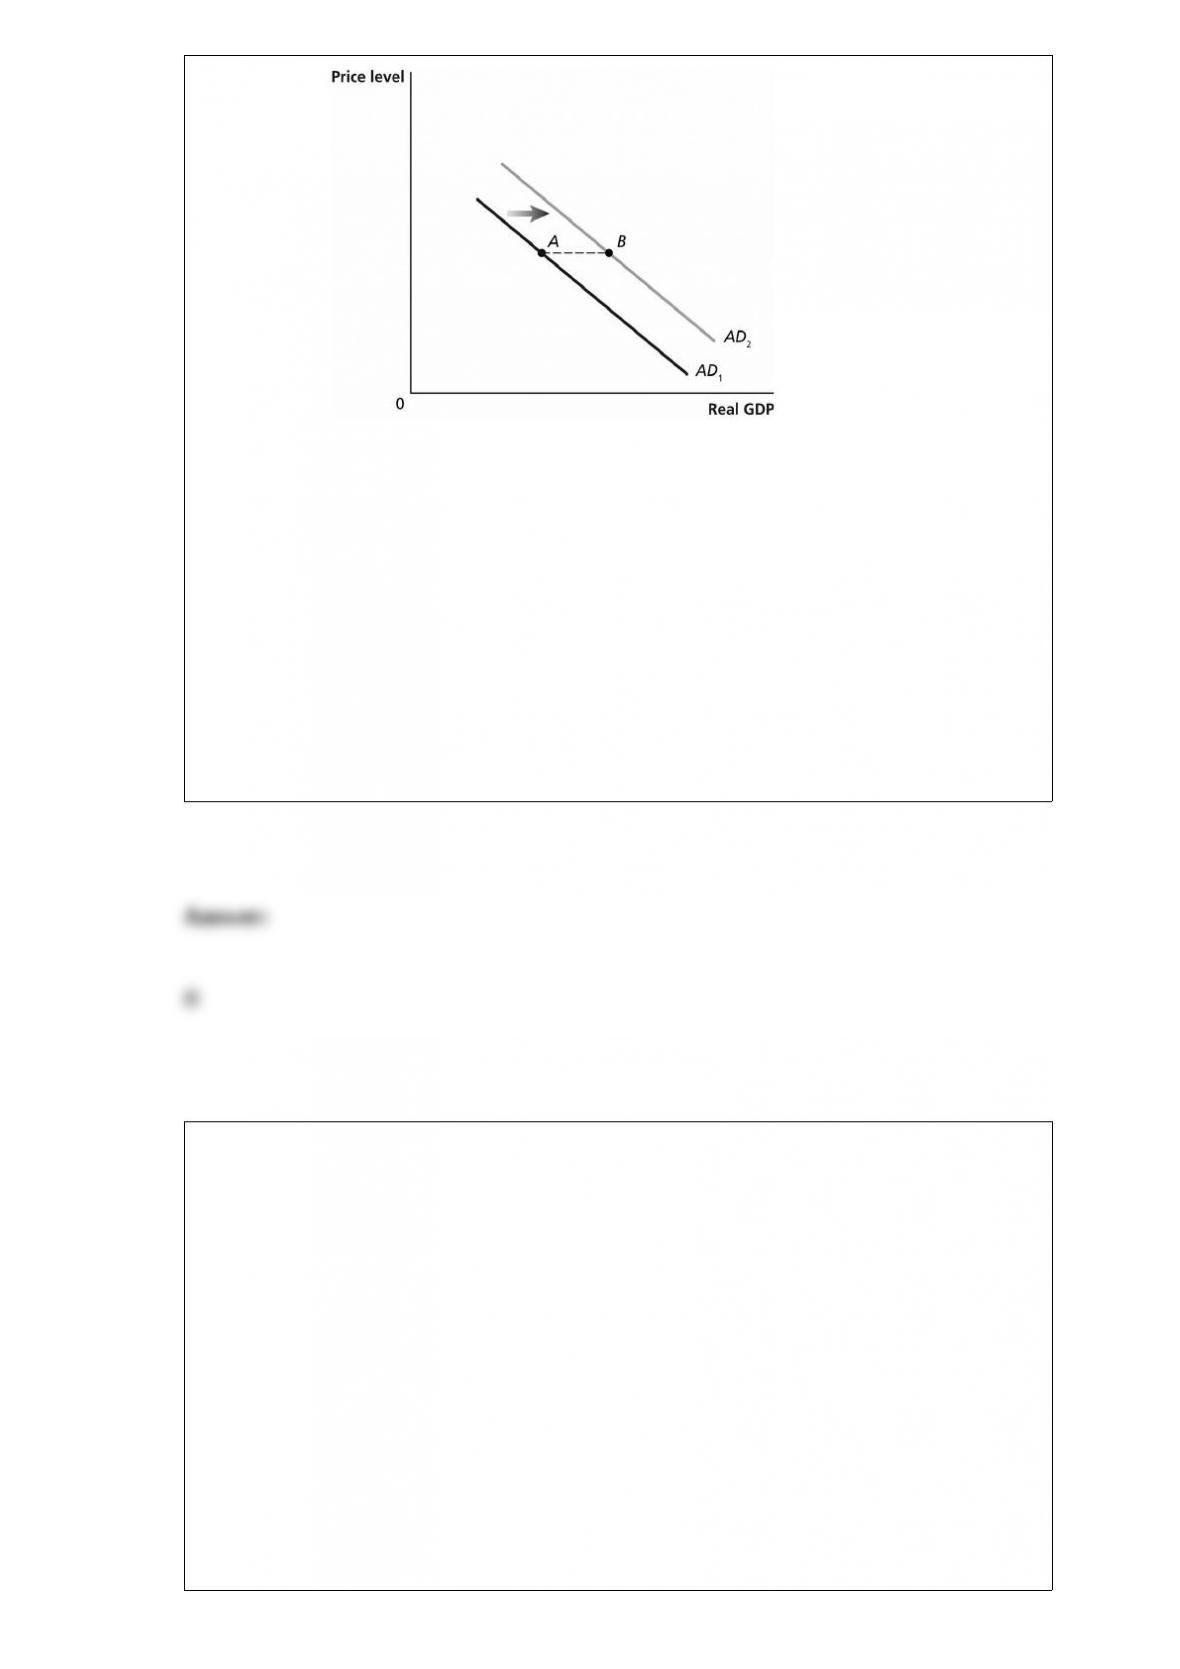
Figure 27-11
In the graph above, the shift from AD1 to AD2 represents the total change in aggregate
demand. If government purchases increased by $50 billion, then the distance from point
A to point B ________ $50 billion.
A) would be equal to
B) would be greater than
C) would be less than
D) may be greater than or less than
The demand curve for canned peas is downward sloping. If the price of canned peas, an
inferior good, rises,
A) the income effect which causes you to reduce your canned peas purchases is smaller
than the substitution effect which causes you to increase your purchases, resulting in a
net increase in quantity demanded.
B) the income effect which causes you to increase your canned peas purchases is
smaller than the substitution effect which causes you to reduce your purchases,
resulting in a net decrease in quantity demanded.
C) both the income and substitution effects reinforce each other to decrease the quantity
demanded.
D) the income and substitution effects offset each other, but the price effect of an
inferior good leads you to buy more canned peas.
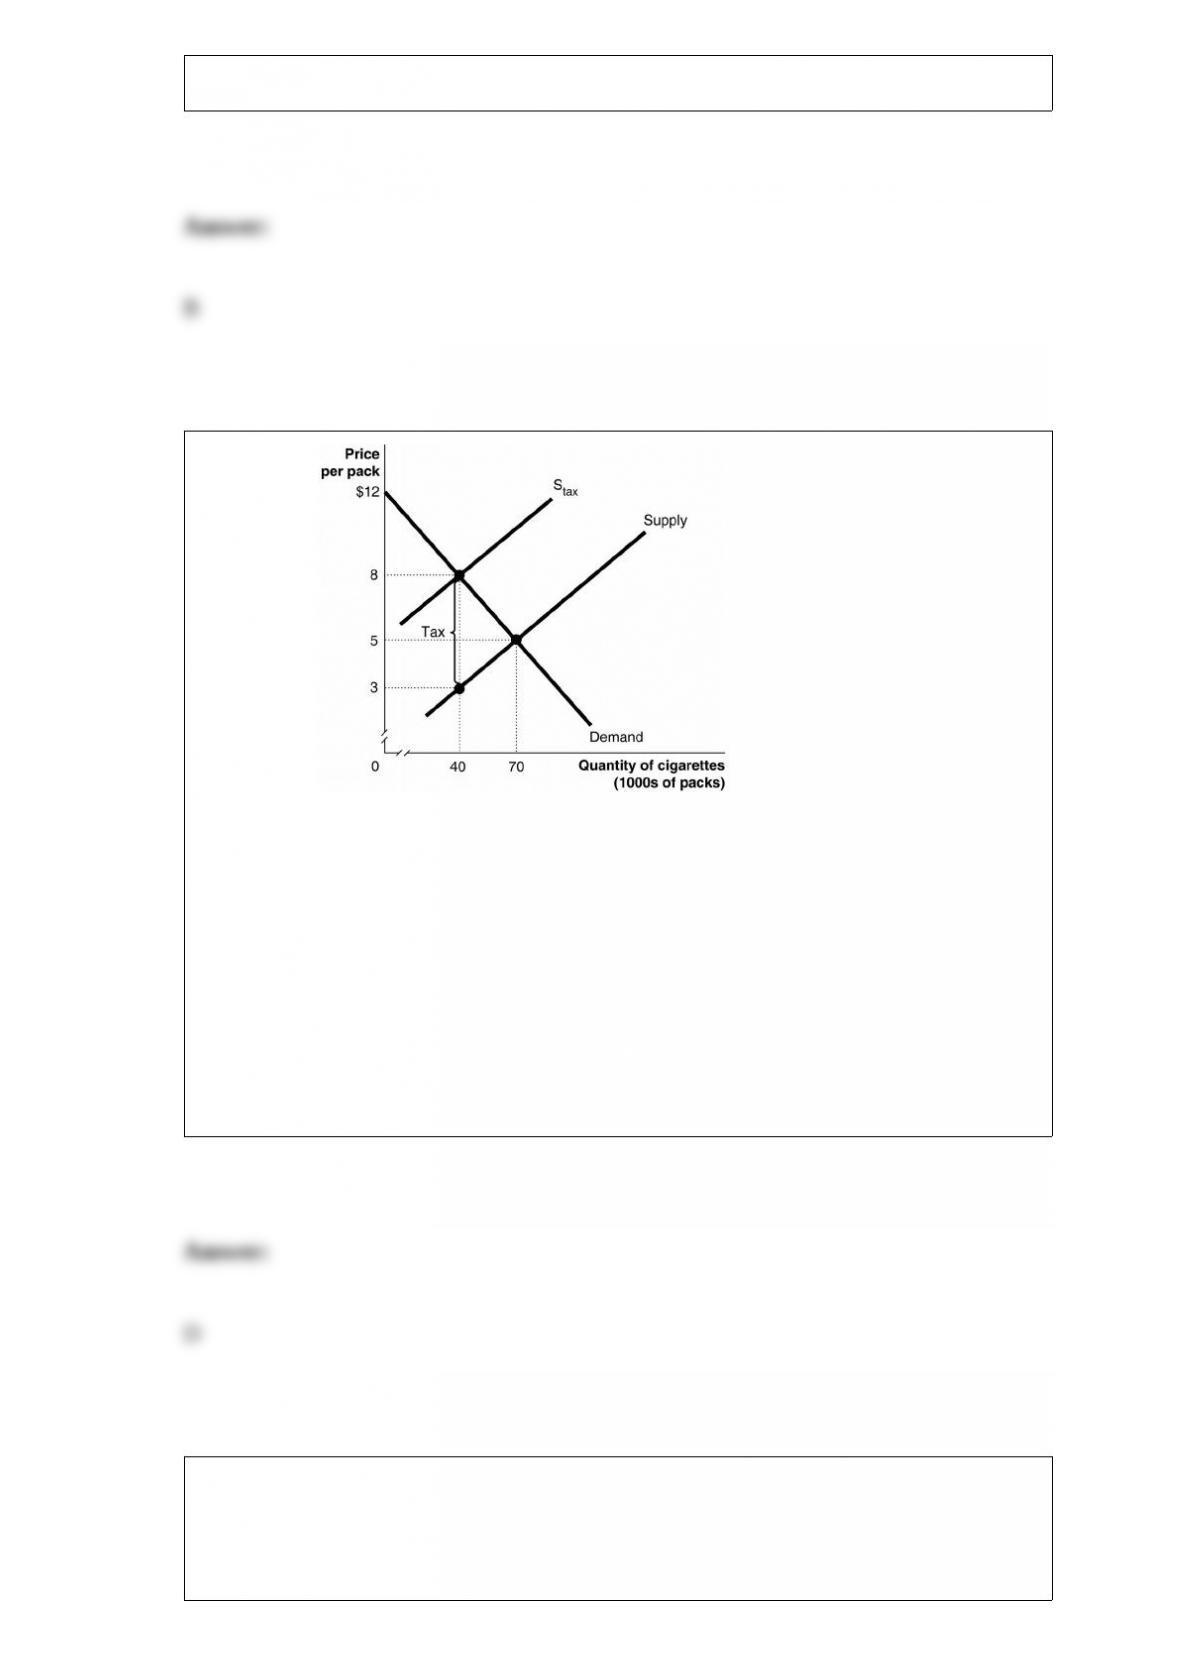
Figure 4-18 Figure 4-18 shows the market
for cigarettes. The government plans to impose a unit tax in this market.
How much of the tax is paid by buyers?
A) $8
B) $5
C) $4
D) $3
The gold standard is an example of
A) a floating exchange rate system.

B) a managed float exchange rate system.
C) a fixed exchange rate system.
D) a flexible exchange rate system.
E) the Bretton Woods System.
When you buy at a low price in one market then sell at a higher price in another market
you are engaging in
A) odd pricing.
B) arbitrage.
C) an antitrust prohibited practice.
D) price discrimination.
The owners of a ________ have a separate legal distinction from the business.
A) corporation
B) partnership
C) sole proprietorship
D) All of the above are correct.
Women typically earn less than men, even in the same occupation. Which of the
following is an explanation for this discrepancy?
A) Women do not work as hard as men because of cultural influences.
B) Women have, on average, less workforce experience than men of the same age.
C) Women are, on average, less motivated than men and therefore tend to avoid taking
on more responsibilities.
D) Women tend to take riskier jobs and earn compensating wage differentials.
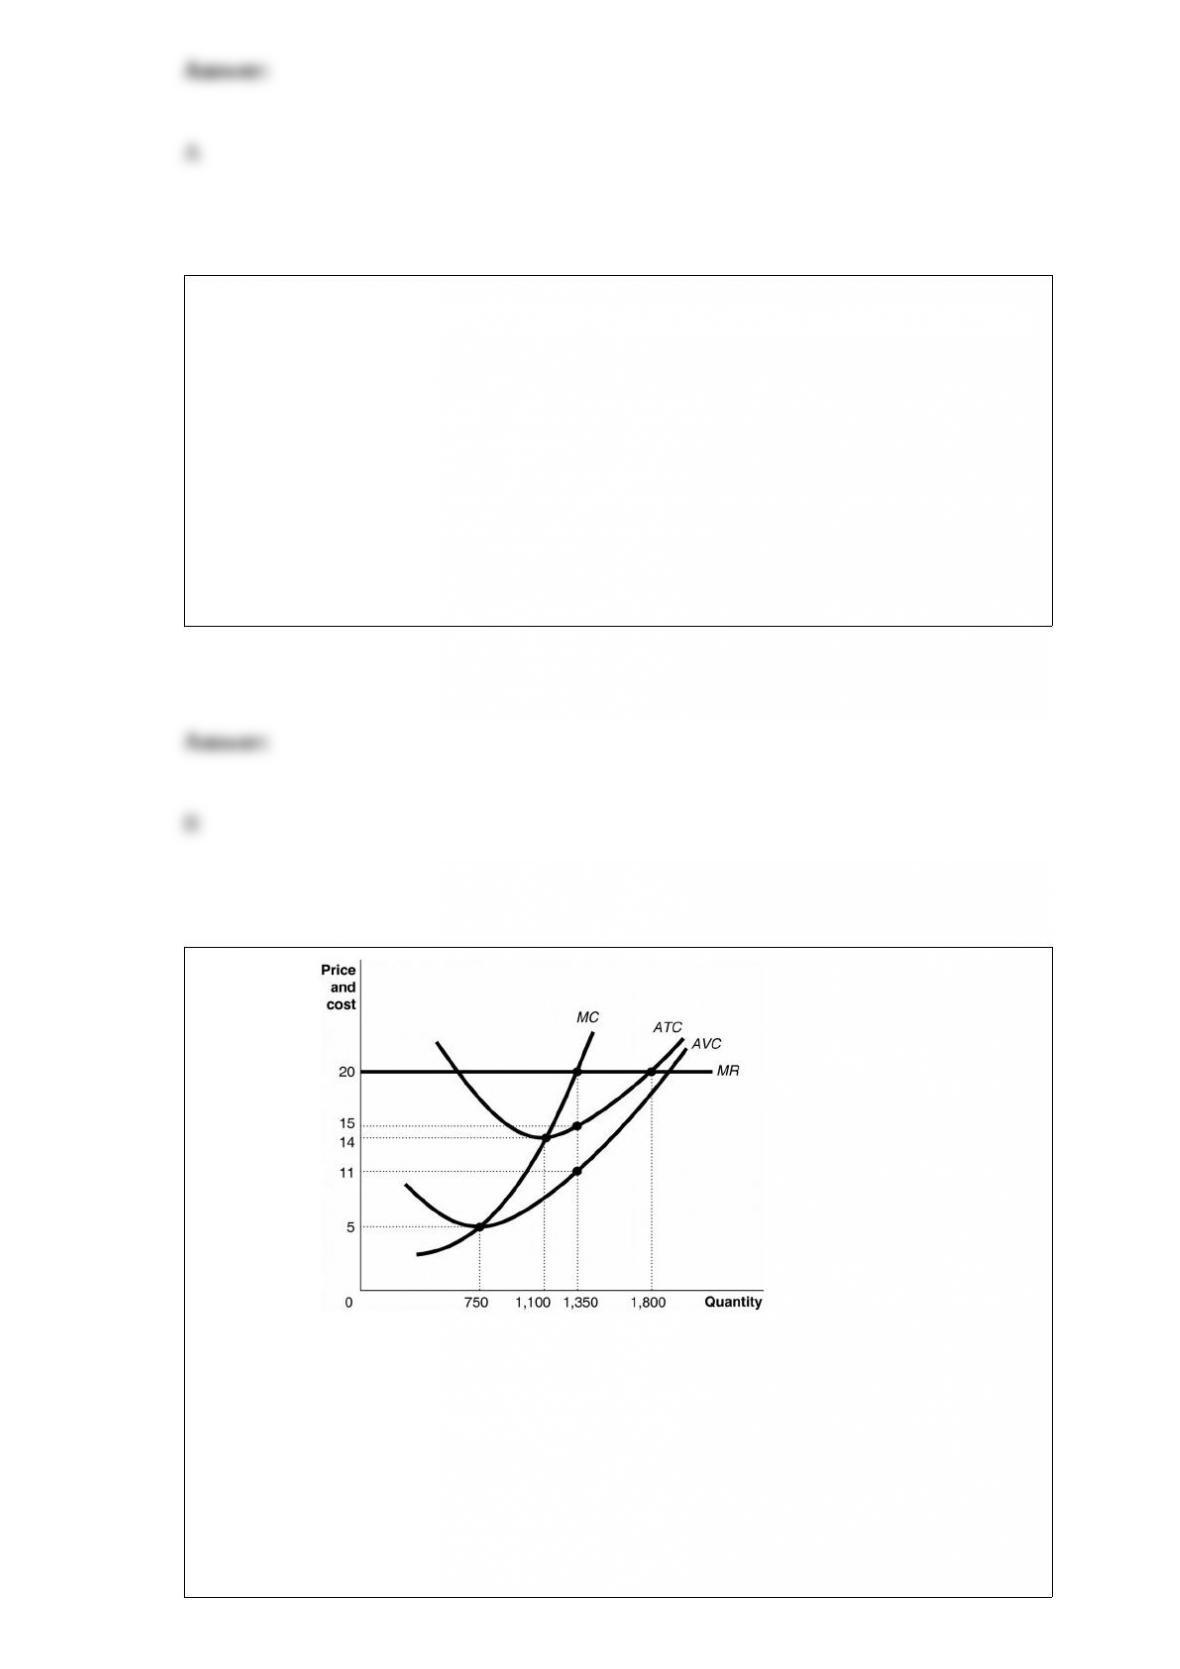
Figure 12-5 Figure 12-5 shows cost and
demand curves facing a typical firm in a constant-cost, perfectly competitive industry.
What is the minimum price the firm requires to produce output?
A) $20
B) $14
C) $5

D) It cannot be determined
Consumption spending is $22 million, planned investment spending is $7 million,
actual investment spending is $7 million, government purchases are $9 million, and net
export spending is $3 million. Based on this information, which of the following is
true?
A) There was an unplanned change in inventories.
B) Aggregate expenditure is equal to GDP.
C) Aggregate expenditure is greater than GDP.
D) Aggregate expenditure is less than GDP.
A game in which each player adopts its dominant strategy
A) will not lead to an equilibrium.
B) must be a cooperative game.
C) could result in a Nash equilibrium.
D) can never result in a Nash equilibrium.
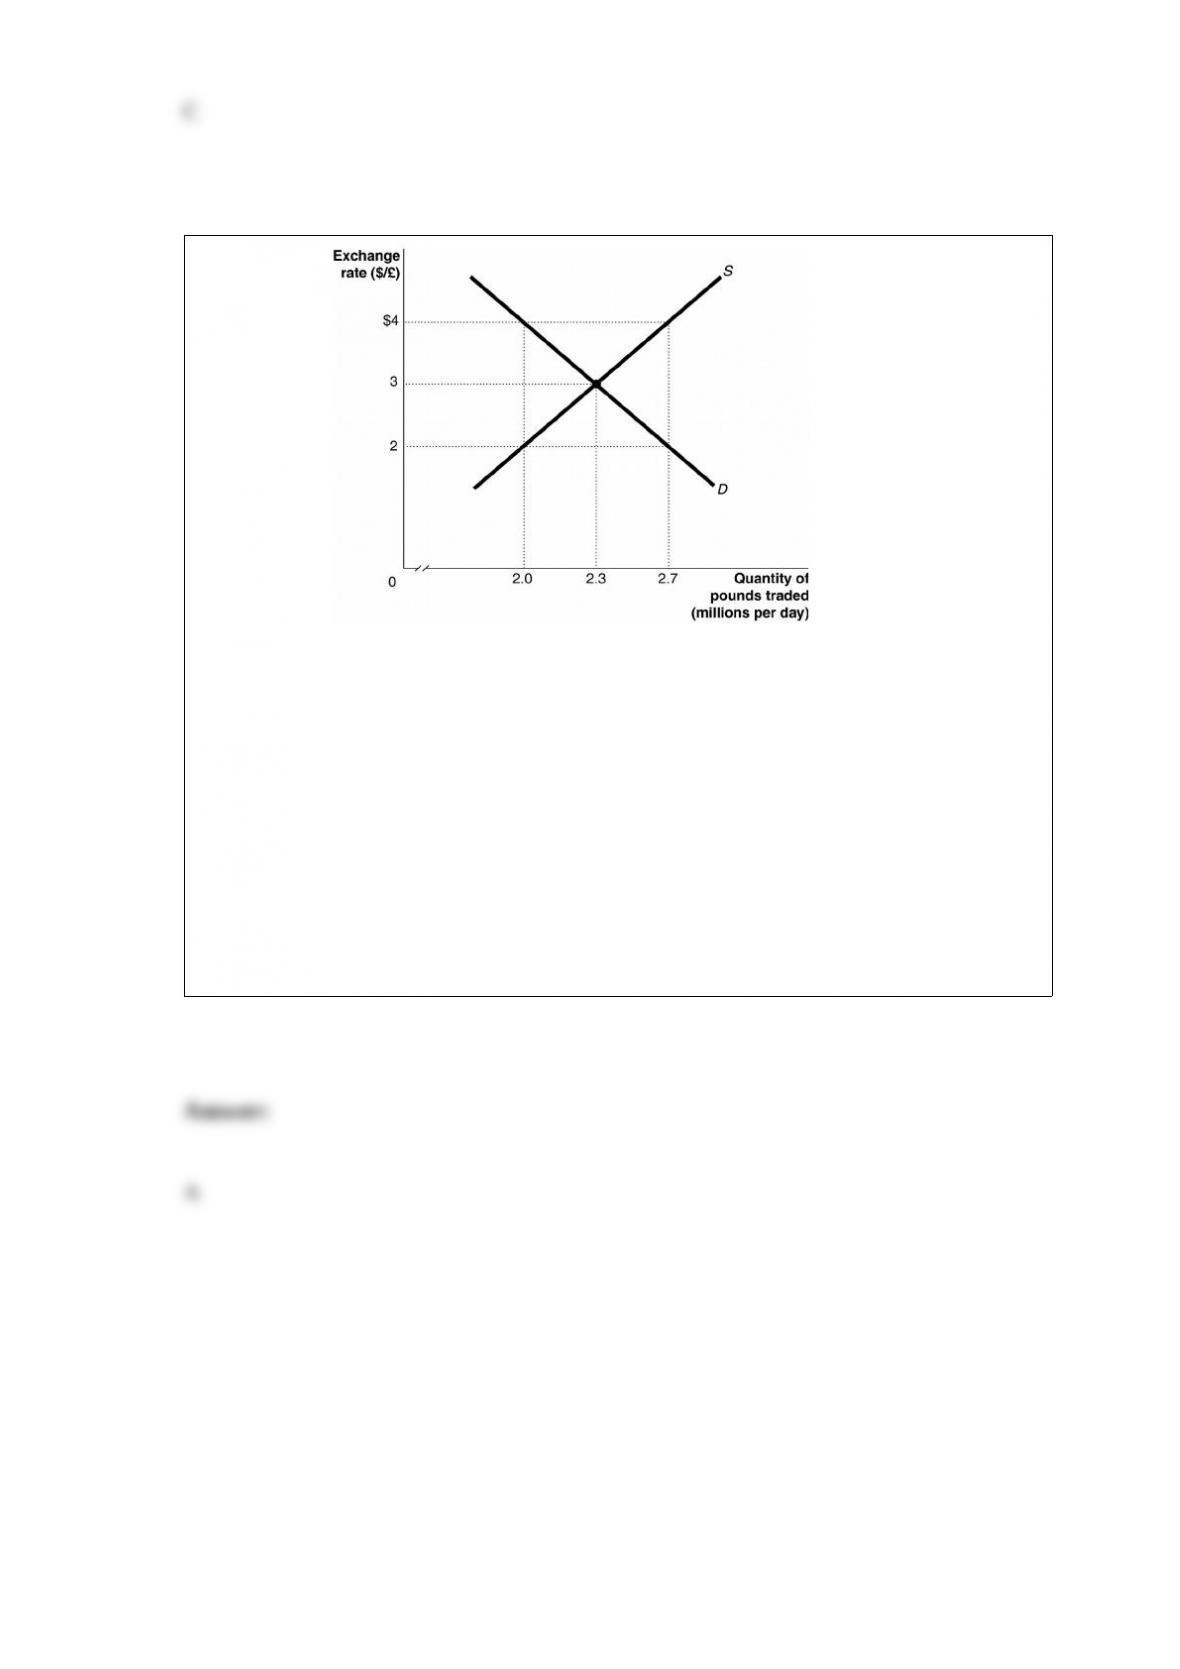
Figure 30-10
Under the Bretton Woods System of exchange rates, if the par exchange rate was $2 per
pound in the figure above, and equilibrium persisted at $3, then a revaluation of the
currency would have
A) increased the price of British exports to the United States.
B) increased the price of imports to Britain.
C) led to a current account surplus.
D) led to a balance of trade surplus.