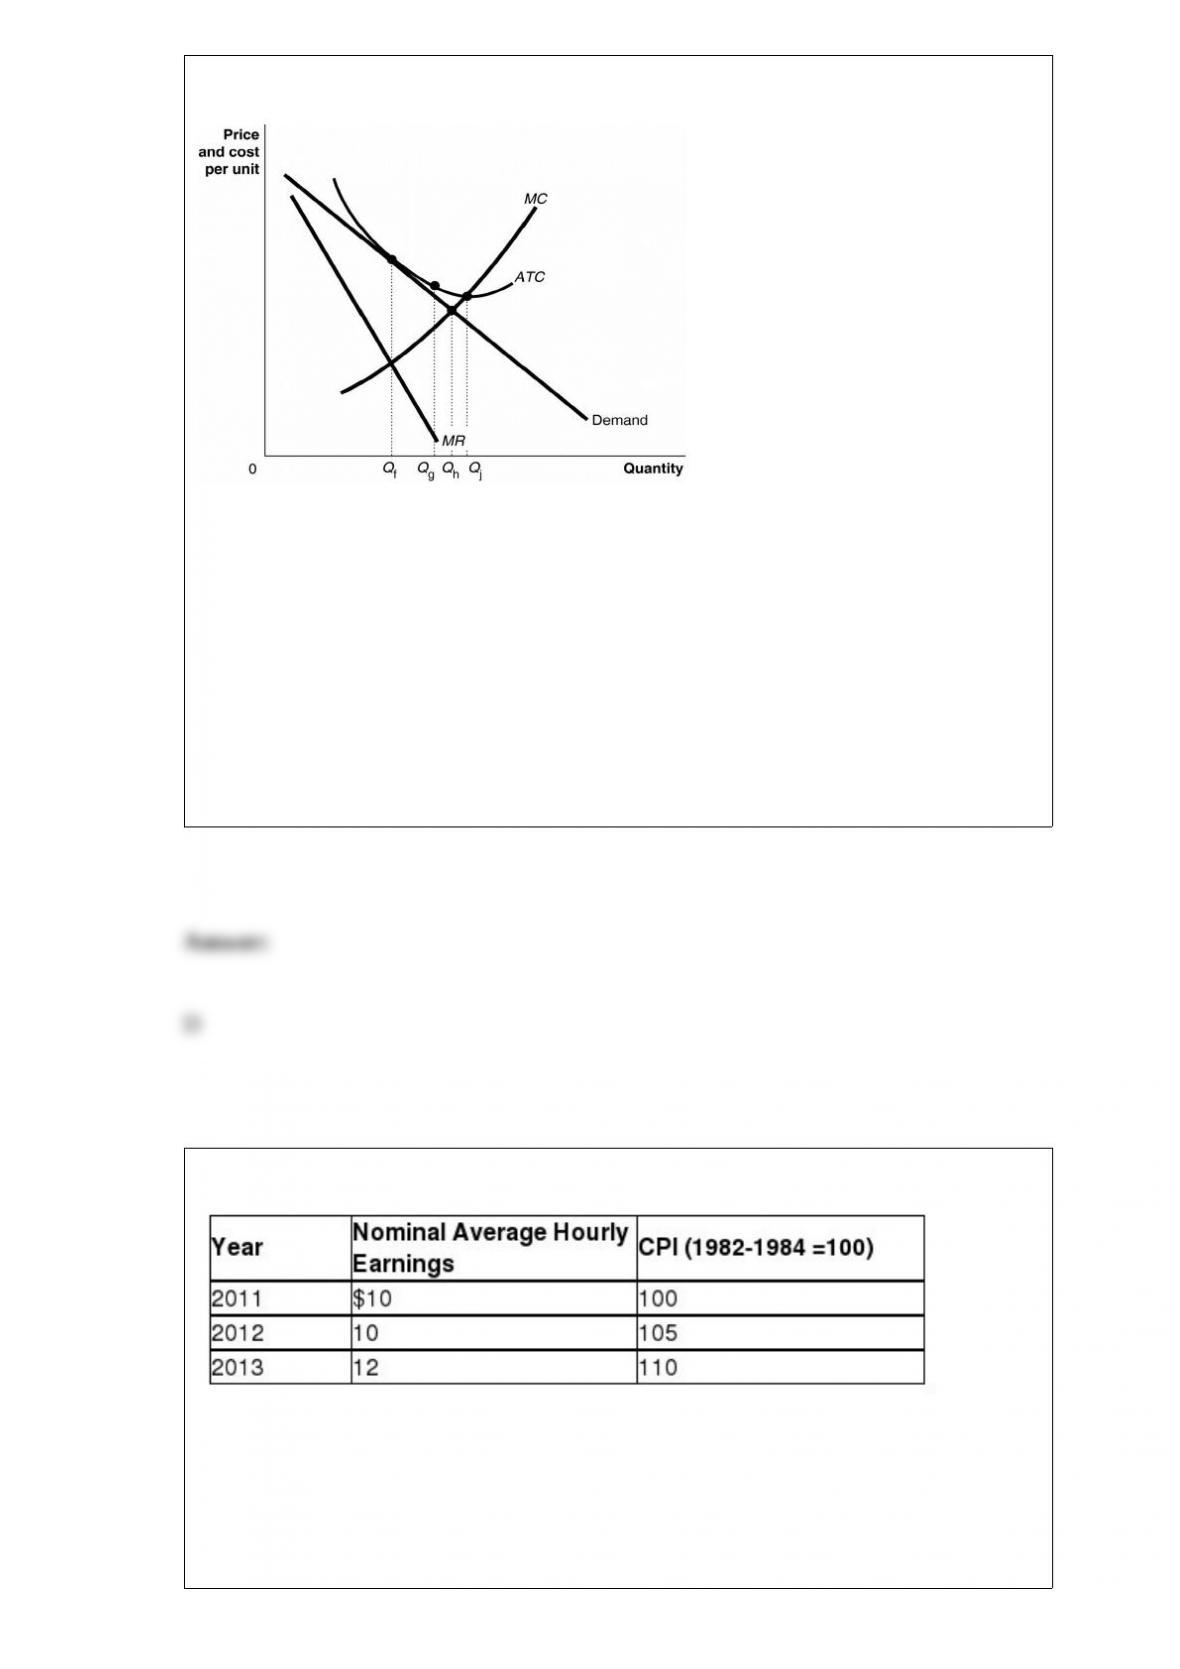
Figure 13-17
What is the productively efficient output for the firm represented in the diagram?
A) Qf units
B) Qg units
C) Qh units
D) Qj units
Table 9-19
Looking at the table above, what is the rate of growth of the average price level from
2012 to 2013?
A) 1%

B) 2%
C) 3.5%
D) 4.76%
E) 5.25%
If the price of milk was $2.50 a gallon and it is now $3.25 a gallon, what is the
percentage change in price?
A) 13 percent
B) 30 percent
C) 75 percent
D) 77 percent
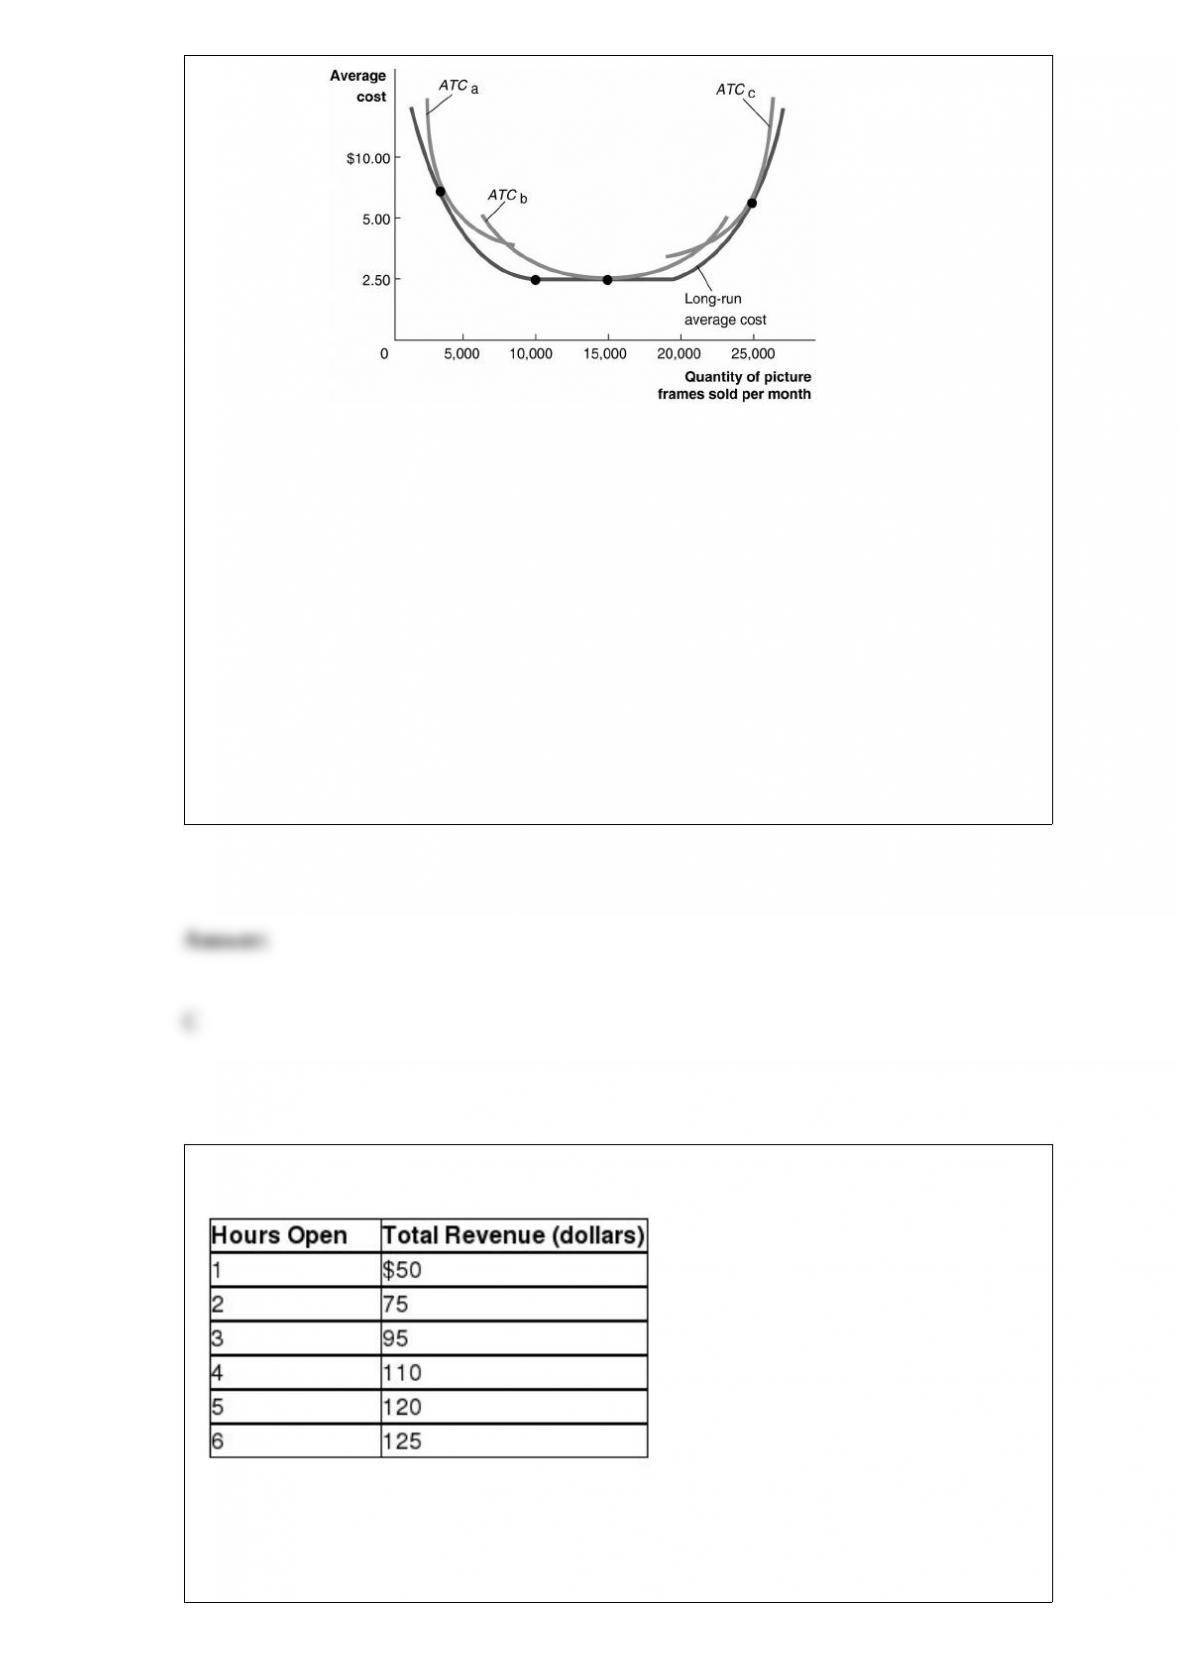
Figure 11-11 Figure 11-11
illustrates the long-run average cost curve for a firm that produces picture frames. The
graph also includes short-run average cost curves for three firm sizes: ATCa, ATC and
ATCc.
Constant returns to scale
A) occur for output rates greater than 5,000 picture frames.
B) occur between 5,000 and 20,000 picture frames per month.
C) occur between 10,000 and 20,000 pictures frames per month.
D) will shift the long-run average cost curve downward.
Table 1-1
Lydia runs a small nail salon in the town of New Hope. She is debating whether she
should extend her hours of operation. Lydia figures that her sales revenue will depend
on the number of hours the nail salon is open as shown in the table above. She would
have to hire a worker for those hours at a wage rate of $10 per hour. What is Lydia’s

marginal benefit if she decides to stay open for two hours instead of one hour?
A) $25
B) $50
C) $75
D) $125
Which of the following is a factor of production?
A) an acre of forested land
B) a U.S. Treasury bond
C) 20 shares of Ford stock
D) $25,000 in cash
The quantity of goods and services that can be produced by one worker or by one hour
of work is referred to as
A) technology.
B) labor productivity.
C) real GDP.
D) human capital.

An example of a payroll tax in the United States is
A) Social Security taxes.
B) taxes on corporate profit.
C) excise taxes on gasoline.
D) property taxes on real estate.
The curve showing the short-run relationship between the ________ and the ________
is called the Phillips curve.
A) nominal interest rate; real interest rate
B) unemployment rate; inflation rate
C) price level; real GDP
D) exchange rate; real interest rate

The sum of public and private saving in an economy is equal to
A) Y – C – T.
B) T – TR – G.
C) Y – C – G.
D) I – C – G.
Fluctuating exchange rates can alter a multinational firm’s profits and losses. German
auto maker Volkswagen produces automobiles in Germany and sells them in the United
States. If the dollar depreciates against the euro, then Volkswagen’s revenues from these
operations should ________ because it will take ________ U.S. dollars to purchase the
German-made Volkswagens.
A) rise; more
B) rise; fewer
C) fall; more
D) fall; fewer
An increase in the interest rate
A) decreases the opportunity cost of holding money.
B) increases the opportunity cost of holding money.
C) decreases the percentage yield of holding money.
D) increases the percentage yield of holding money.
When we graph consumption as a function of national income rather than as a function
of ________, the slope of this consumption function is the ________.
A) disposable income; MPC
B) personal income; MPC
C) disposable income; MPS
D) personal income; MPS
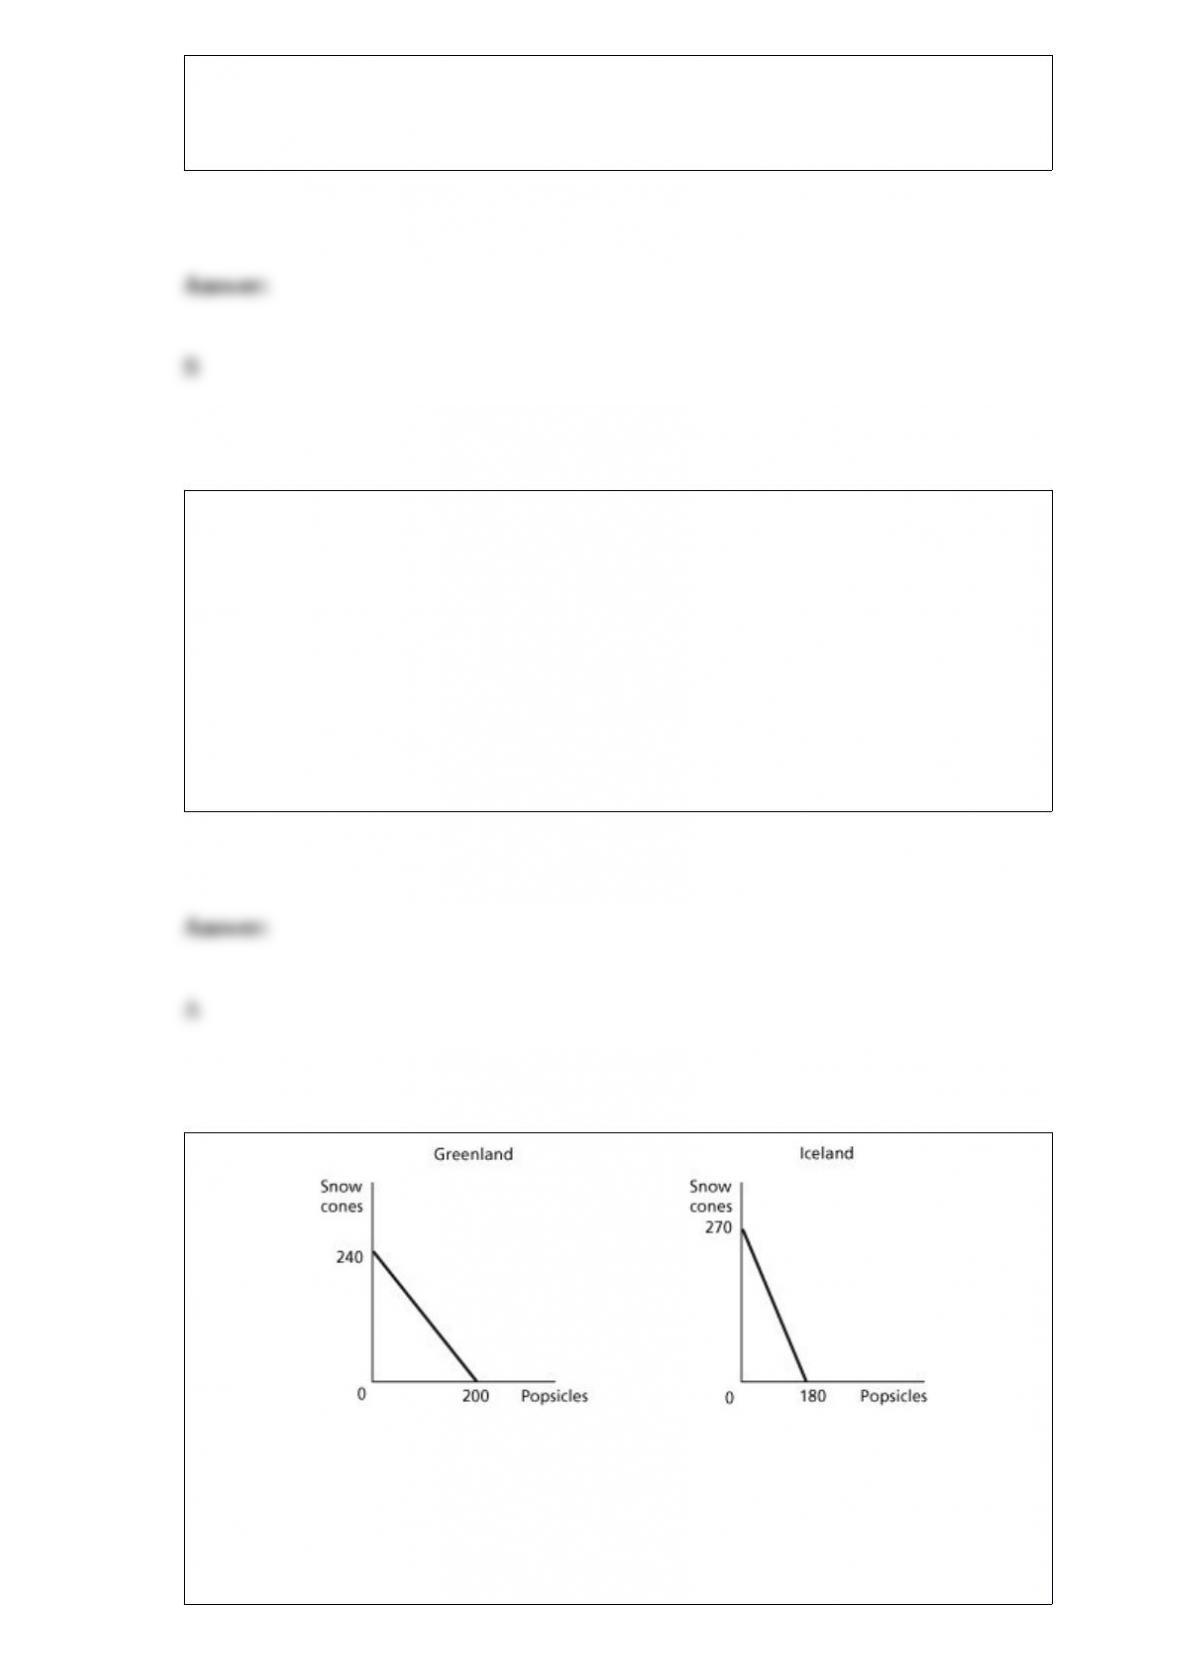
Figure 2-15 Figure
2-15 shows the production possibilities frontiers for Greenland and Iceland. Each
country produces two goods, snow cones and popsicles. What is the opportunity cost of
producing 1 popsicle in Iceland?
A) 1 1/2 snow cones

B) 3/4 of a snow cone
C) 2/3 of a snow cone
D) 270 snow cones
The money supply curve is vertical if
A) banks and the Fed jointly determine the money supply.
B) the Fed is able to completely determine the money supply.
C) banks and households determine the money supply.
D) households and the Fed jointly determine the money supply.
If net foreign investment in the United States is negative, how must national saving and
domestic investment be related?
A) Domestic investment and national saving must also be negative.
B) Domestic investment must be greater than national saving.
C) Domestic investment must be less than national saving.
D) Domestic investment can be greater than or less than national saving.