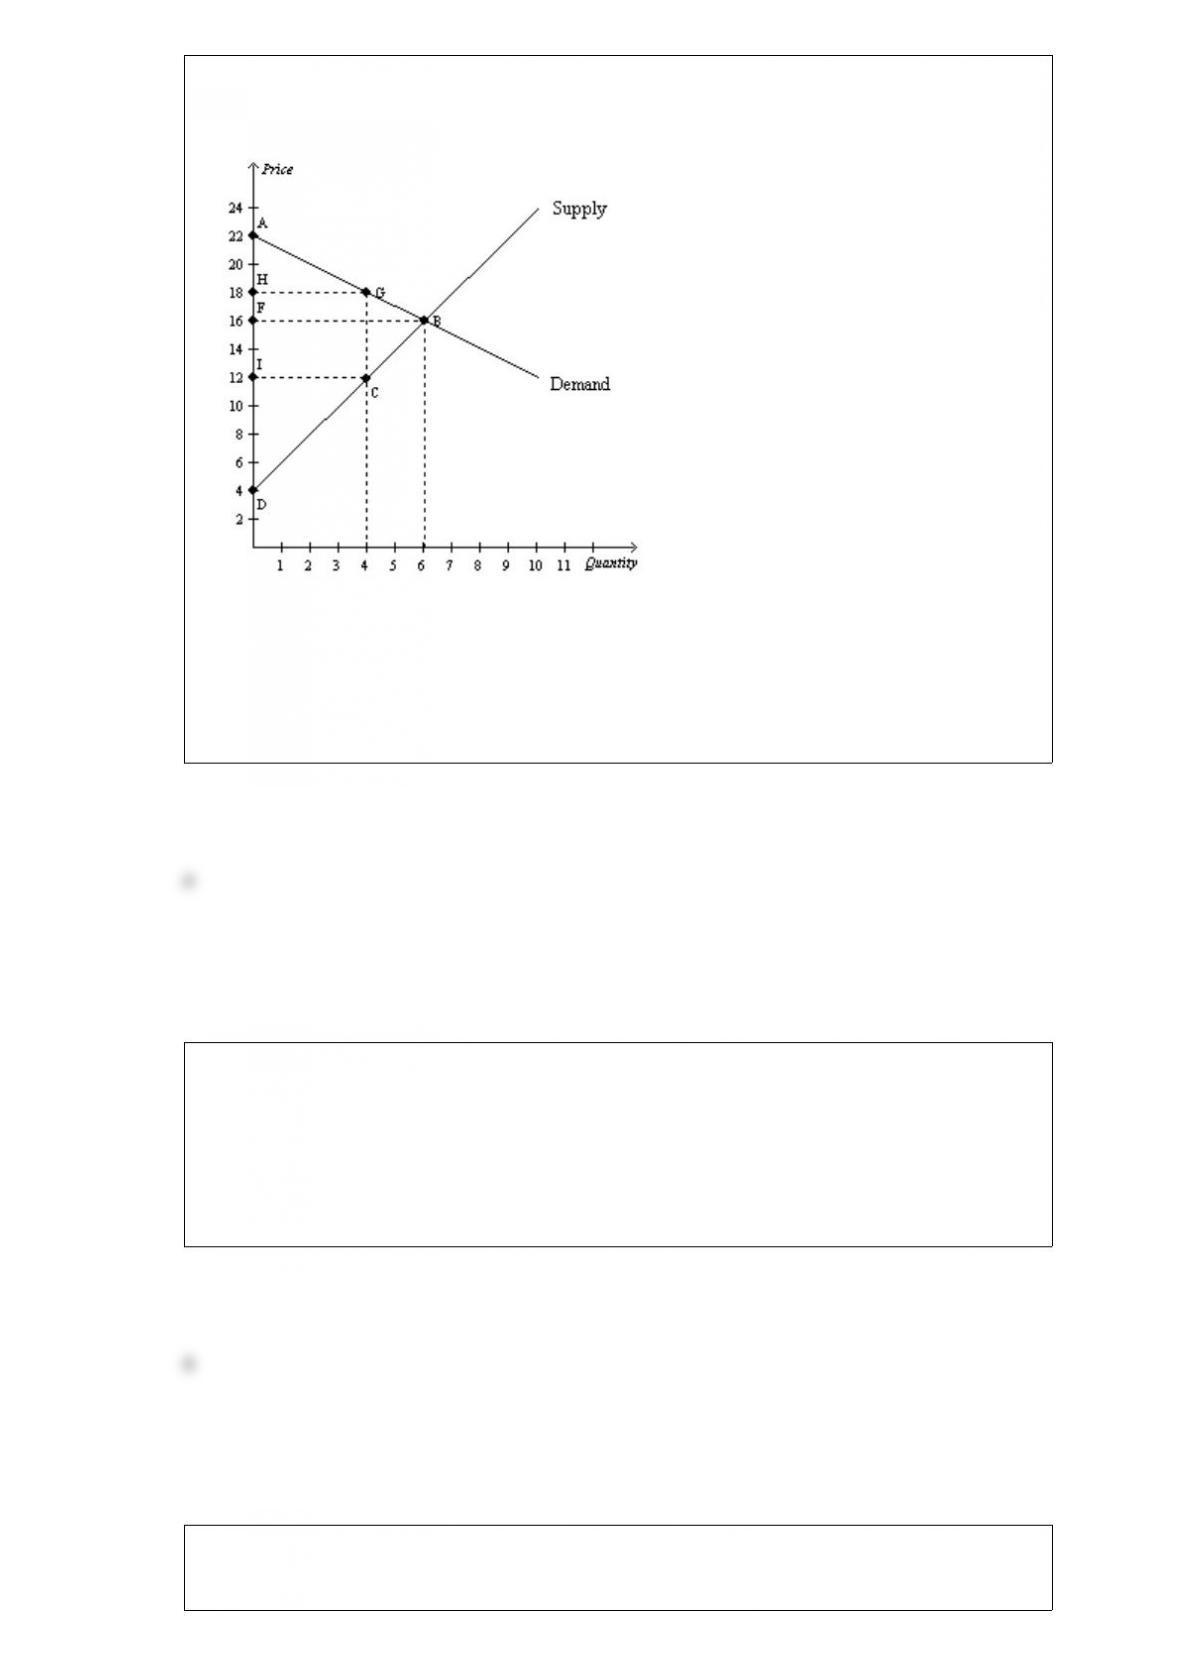
Figure 724
Refer to Figure 724. At equilibrium, consumer surplus is
a. $18.
b. $36.
c. $54.
d. $72.
The infantindustry argument
a. is based on the belief that protecting industries when they are young will pay off later.
b. is based on the belief that protecting industries producing goods and services for
infants is necessary if a country is to have healthy children.
c. has the support of most economists.
d. is an argument that is advanced by advocates of free trade.
A downwardsloping demand curve illustrates
a. that demand decreases over time.

b. that prices fall over time.
c. the relationship between income and quantity demanded.
d. the law of demand.
Consider Mandy’s decision to go to college. If she goes to college, she will spend
$20,000 on tuition, $10,000 on room and board, and $2,000 on books. If she does not
go to college, she will earn $18,000 working in a store and spend $8,000 on room and
board. Mandy’s cost of going to college is
a. $32,000.
b. $42,000.
c. $50,000.
d. $58,000.
The production possibilities frontier is a graph that shows the various combinations of
output that an economy can possibly produce given the available factors of production
and
a. society’s preferences.
b. the available production technology.
c. a fair distribution of the output.
d. the available demand for the output.
Druginterdiction policies that reduce the supply of illegal drugs may
a. be more effective in the long run than in the short run.

b. be best coupled with drugeducation programs designed to reduce demand.
c. increase drugrelated crimes.
d. All of the above are correct.
When you calculate your true costs of going to college, what portion of your
roomandboard expenses should be included?
a. Your full roomandboard expenses should always be included.
b. None of your roomandboard expenses should ever be included.
c. You should include only the amount by which your roomandboard expenses exceed
the income you earn while attending college.
d. You should include only the amount by which your roomandboard expenses exceed
the expenses for rent and food if you were not in college.
A direct or positive relationship exists between a country’s
a. productivity and its standard of living.
b. amount of government spending and its productivity.
c. total population and its average citizen’s income.
d. rate of population growth and the extent of its trade with other countries.
Table 59
Supply Curve ASupply Curve BSupply Curve C
Price $1.00 $2.00 $1.00 $3.00$2.00 $5.00
Quantity Supplied 500 600 600 900 400 700
Refer to Table 59. Along which of the supply curves does quantity supplied move
proportionately more than the price?
a. along supply curve B only
b. along supply curves B and C
c. along all three supply curves
d. None. Quantity supplied moves proportionately less than the price along all of the
three supply curves.
It does not matter whether a tax is levied on the buyers or the sellers of a good because
a. sellers always bear the full burden of the tax.
b. buyers always bear the full burden of the tax.
c. buyers and sellers will share the burden of the tax.
d. None of the above is correct; the incidence of the tax does depend on whether the
buyers or the sellers are required to pay the tax.
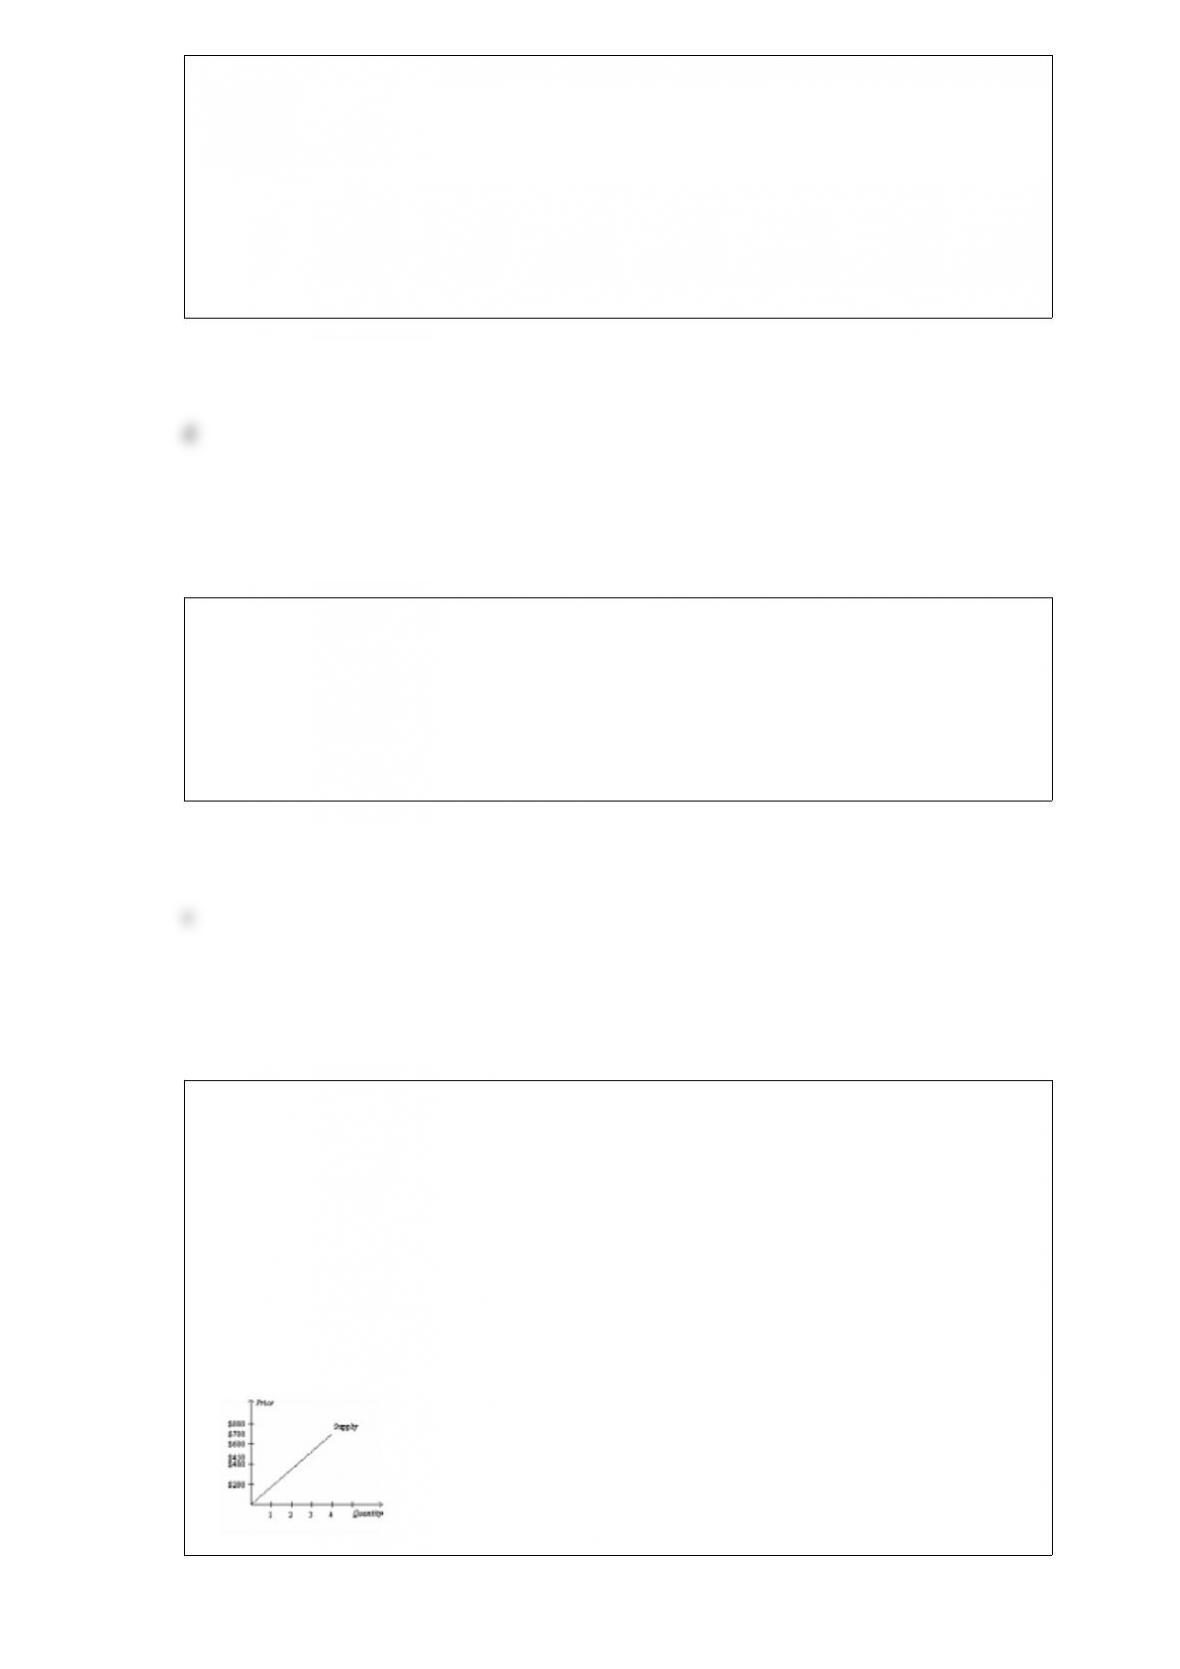
Table 714
SellerCost
LeBron$700
Kobe$600
Kevin$450
Steve$400
Refer to Table 714. You want to hire a professional photographer to take pictures of
your family. The table shows the costs of the four potential sellers in the local
photography market. Which of the following graphs represents the market supply
curve?
a.
b.
c.
d.
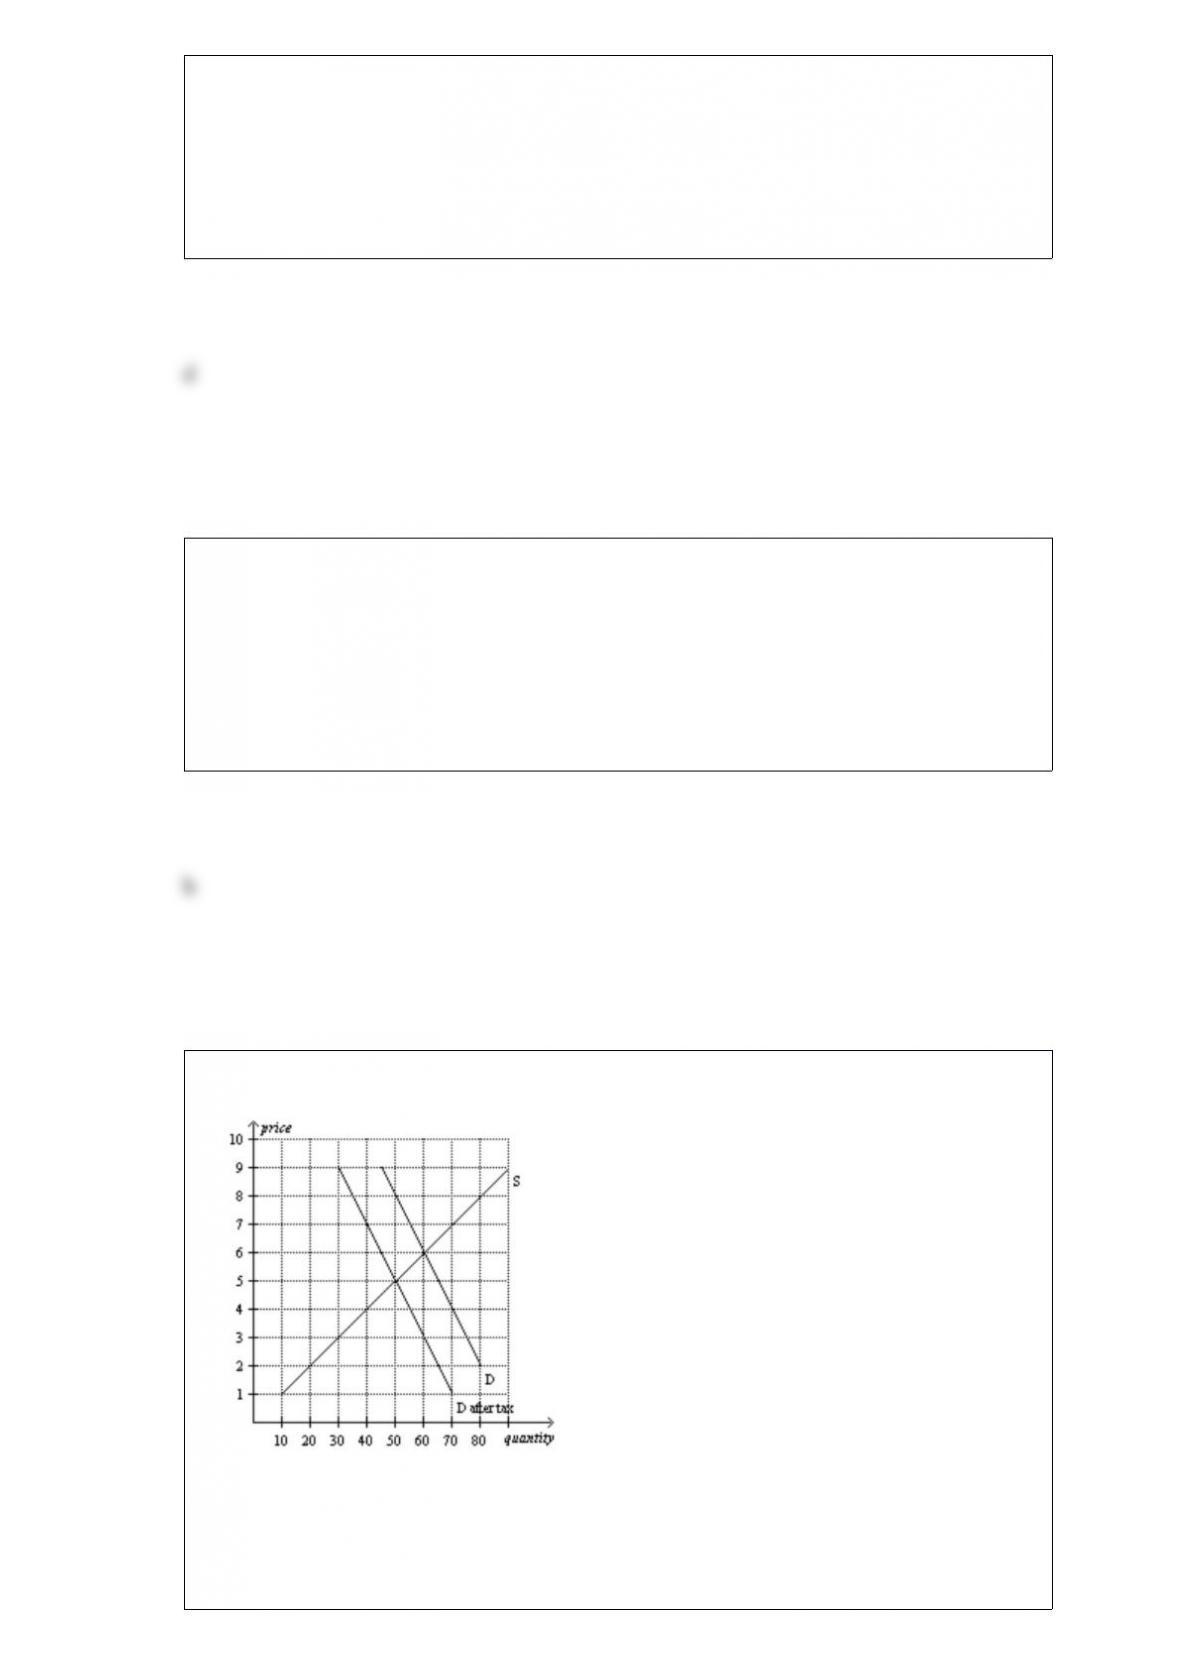
Figure 626
Refer to Figure 626. The price paid by buyers after the tax is imposed is
a. $8.
b. $16.
c. $14.
d. $12.
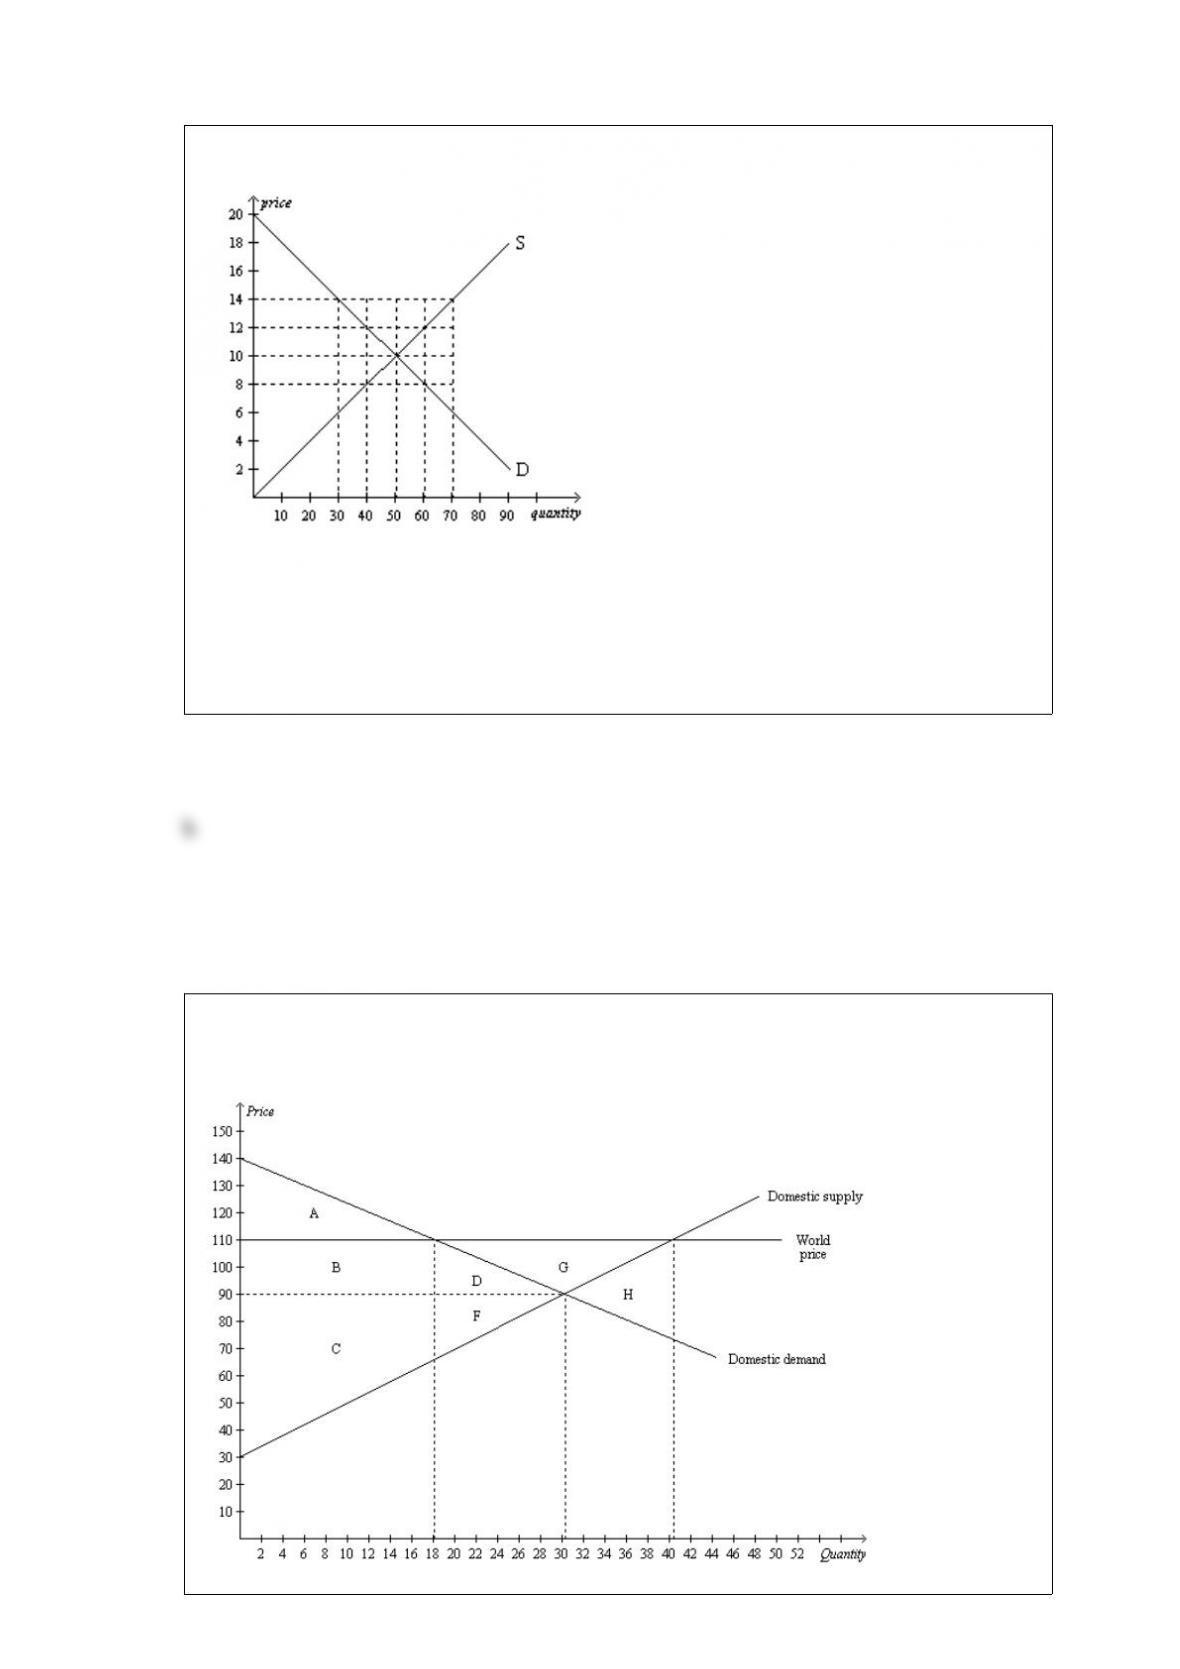
Figure 419
Refer to Figure 419. In this market, equilibrium price and quantity, respectively, are
a. $10 and 30 units.
b. $10 and 50 units.
c. $10 and 70 units.
d. $4 and 50 units.
Figure 91
The figure illustrates the market for coffee in Guatemala.
Refer to Figure 91. In the absence of trade, total surplus in the Guatemalan coffee
market amounts to
a. 750.
b. 1,100.
c. 1,514.
d. 1,650.
Suppose a nation is currently producing at a point inside its production possibilities
frontier. We know that
a. the nation is producing beyond its capacity, so inflation will occur.
b. the nation is not using all available resources or is using inferior technology or both.
c. the nation is producing an efficient combination of goods.
d. there will be a large opportunity cost if the nation tries to increase production of any
good.
Figure 625
Refer to Figure 625. The amount of the tax per unit is
a. $1.
b. $1.50.
c. $2.

d. $3.
Assume, for Japan, that the domestic price of automobiles without international trade is
lower than the world price of automobiles. This suggests that, in the production of
automobiles,
a. Japan has a comparative advantage over other countries and Japan will import
automobiles.
b. Japan has a comparative advantage over other countries and Japan will export
automobiles.
c. other countries have a comparative advantage over Japan and Japan will import
automobiles.
d. other countries have a comparative advantage over Japan and Japan will export
automobiles.
Table 326
Assume that Japan and Korea can switch between producing cars and producing
airplanes at a constant rate.
Hours Needed to Make 1Quantity Produced in 2400 Hours
CarAirplaneCarsAirplanes
Japan301508016
Korea501504816
Refer to Table 326. Suppose Japan decides to increase its production of cars by 45.
What is the opportunity cost of this decision?
a. 9 airplanes
b. 15 airplanes
c. 135 airplanes
d. 225 airplanes

An increase in the price of cheese crackers from $2.25 to $2.45 per box causes suppliers
of cheese crackers to increase their quantity supplied from 125 boxes per minute to 145
boxes per minute. Using the midpoint method, supply is
a. elastic, and the price elasticity of supply is 1.74.
b. elastic, and the price elasticity of supply is 0.57.
c. inelastic, and the price elasticity of supply is 1.74.
d. inelastic, and the price elasticity of supply is 0.57.
Other things equal, the demand for a good tends to be more inelastic, the
a. fewer the available substitutes.
b. longer the time period considered.
c. more the good is considered a luxury good.
d. more narrowly defined is the market for the good.
The highest form of competition is called
a. absolute competition.
b. cutthroat competition.
c. perfect competition.
d. market competition.
Collegeage athletes who drop out of college to play professional sports
a. are not rational decision makers.
b. are well aware that their opportunity cost of attending college is very high.
c. are concerned more about present circumstances than their future.
d. underestimate the value of a college education.
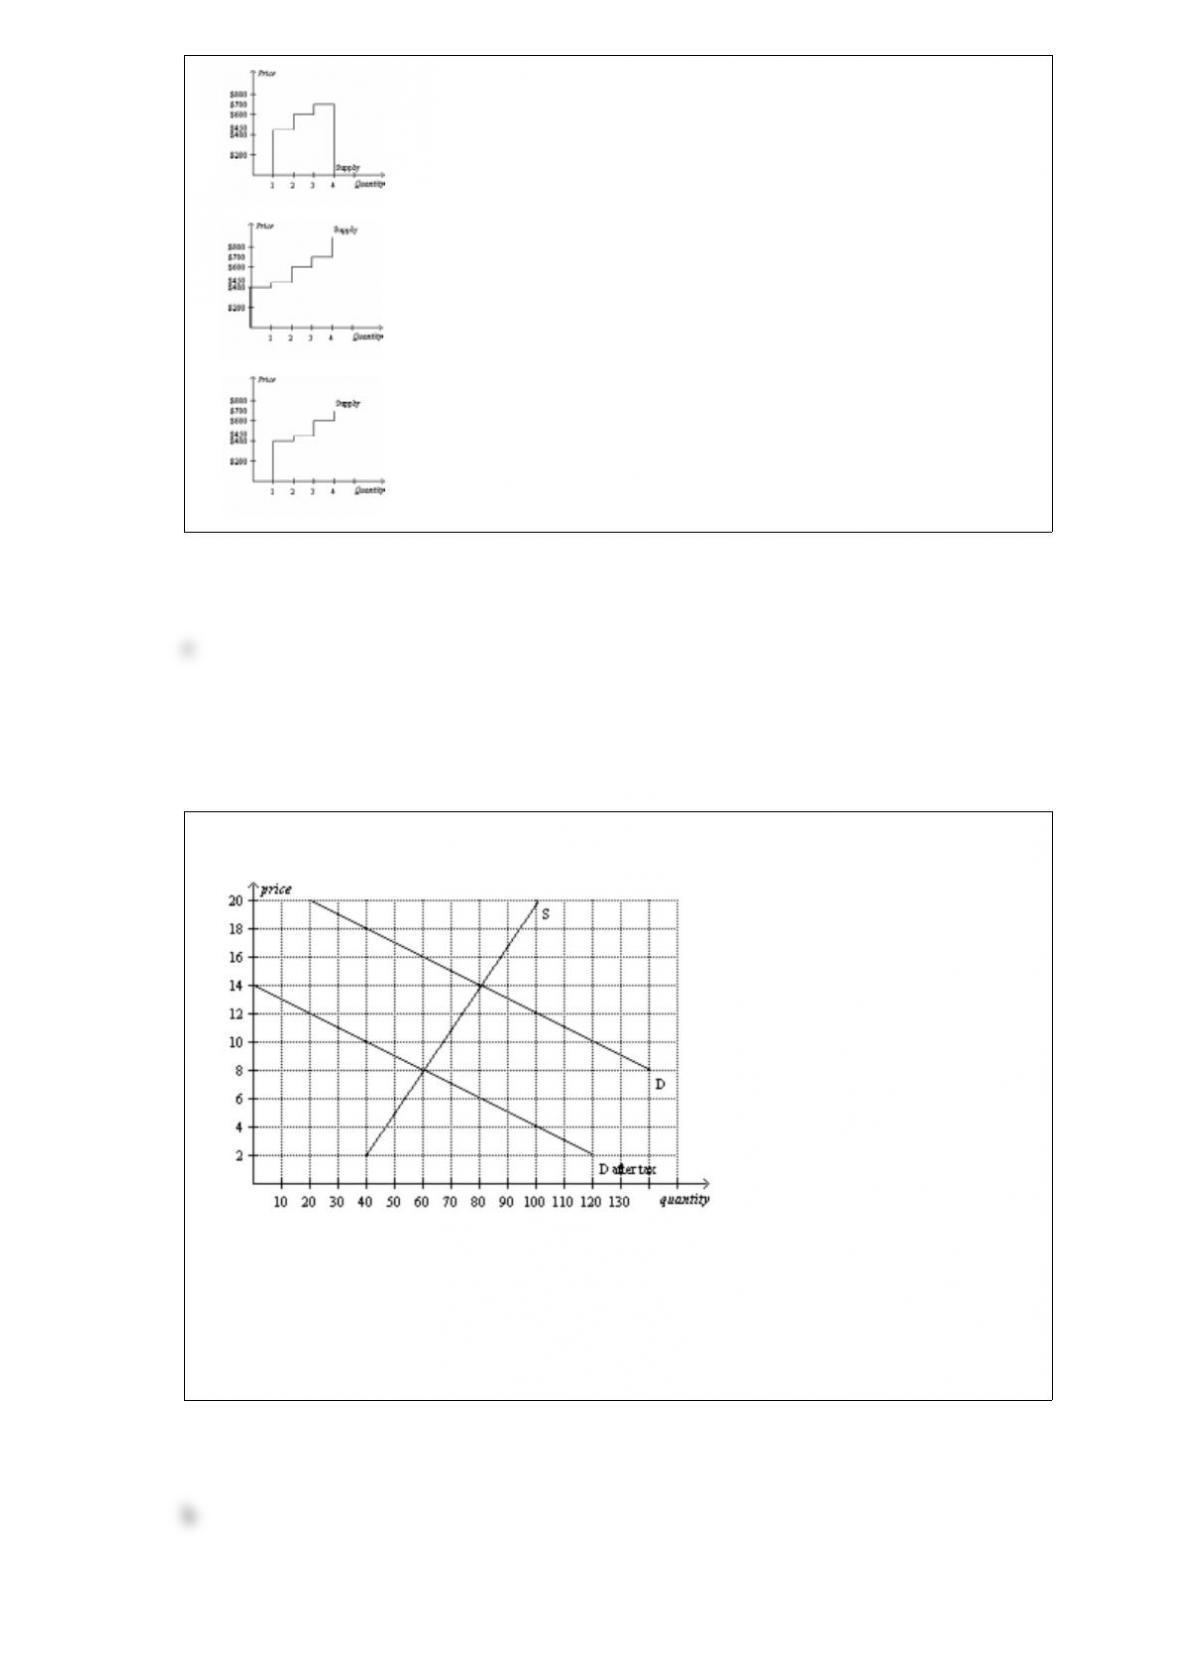
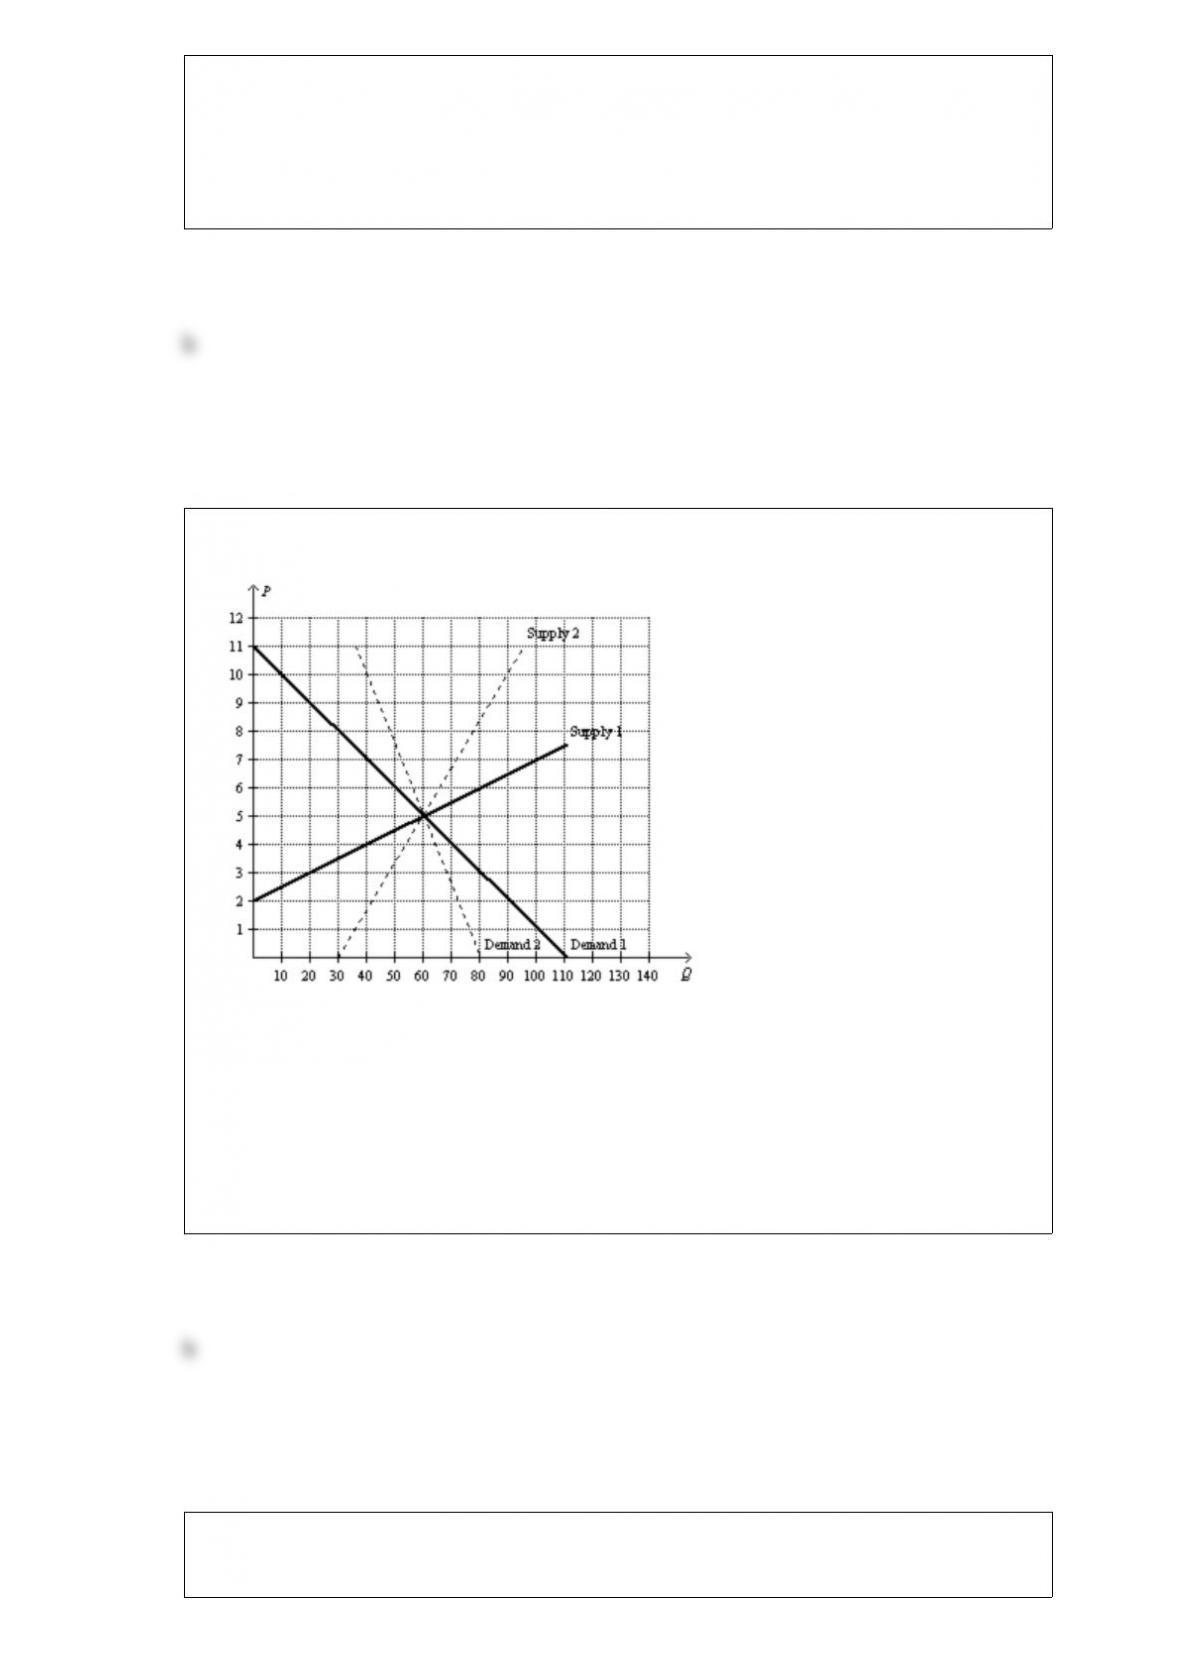
Figure 821
Refer to Figure 821. Suppose the market is represented by Demand 1 and Supply 1. At
first the government places a $3 perunit tax on this good. Then the government decides
to raise the tax to $6 per unit. Compared to the original tax rate, the higher tax will
a. increase tax revenue and increase the deadweight loss from the tax.
b. not change tax revenue and increase the deadweight loss from the tax.
c. decrease tax revenue and increase the deadweight loss from the tax.
d. decrease tax revenue and decrease the deadweight loss from the tax.
Who said, “The whole of science is nothing more than the refinement of everyday
thinking”?

a. Isaac Newton
b. Albert Einstein
c. Adam Smith
d. Benjamin Franklin
Table 329
Juanita and Shantala run a business that programs and tests cellular phones. Assume
that Juanita and Shantala can switch between programming and testing cellular phones
at a constant rate. The following table applies.
Minutes Needed to Number of Cellular Phones Programmed or Tested in a 40Hour
Week
Program 1 Cellular PhoneTest 1 Cellular PhoneCellular Phones ProgrammedCellular
Phones Tested
Juanita ?21601200
Shantala104240600
Refer to Table 329. Juanita’s opportunity cost of testing one cellular phone is
programming
a. 0.133 cellular phones and Shantala’s opportunity cost of testing one cellular phone is
programming 2.5 cellular phones.
b. 0.133 cellular phones and Shantala’s opportunity cost of testing one cellular phone is
programming 0.4 cellular phones.
c. 7.5 cellular phones and Shantala’s opportunity cost of testing one cellular phone is
programming 2.5 cellular phones.
d. 7.5 cellular phones and Shantala’s opportunity cost of testing one cellular phone is
programming 0.4 cellular phones.
Figure 81
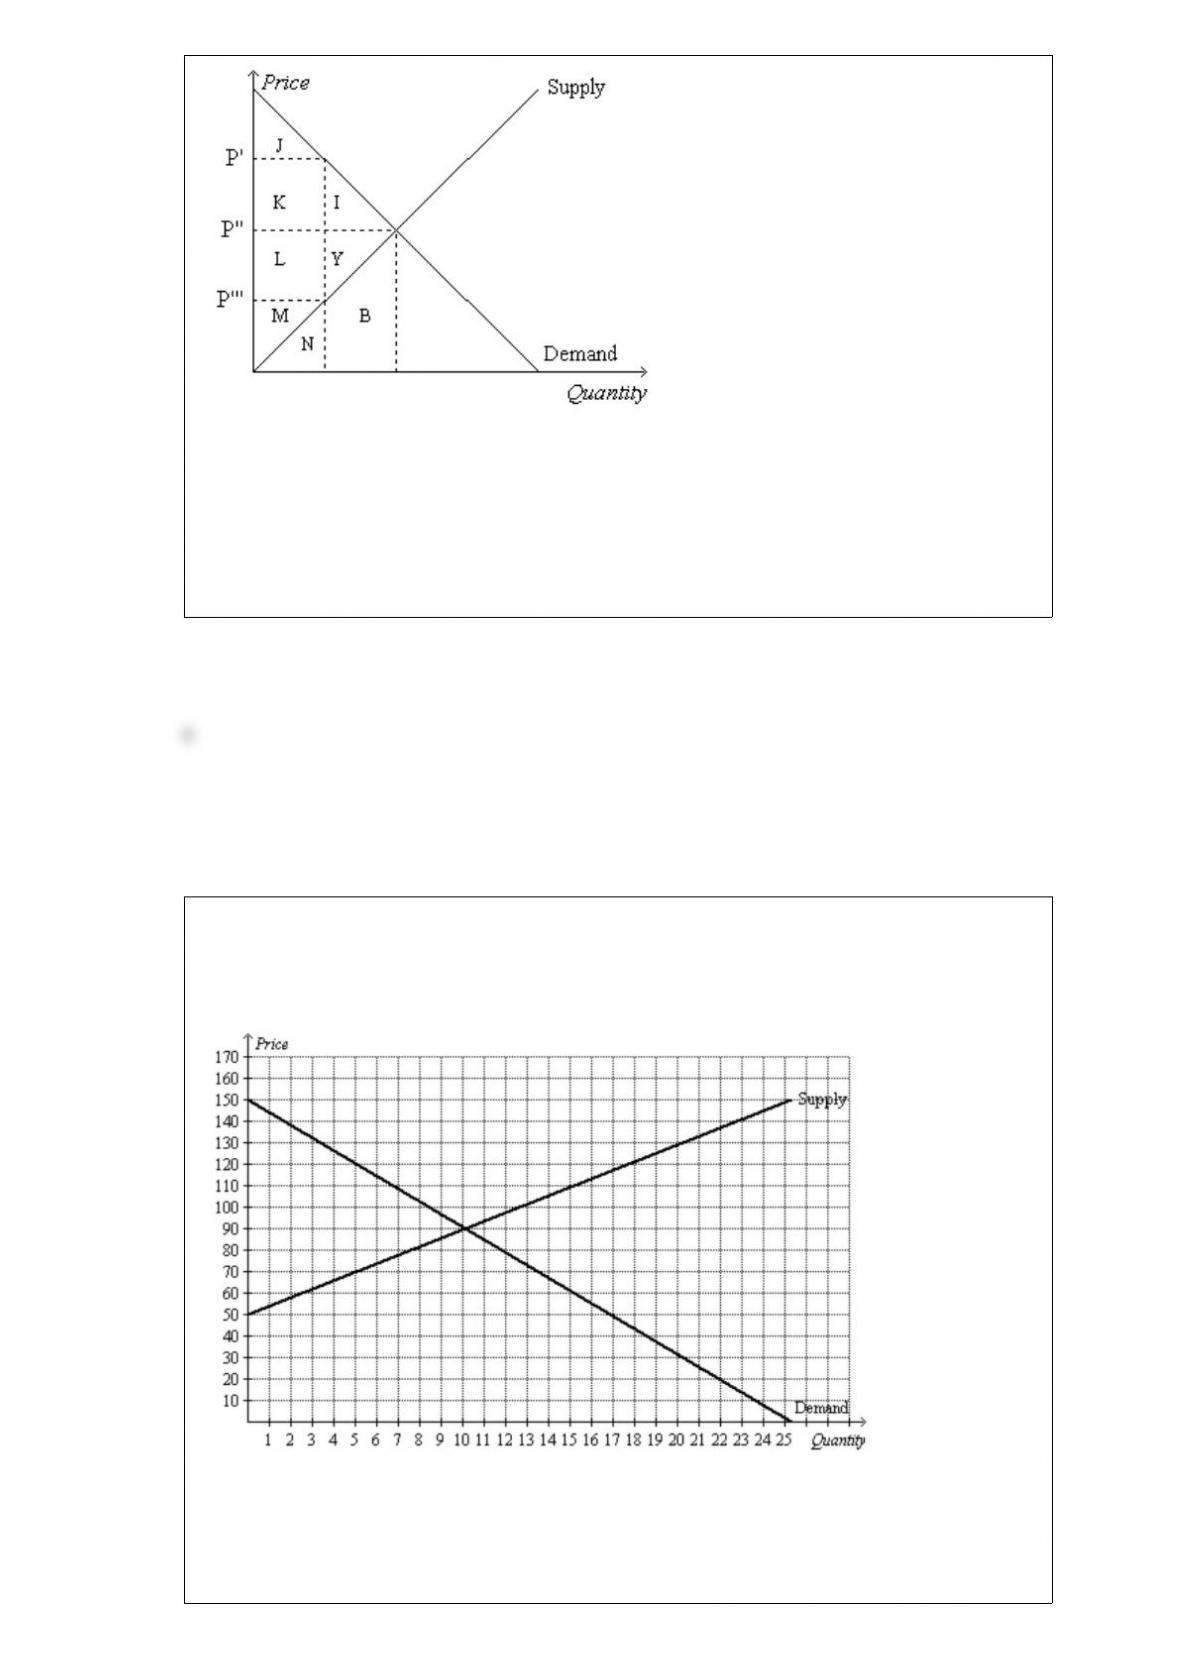
Refer to Figure 81. Suppose the government imposes a tax of P’ P”’. The area measured
by M represents
a. consumer surplus after the tax.
b. consumer surplus before the tax.
c. producer surplus after the tax.
d. producer surplus before the tax.
Figure 923
The following diagram shows the domestic demand and domestic supply for a market.
Assume that the world price in this market is $120 per unit.
Refer to Figure 923. Producer surplus with free trade is
a. $200.
b. $450.
c. $630.
d. $1,080
For which of the following problems can welldesigned public policy enhance economic
efficiency?
a. both externalities and market power
b. externalities, but not market power
c. market power, but not externalities
d. neither externalities nor market power
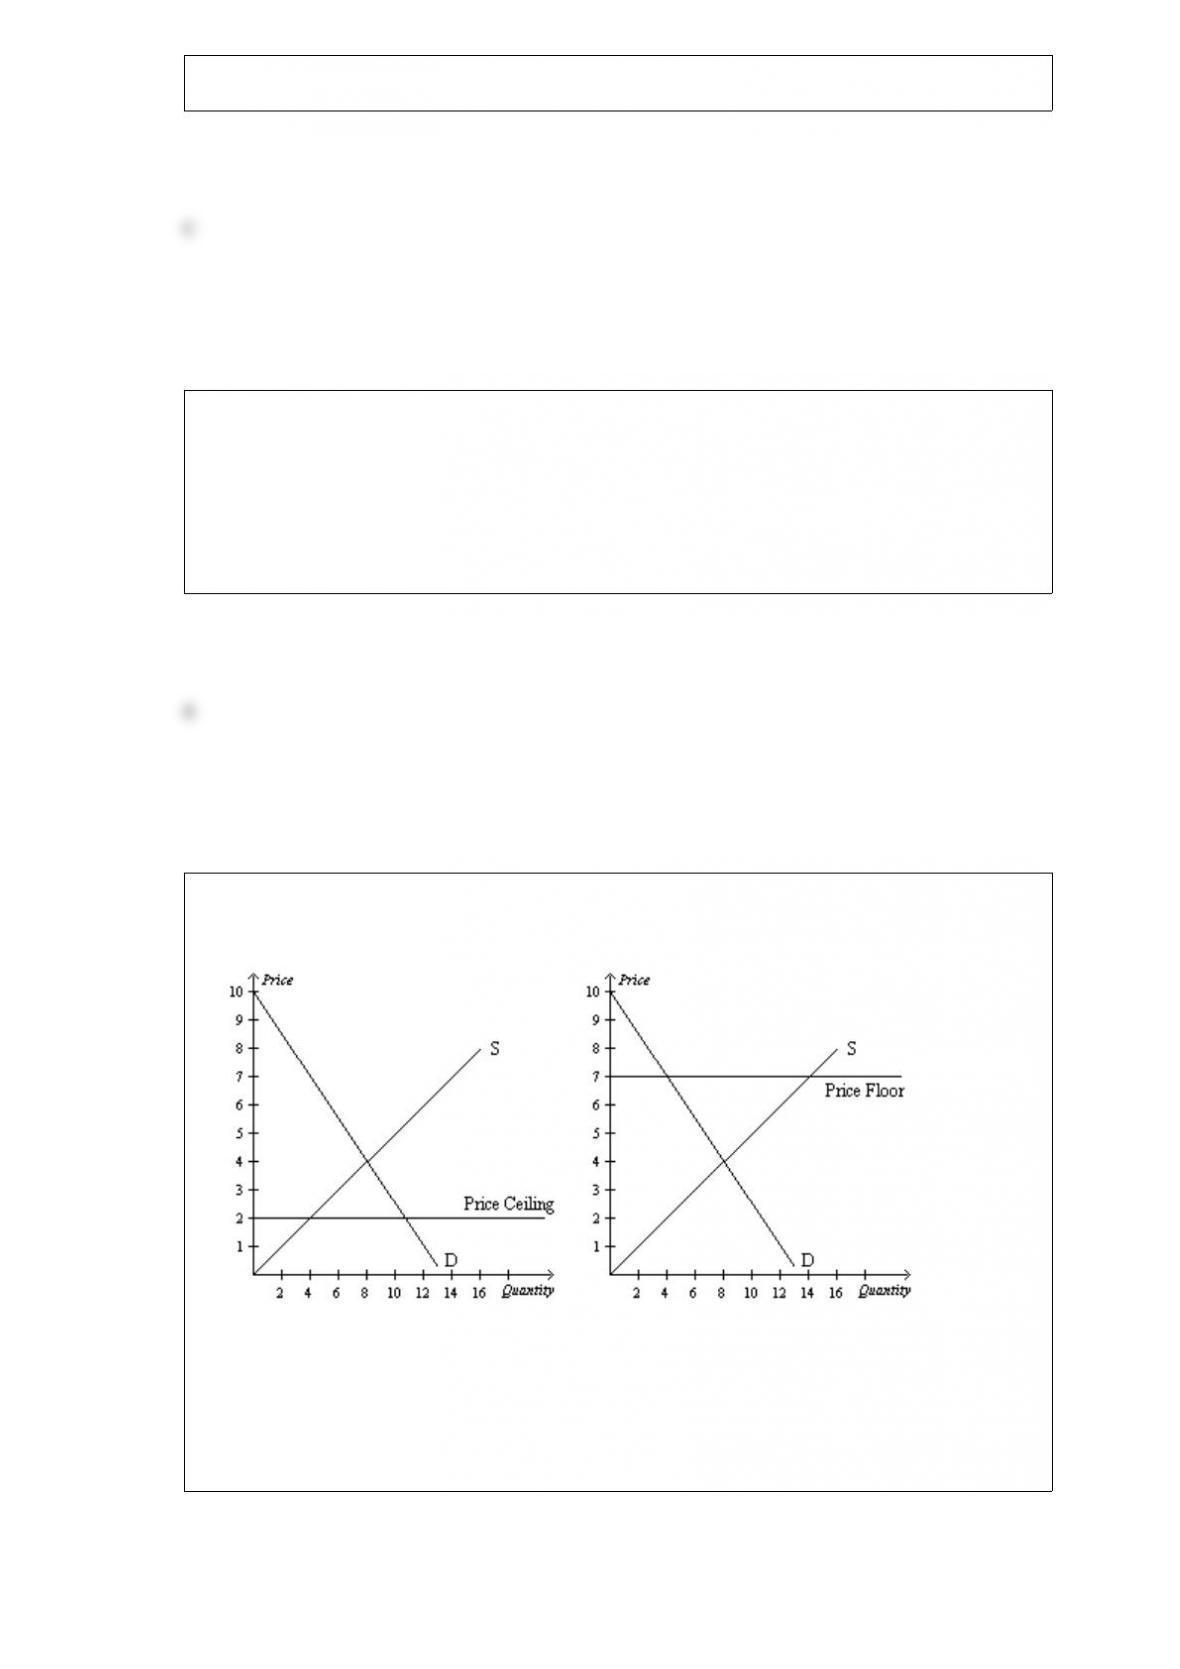
Figure 63
Panel (a)Panel (b)
Refer to Figure 63. In panel (a), there will be
a. a shortage.
b. equilibrium in the market.
c. a surplus.
d. lines of people waiting to buy the good.
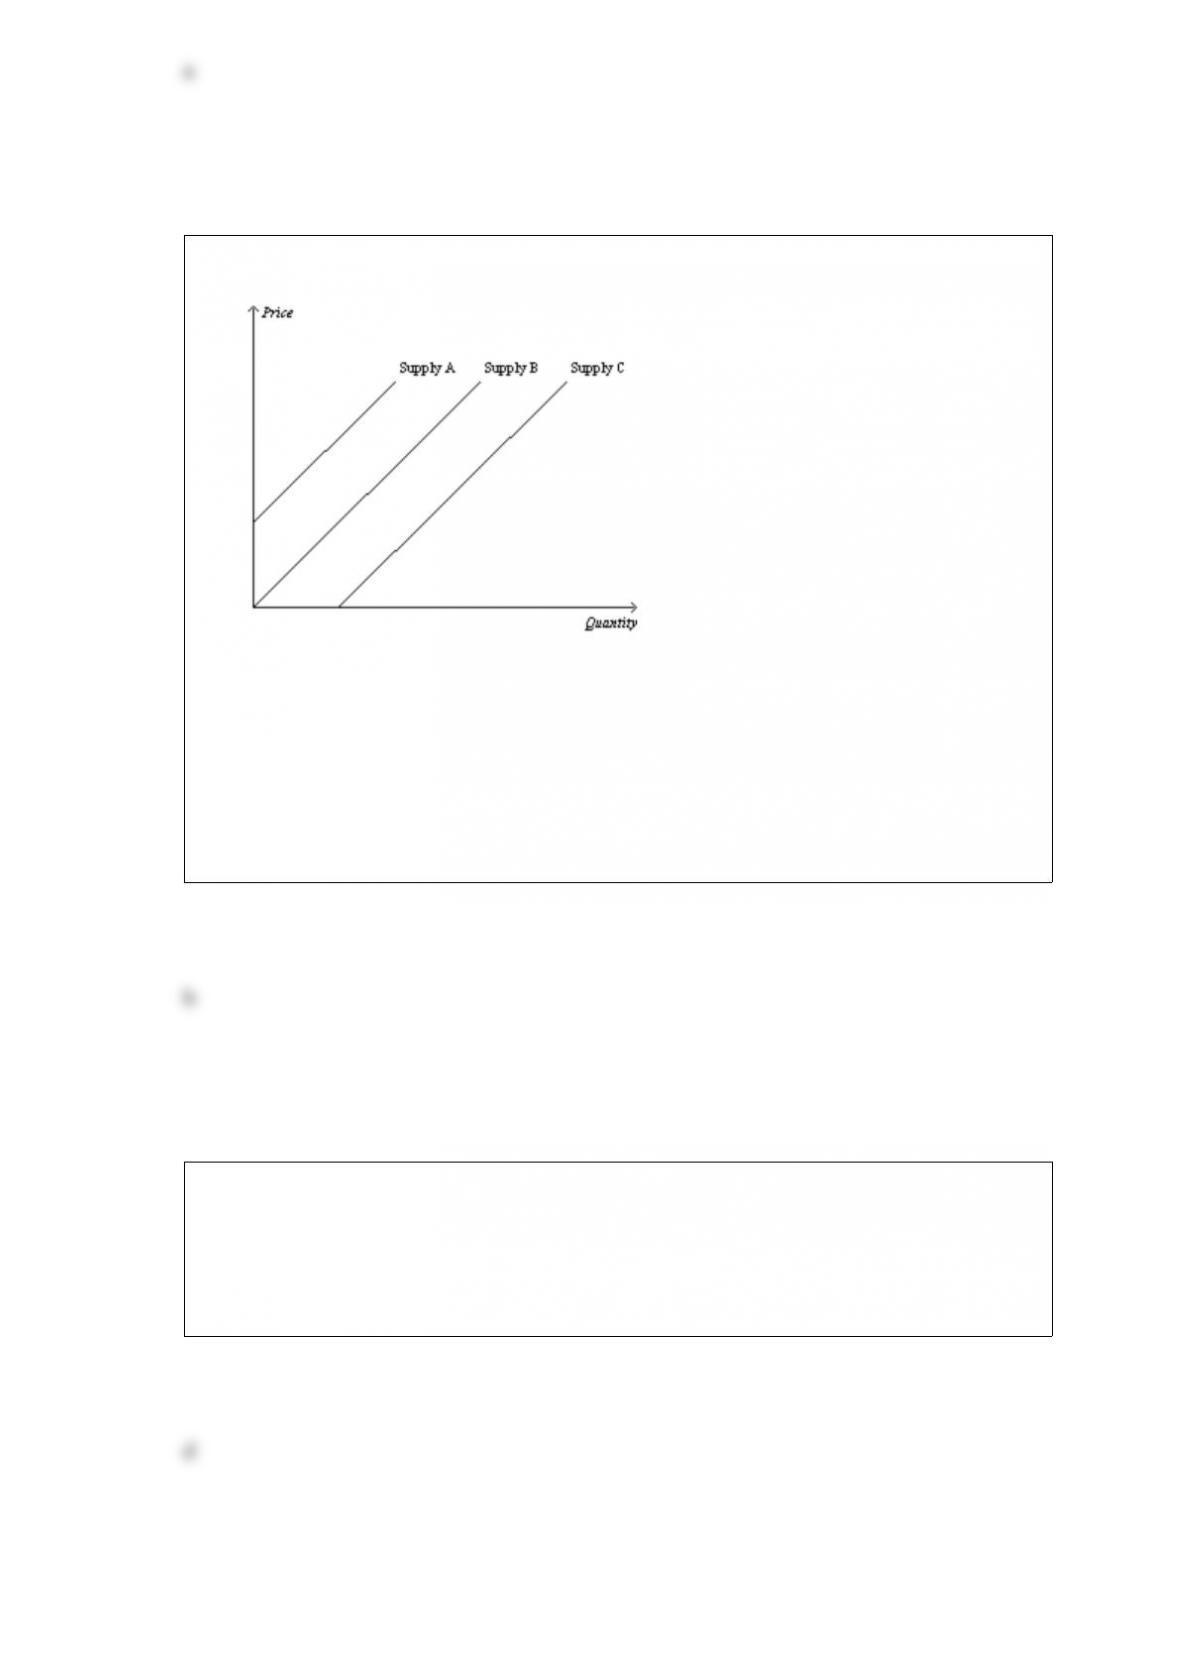
Figure 415
Refer to Figure 415. Which of the following would cause the supply curve to shift
from Supply B to Supply A in the market for beer?
a. a decrease in the price of beer
b. an expectation by firms that the price of beer will increase in the very near future
c. a decrease in the price of hops
d. an improvement in technology that allows firms to use less labor in the production of
beer
A decrease in supply is represented by a
a. movement downward and to the left along a supply curve.
b. movement upward and to the right along a supply curve.
c. rightward shift of a supply curve.
d. leftward shift of a supply curve.

If a shortage exists in a market, then we know that the actual price is
a. above the equilibrium price, and quantity supplied is greater than quantity demanded.
b. above the equilibrium price, and quantity demanded is greater than quantity supplied.
c. below the equilibrium price, and quantity demanded is greater than quantity supplied.
d. below the equilibrium price, and quantity supplied is greater than quantity demanded.
The slope of a line that passes through the points (20, 30) and (40, 14) is
a. 5/4.
b. 4/5.
c. 4/5.
d. 5/4.
Income elasticity of demand measures how
a. the quantity demanded changes as consumer income changes.
b. consumer purchasing power is affected by a change in the price of a good.
c. the price of a good is affected when there is a change in consumer income.
d. many units of a good a consumer can buy given a certain income level.