
If Iowa’s opportunity cost of corn is lower than Oklahoma’s opportunity cost of corn,
then
a. Iowa has a comparative advantage in the production of corn.
b. Iowa has an absolute advantage in the production of corn.
c. Iowa should import corn from Oklahoma.
d. Oklahoma should produce just enough corn to satisfy its own residents’ demands.
The “invisible hand” refers to
a. the marketplace guiding the selfinterests of market participants into promoting
general economic wellbeing.
b. the fact that social planners sometimes have to intervene, even in perfectly
competitive markets, to make those markets more efficient.
c. the equality that results from market forces allocating the goods produced in the
market.
d. the automatic maximization of consumer surplus in free markets.
If the government were to intervene and set a wage for unskilled labor above the market
wage, then we would expect, relative to the market outcome,
a. an increase in the number of unskilled jobs available.
b. a decrease in the number of unskilled jobs available.
c. a decrease in the number of workers wanting unskilled jobs.
d. None of the above is correct.
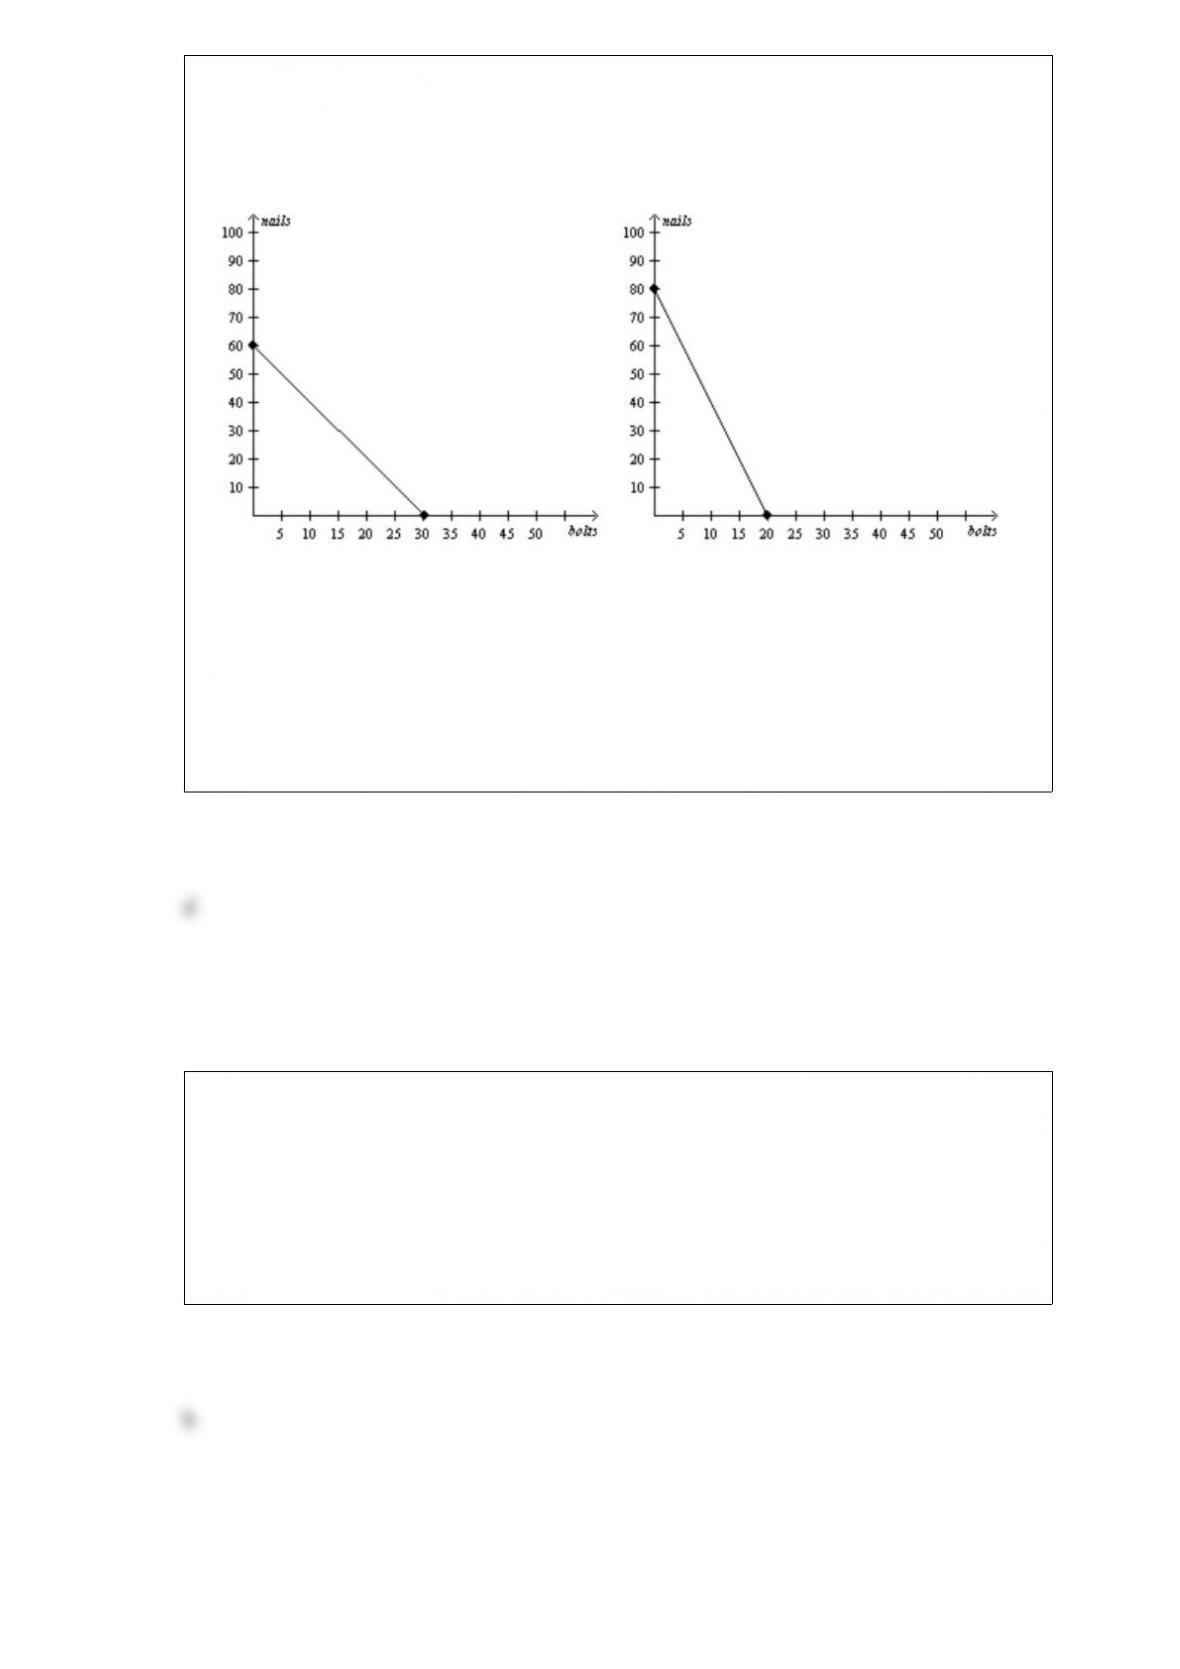
Figure 321
Uzbekistan’s Production Possibilities FrontierAzerbaijan’s Production Possibilities
Frontier
Refer to Figure 321. If Uzbekistan and Azerbaijan each spends all its time producing
the good in which it has a comparative advantage and trade takes place at a price of 12
bolts for 36 nails, then
a. neither Uzbekistan nor Azerbaijan will gain from this trade.
b. Uzbekistan will gain from this trade, but Azerbaijan will not.
c. Azerbaijan will gain from this trade, but Uzbekistan will not.
d. both Uzbekistan and Azerbaijan will gain from this trade.
Holding all other forces constant, if decreasing the price of a good leads to a decrease in
total revenue, then the demand for the good must be
a. unit elastic.
b. inelastic.
c. elastic.
d. None of the above is correct because a price decrease never leads to an decrease in
total revenue.
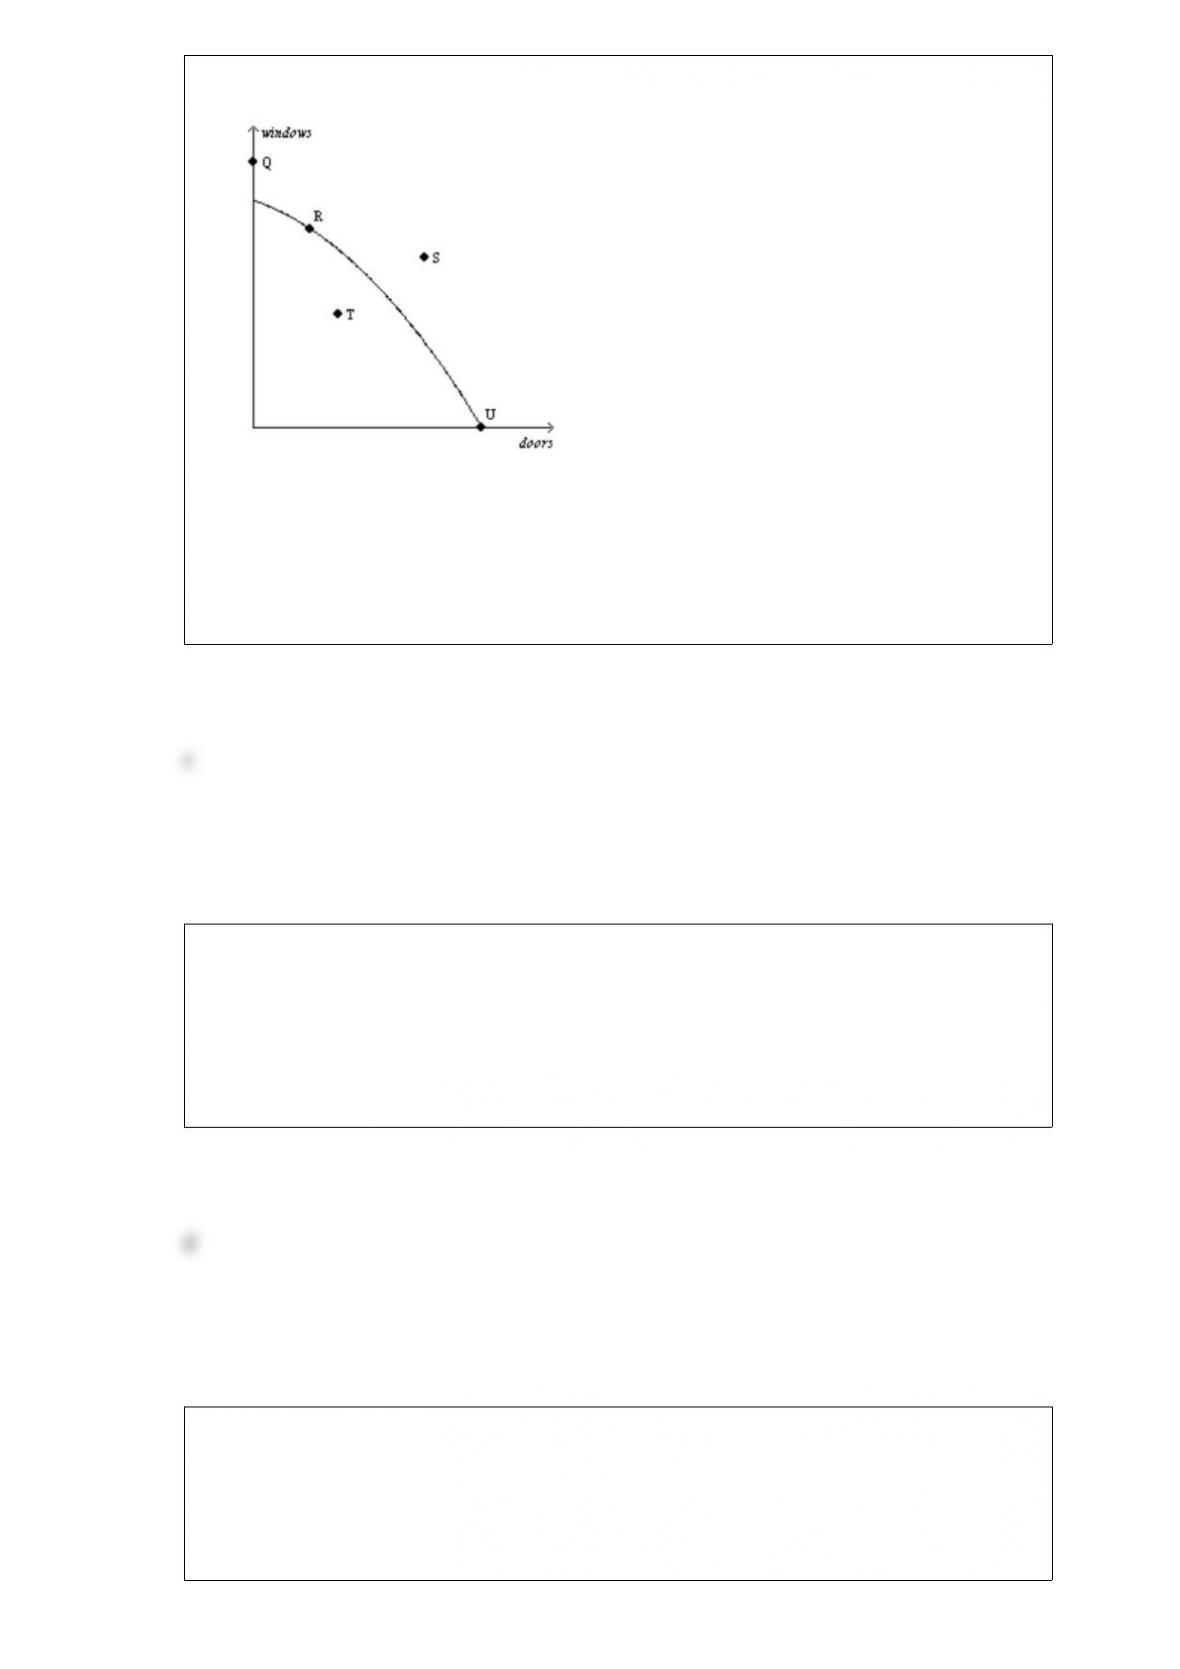
Figure 24
Refer to Figure 24. Efficient production is represented by which point(s)?
a. Q, R, U
b. R, T, U
c. R, U
d. S, T
The belief that tobacco is a “gateway drug” is consistent with
a. the idea that tobacco and marijuana are substitutes.
b. the idea that an increase in income causes a decrease in the demand for tobacco and
an increase in the demand for marijuana.
c. the idea that lower cigarette prices are associated with less use of marijuana.
d. most of the available evidence.
Economic models
a. cannot be useful if they are based on false assumptions.
b. were once thought to be useful, but that is no longer true.
c. must incorporate all aspects of the economy if they are to be useful.
d. can be useful, even if they are not particularly realistic.
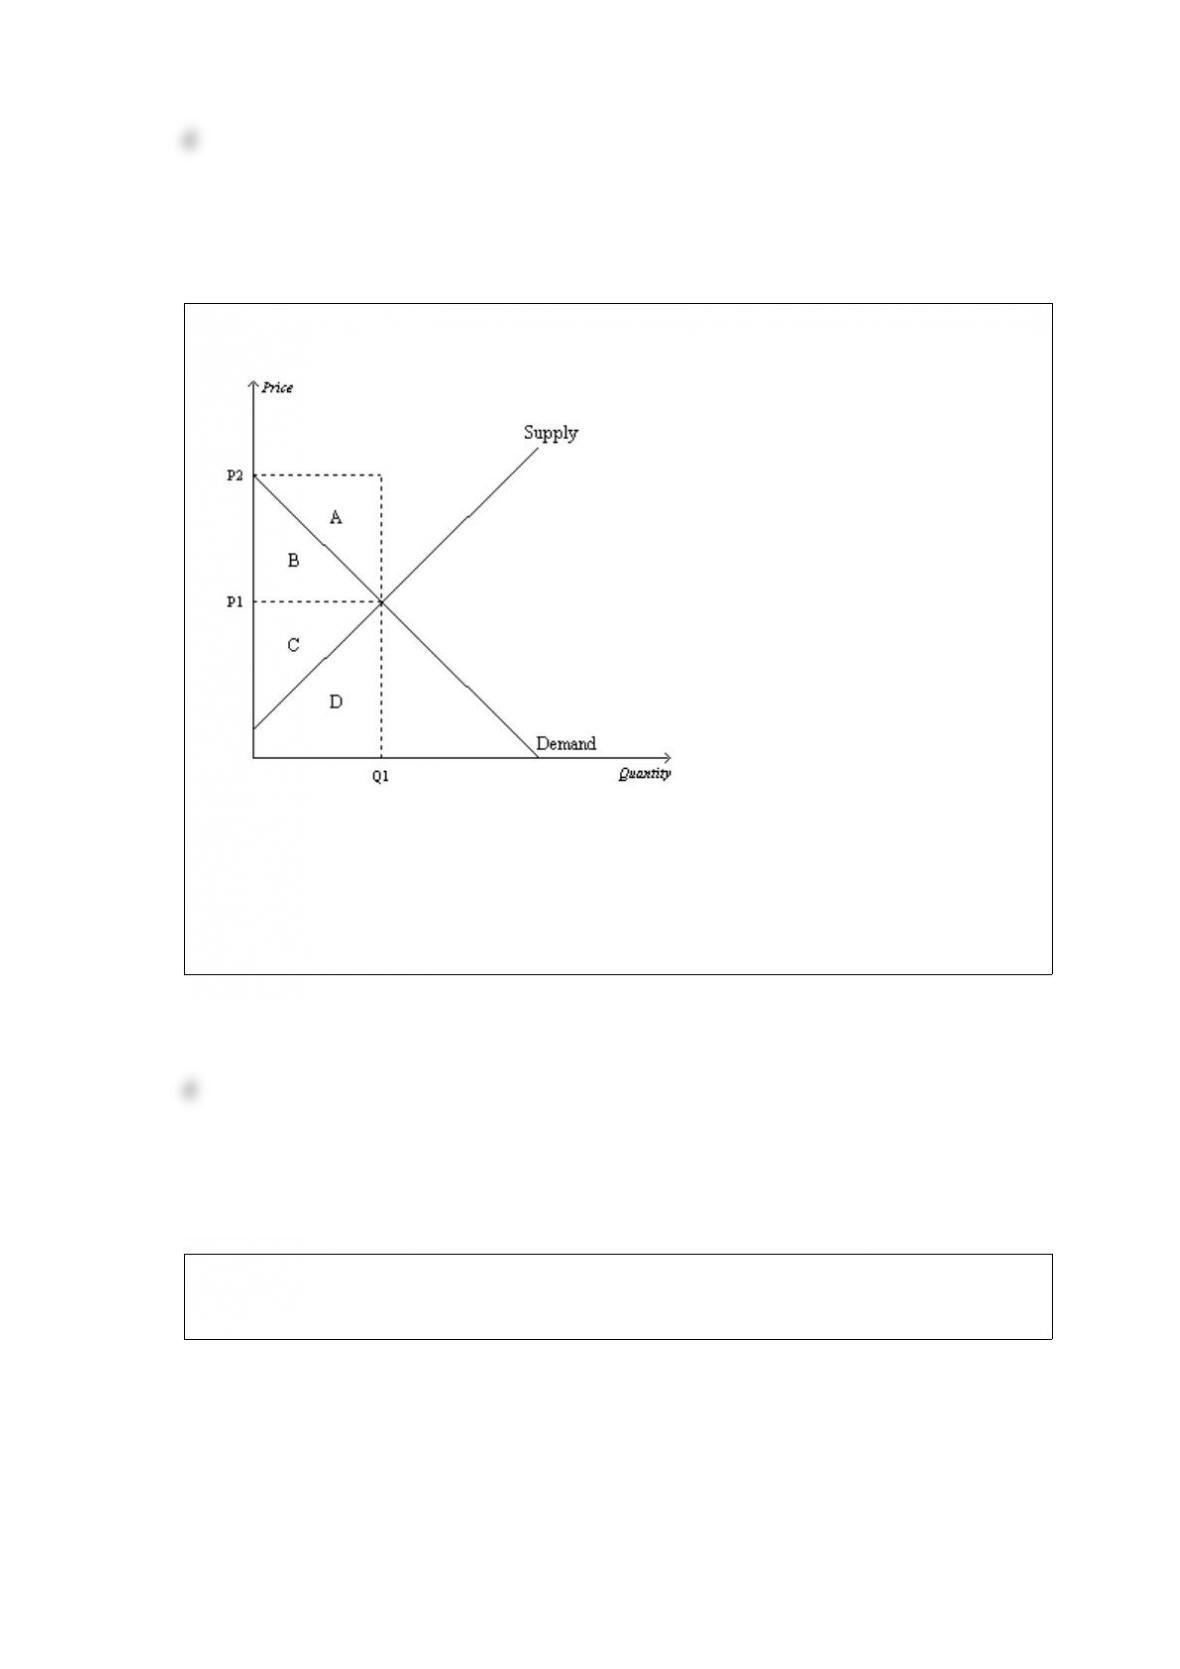
Figure 721
Refer to Figure 721. When the price is P1, area A represents
a. total benefit.
b. producer surplus.
c. consumer surplus.
d. None of the above is correct.
Figure 21
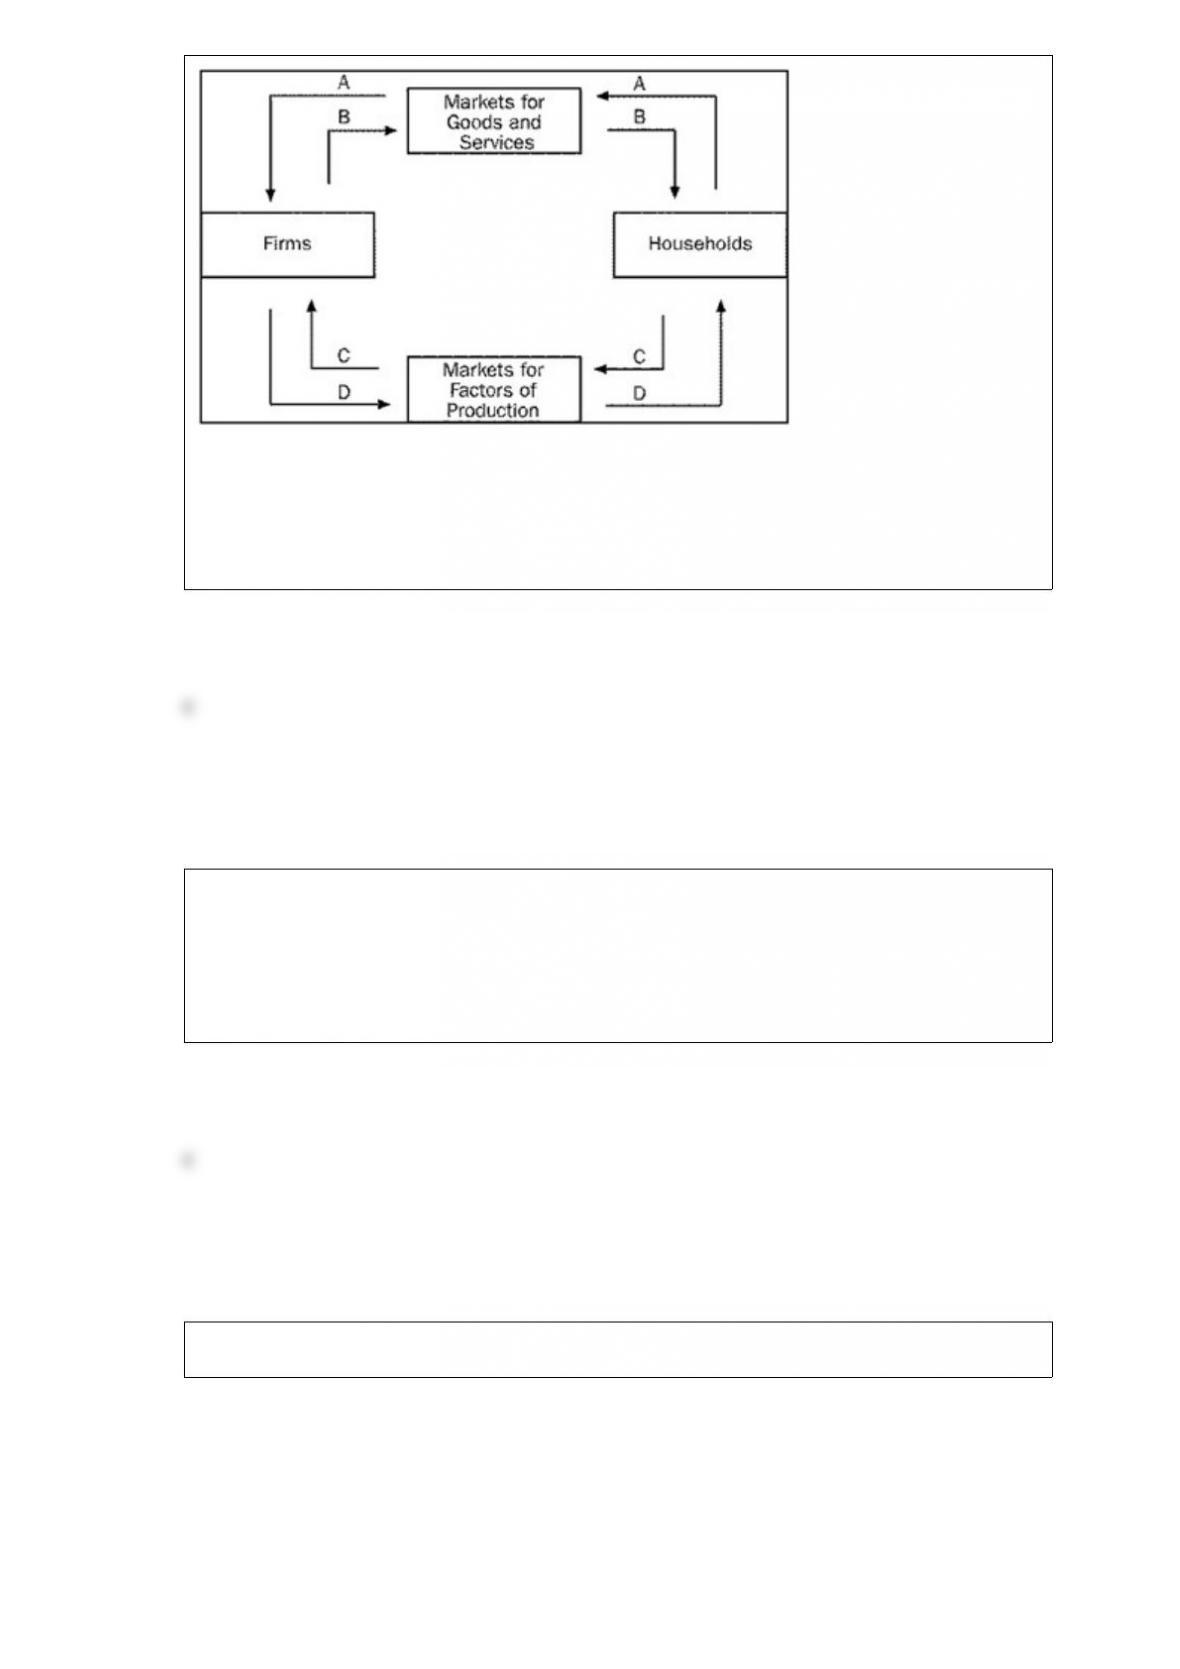
Refer to Figure 21. Which arrow represents the flow of land, labor, and capital?
a. A
b. B
c. C
d. D
A shortage results when a
a. nonbinding price ceiling is imposed on a market.
b. nonbinding price ceiling is removed from a market.
c. binding price ceiling is imposed on a market.
d. binding price ceiling is removed from a market.
Figure 721

Refer to Figure 721. When the price is P1, area B+C represents
a. total surplus.
b. producer surplus.
c. consumer surplus.
d. None of the above is correct.
A movement upward and to the left along a demand curve is called a(n)
a. increase in demand.
b. decrease in demand.
c. decrease in quantity demanded.
d. increase in quantity demanded.
Consumer surplus is
a. the amount a buyer is willing to pay for a good minus the amount the buyer actually
pays for it.
b. the amount a buyer is willing to pay for a good minus the cost of producing the good.
c. the amount by which the quantity supplied of a good exceeds the quantity demanded
of the good.

d. a buyer’s willingness to pay for a good plus the price of the good.
Suppose that a tax is placed on books. If the sellers pay the majority of the tax, then we
know that the
a. demand is more inelastic than the supply.
b. supply is more inelastic than the demand.
c. government has required that buyers remit the tax payments.
d. government has required that sellers remit the tax payments.
A production possibilities frontier is a straight line when
a. the more resources the economy uses to produce one good, the fewer resources it has
available to produce the other good.
b. an economy is interdependent and engaged in trade instead of selfsufficient.
c. the rate of tradeoff between the two goods being produced is constant.
d. the rate of tradeoff between the two goods being produced depends on how much of
each good is being produced.
Figure 726

Refer to Figure 726. At the equilibrium price, total surplus is
a. $600.
b. $1,200.
c. $1,500.
d. $1,800.
HTMLENTITY#8203HTMLENTITYWhich of the following industries has a marginal
cost that is close to zero?
a. HTMLENTITY#8203HTMLENTITYautomobile
b. HTMLENTITY#8203HTMLENTITYaircraft
c. HTMLENTITY#8203HTMLENTITYsoftware
d. HTMLENTITY#8203HTMLENTITYfurniture
Figure 211
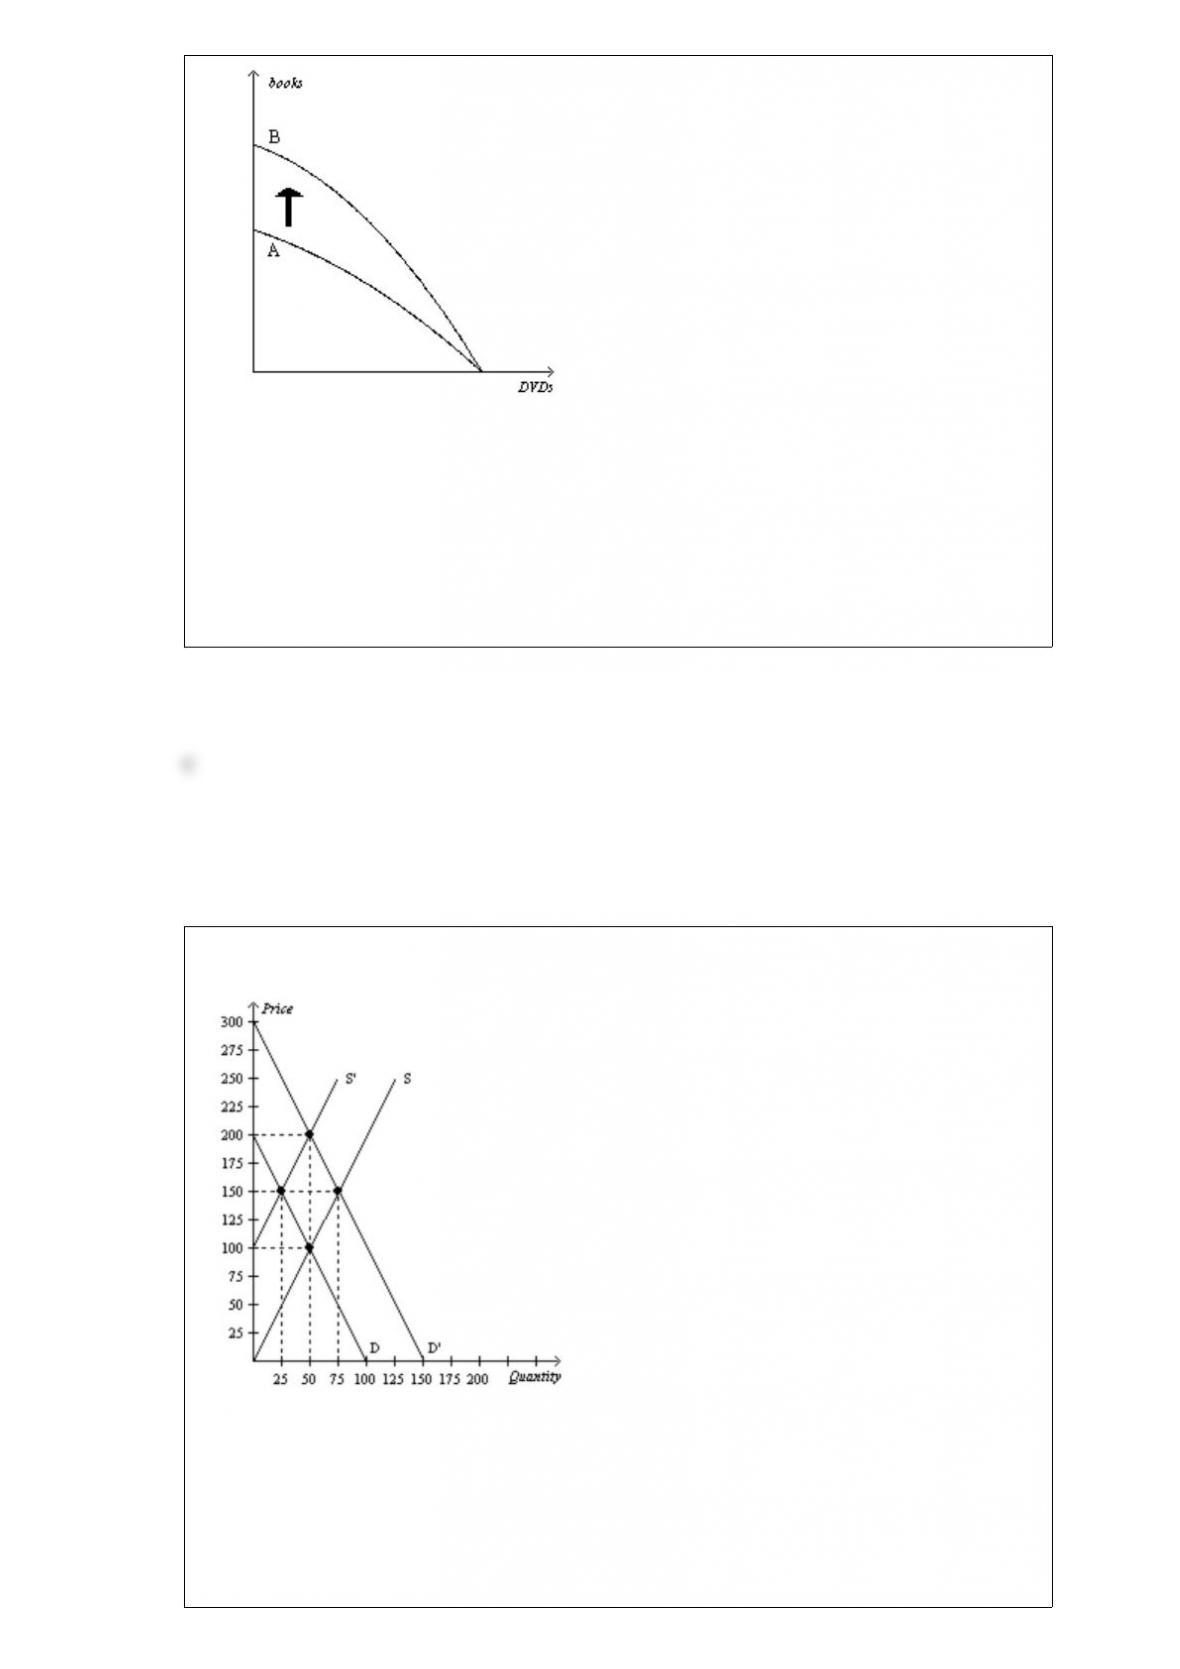
Refer to Figure 211. The shift of the production possibilities frontier from A to B
illustrates
a. simultaneous technological advances in the book and DVD industries.
b. a reallocation of resources away from the production of DVDs and toward the
production of books.
c. economic growth.
d. All of the above are correct.
Figure 711
Refer to Figure 711. If the supply curve is S and the demand curve shifts from D to D’,
what is the change in producer surplus?
a. Producer surplus increases by $3,125.
b. Producer surplus increases by $5,625.
c. Producer surplus decreases by $3,125.
d. Producer surplus decreases by $5,625.
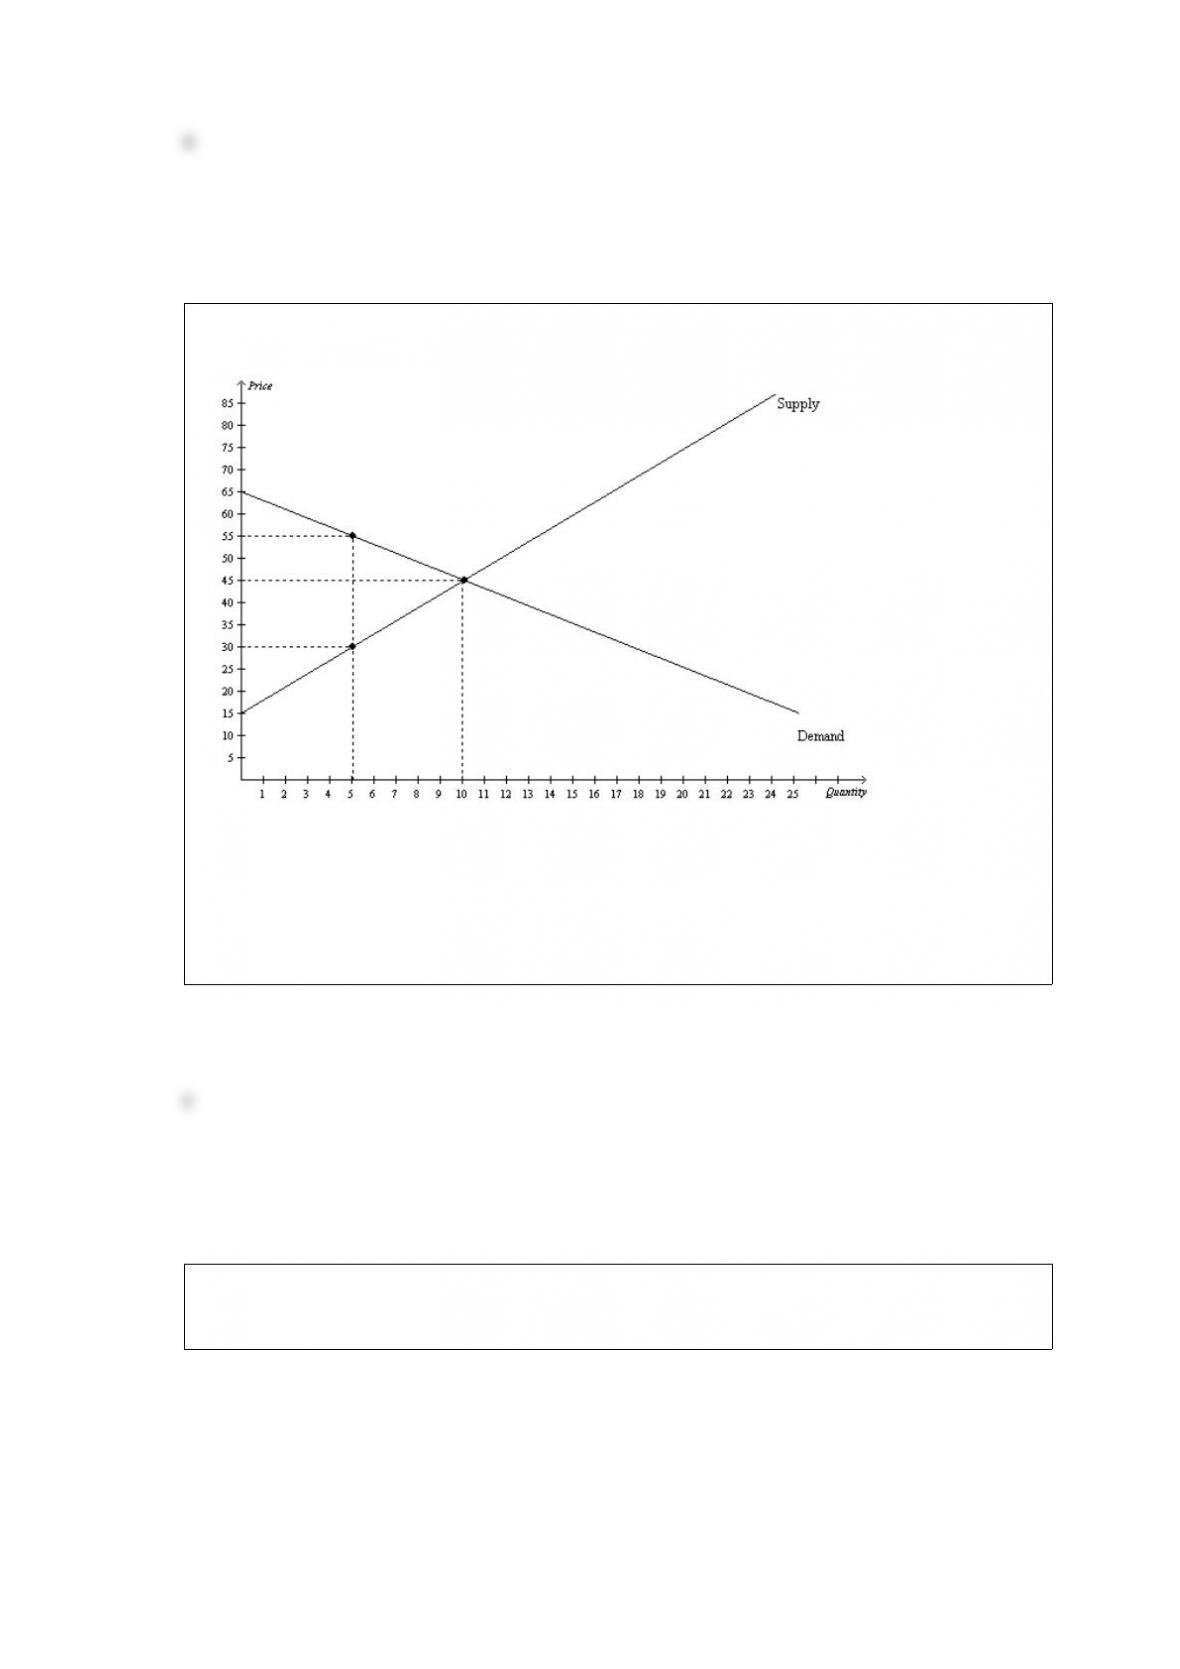
Figure 719
Refer to Figure 719. At the equilibrium price, total surplus is
a. $125.
b. $450.
c. $250.
d. $500.
Figure 424
The diagram below pertains to the demand for turkey in the United States.
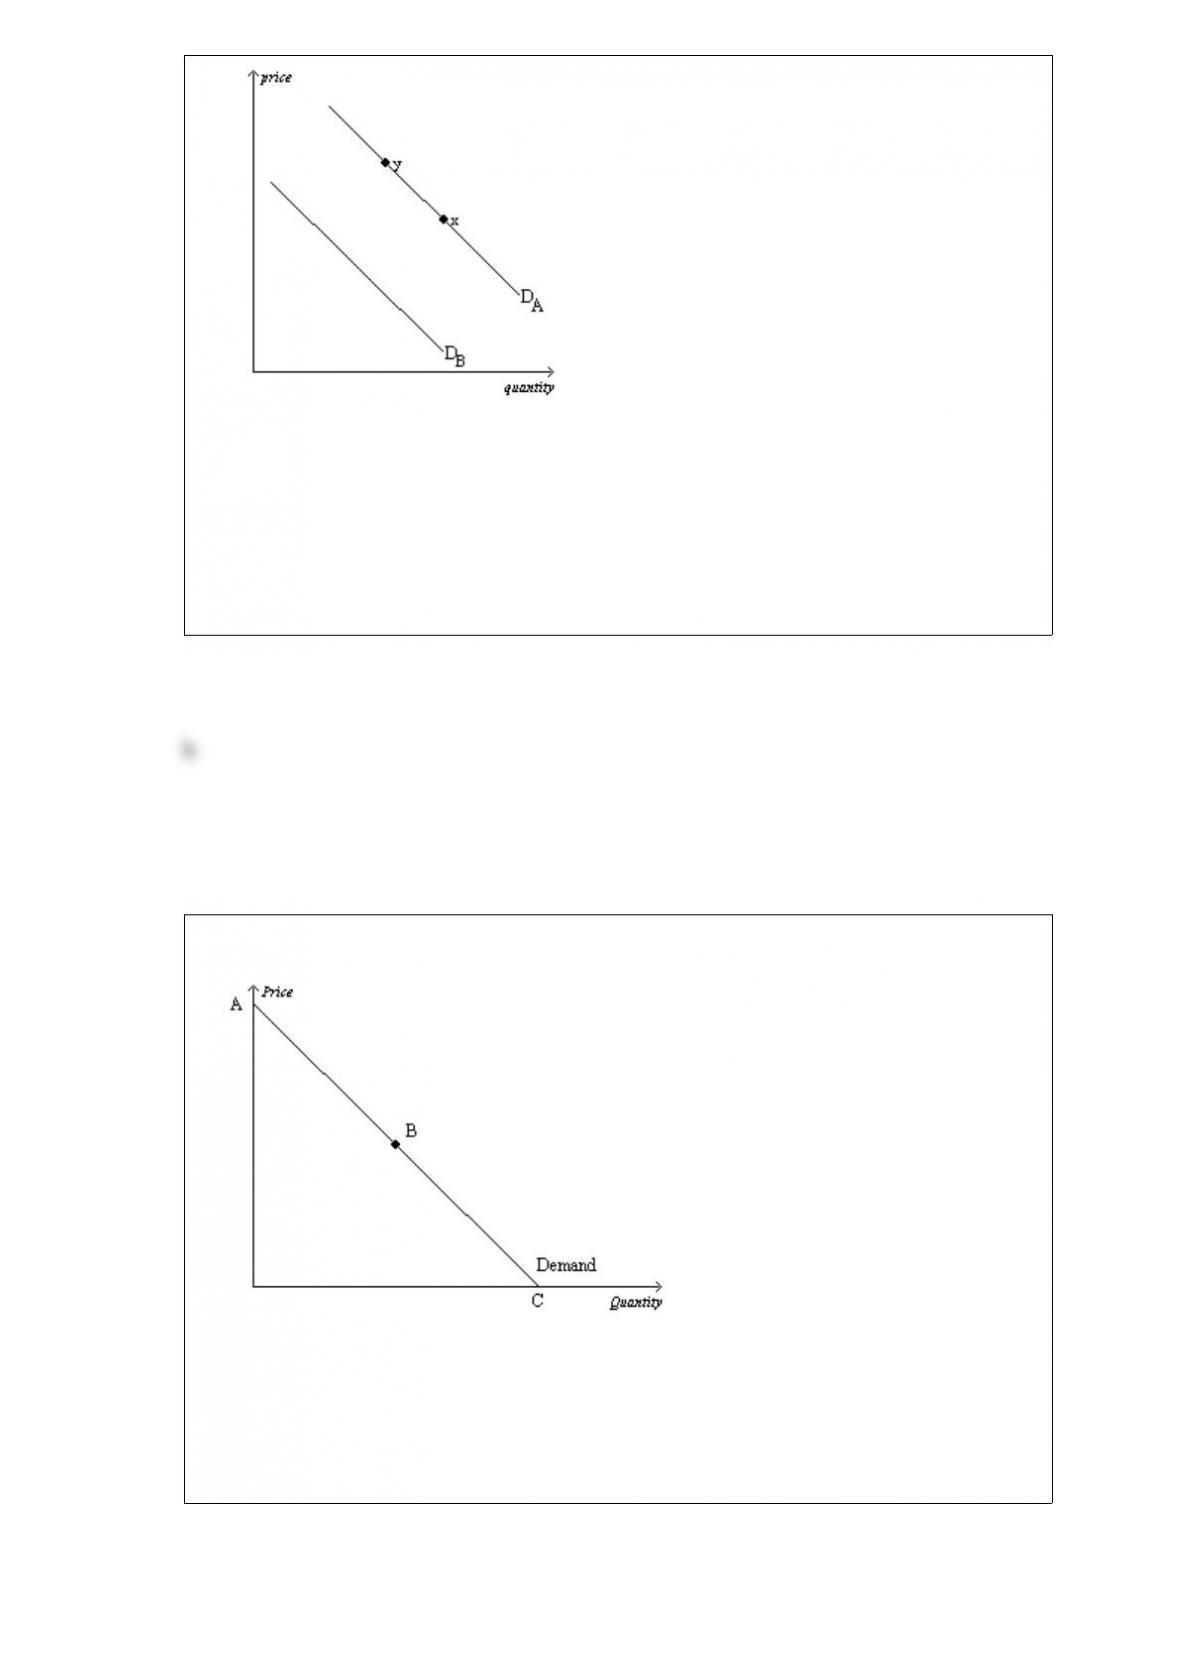
Refer to Figure 424. All else equal, the approach of Thanksgiving would cause a move
from
a. DA to DB.
b. DB to DA.
c. x to y.
d. y to x.
Figure 54
Refer to Figure 54. The section of the demand curve at point B represents the
a. elastic section of the demand curve.
b. inelastic section of the demand curve.
c. unit elastic section of the demand curve.
d. perfectly elastic section of the demand curve.

The imposition of a binding price ceiling on a market causes
a. quantity demanded to be greater than quantity supplied.
b. quantity demanded to be less than quantity supplied.
c. quantity demanded to be equal to quantity supplied.
d. the price of the good to be greater than its equilibrium price.
A $1.50 tax levied on the buyers of pomegranate juice will shift the demand curve
a. upward by exactly $1.50.
b. upward by less than $1.50.
c. downward by exactly $1.50.
d. downward by less than $1.50.
Figure 81

Refer to Figure 81. Suppose the government imposes a tax of P’ P”’. The area measured
by K+L represents
a. tax revenue.
b. consumer surplus before the tax.
c. producer surplus after the tax.
d. total surplus before the tax.
Table 321
Assume that Jamaica and Norway can switch between producing coolers and producing
radios at a constant rate. The following table shows the number of coolers or number of
radios each country can produce in one day.
Output Produced in One Day
CoolersRadios
Jamaica126
Norway243
Refer to Table 321. Assume that Jamaica and Norway each has 4 days available for
production. Originally, each country divided its time equally between the production of
coolers and radios. Now, each country spends all its time producing the good in which it
has a comparative advantage. As a result, the total output of radios increased by
a. 3.
b. 6.
c. 9.
d. 12.
When a binding price floor is imposed on a market,
a. price no longer serves as a rationing device.
b. the quantity demanded at the price floor exceeds the quantity that would have been
demanded without the price floor.
c. all sellers benefit.
d. All of the above are correct.
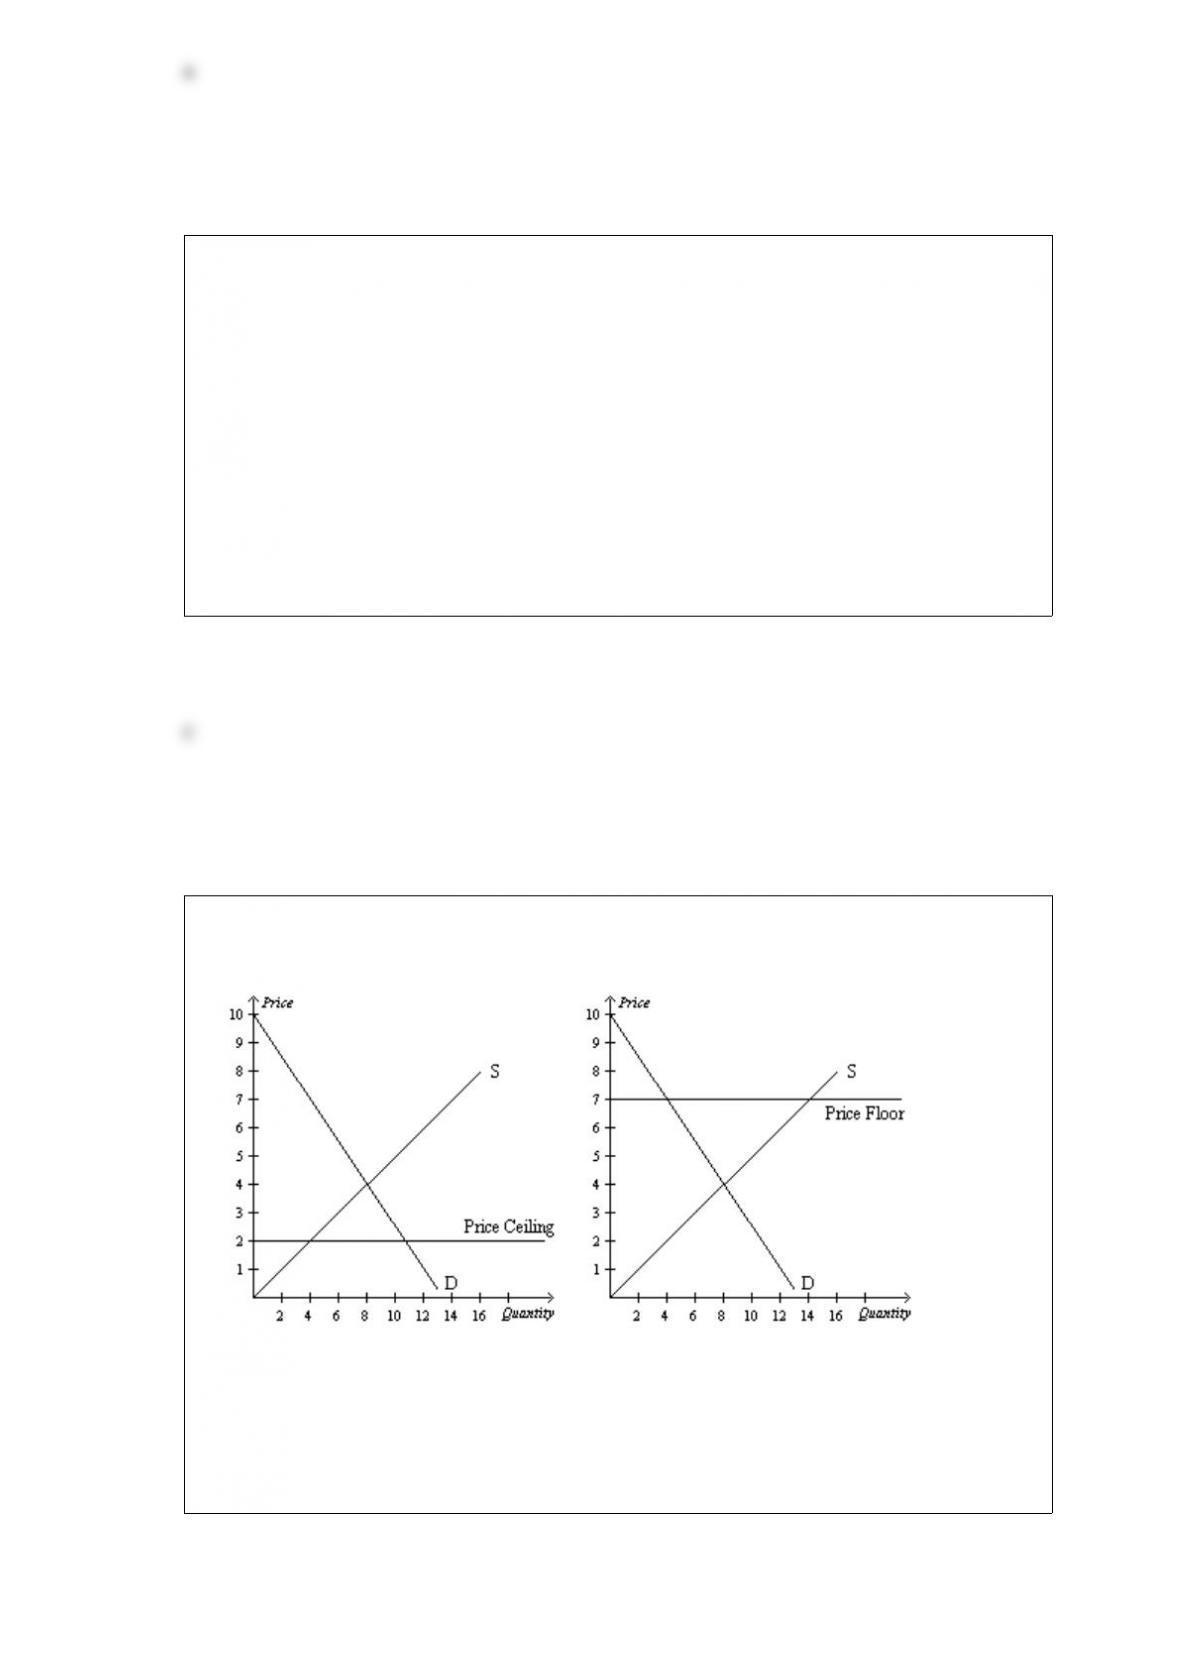
Table 73
The only four consumers in a market have the following willingness to pay for a good:
BuyerWillingness to Pay
Carlos$15
Quilana$25
Wilbur$35
Mingla$45
Refer to Table 73. If the price is $20, then consumer surplus in the market is
a. $20, and Wilbur and Mingla purchase the good.
b. $45, and Carlos and Quilana purchase the good.
c. $45, and Quilana, Wilbur, and Mingla purchase the good.
d. $55, and Carlos, Wilbur, and Mingla purchase the good.
Figure 63
Panel (a)Panel (b)
Refer to Figure 63. A binding price floor is shown in
a. both panel (a) and panel (b).
b. panel (a) only.
c. panel (b) only.
d. neither panel (a) nor panel (b).
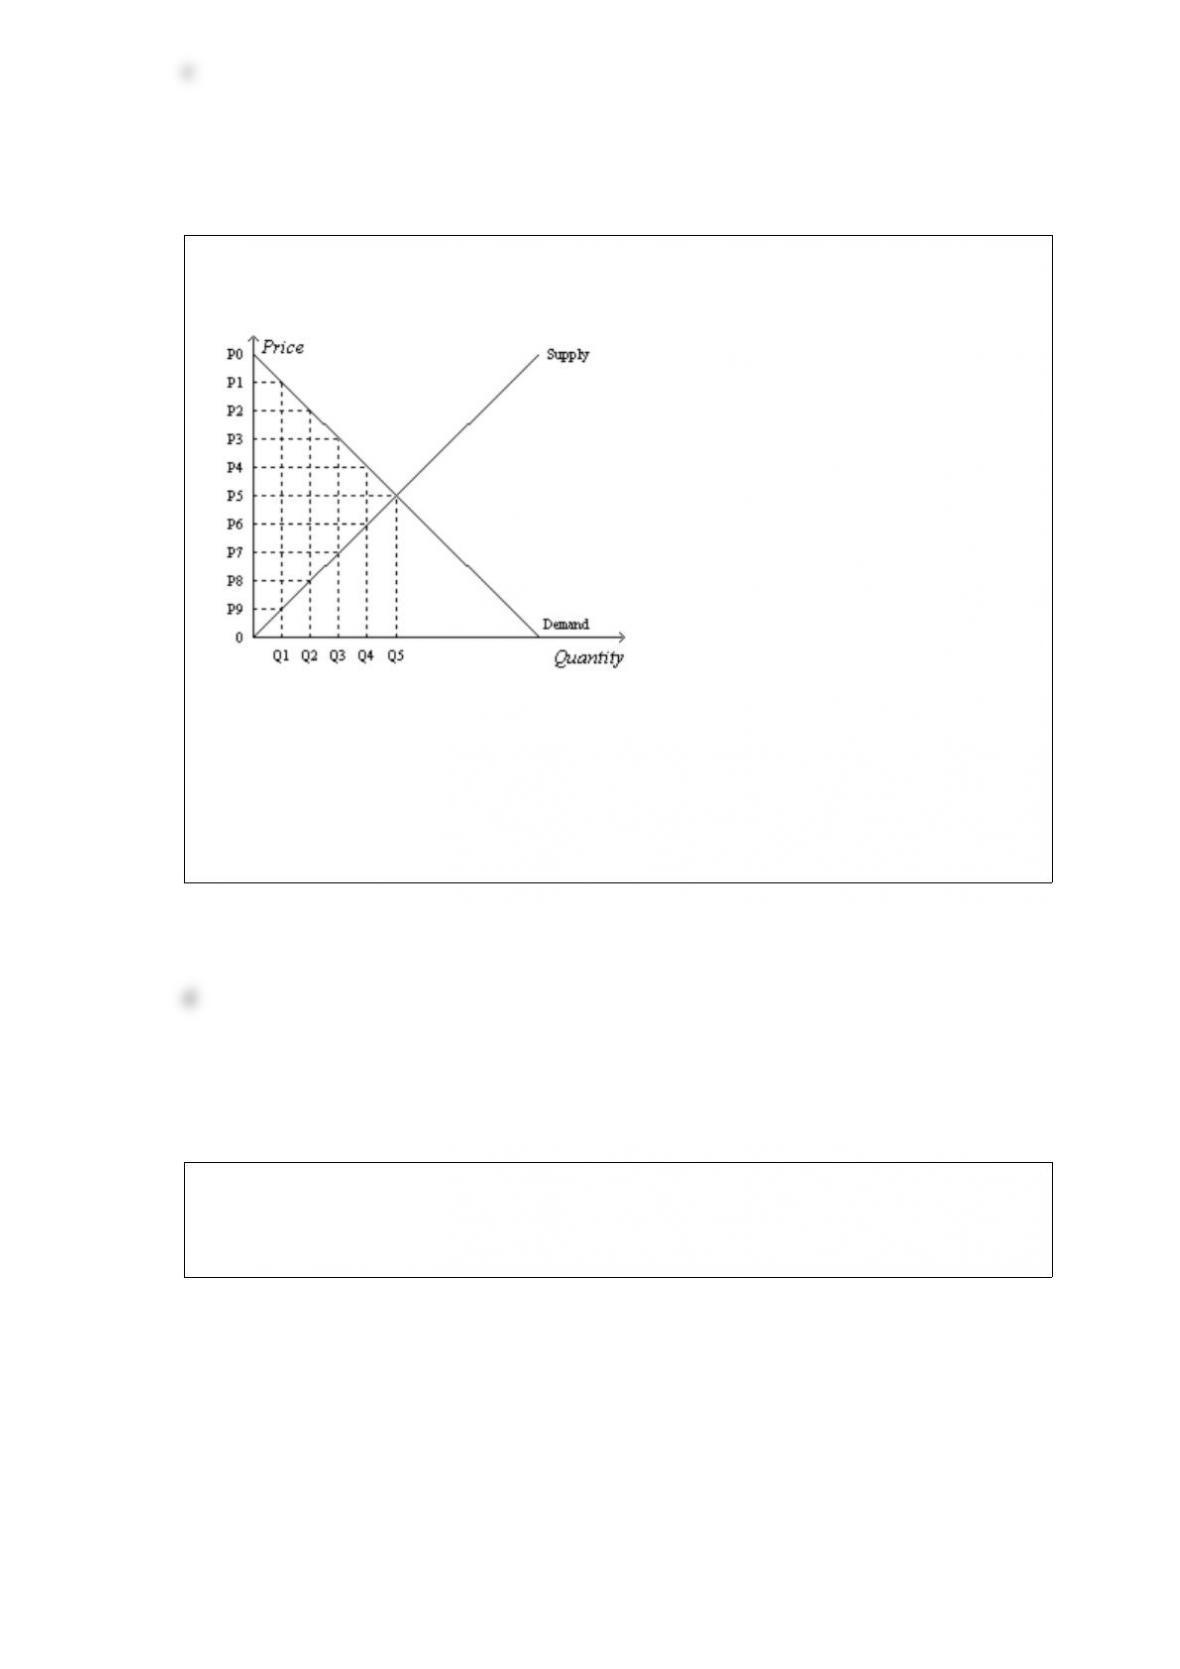
Figure 810
Refer to Figure 810. Suppose the government imposes a tax that reduces the quantity
sold in the market after the tax to Q2. The deadweight loss of the tax is
a. [1/2 x (P0P5) x Q5] + [1/2 x (P50) x Q5].
b. [1/2 x (P0P2) x Q2] +[(P2P8) x Q2] + [1/2 x (P80) x Q2].
c. (P2P8) x Q2.
d. 1/2 x (P2P8) x (Q5Q2).
Figure 924
The following diagram shows the domestic demand and supply in a market. Assume
that the world price in this market is $20 per unit.
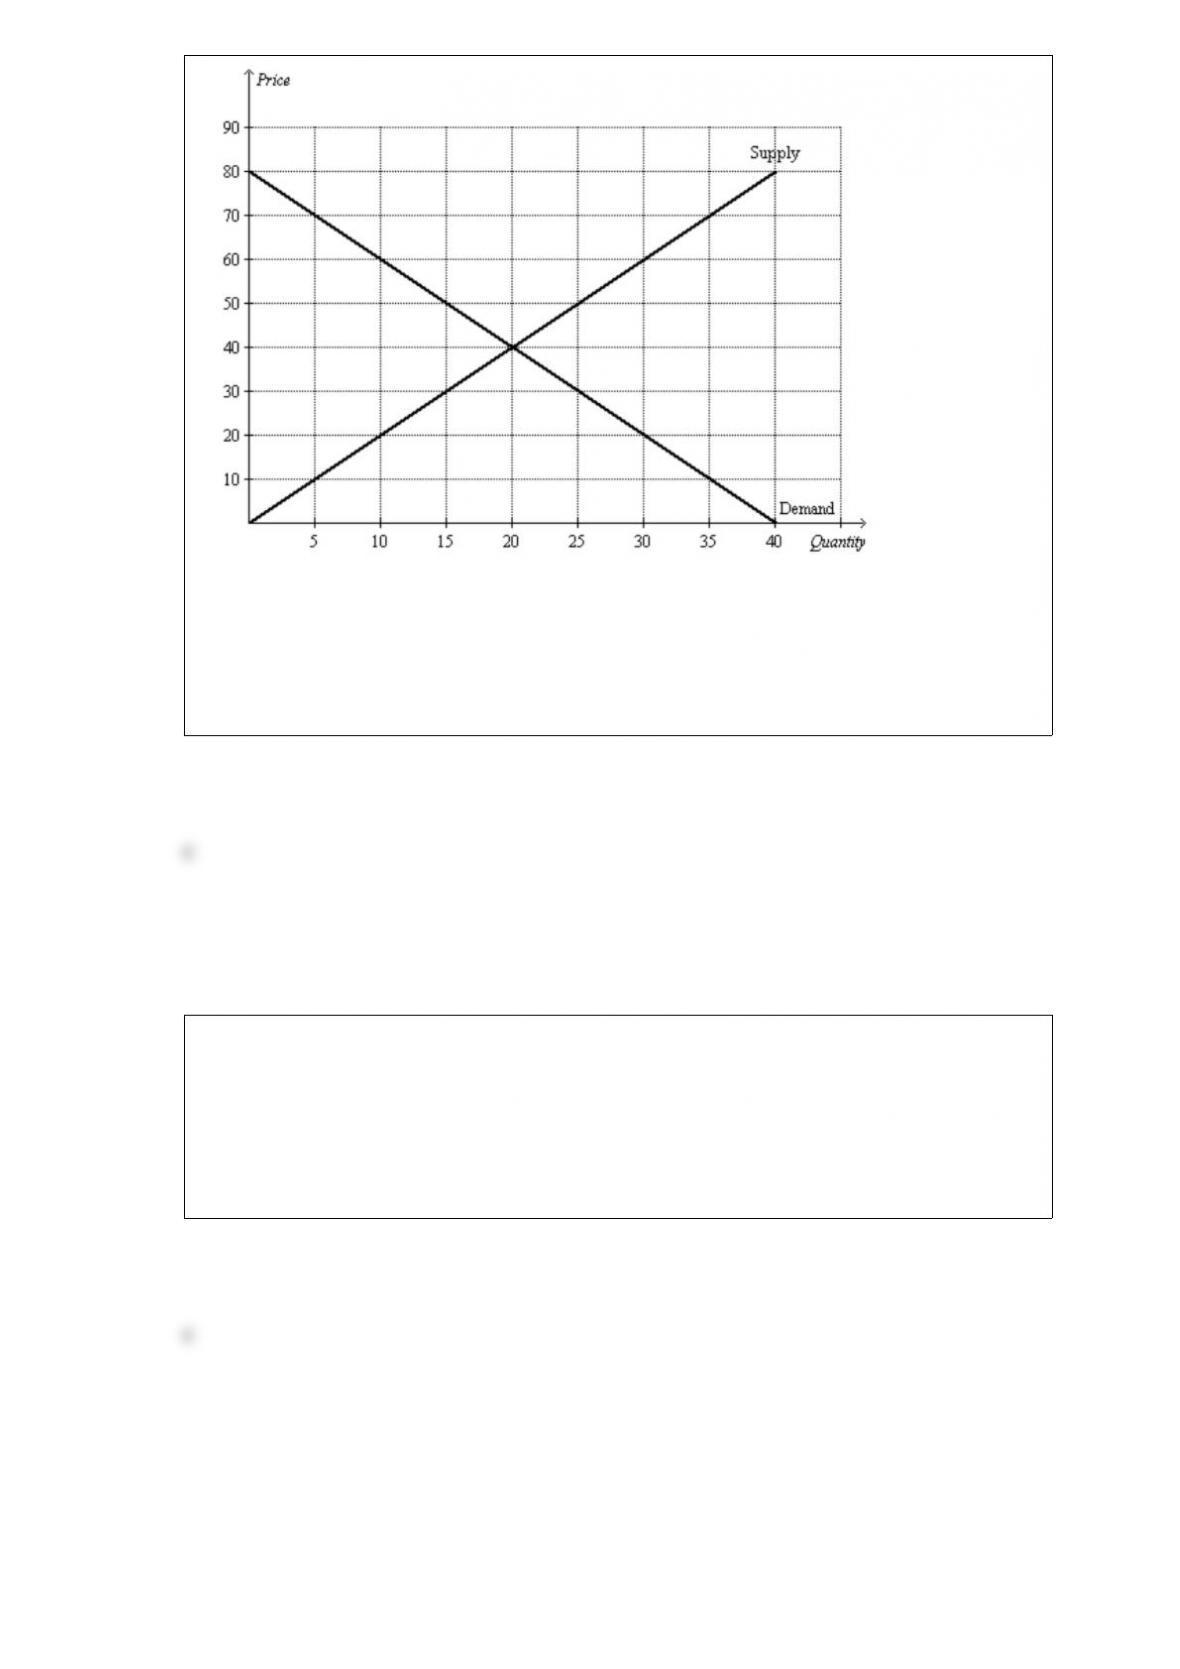
Refer to Figure 924. With free trade, total surplus is
a. $500.
b. $800.
c. $1,000.
d. $1,300.
If the price elasticity of demand for a good is 1.2, then a 3 percent decrease in price
results in a
a. 0.4 percent increase in the quantity demanded.
b. 2.5 percent increase in the quantity demanded.
c. 3.6 percent increase in the quantity demanded.
d. 6 percent increase in the quantity demanded.