Marginal productivity theory implies that a worker will be paid an amount
a. equal to his or her contribution to the productive process.
b. less than his or her contribution to the productive process.
c. greater than his or her contribution to the productive process.
d. determined by his or her individual bargaining.
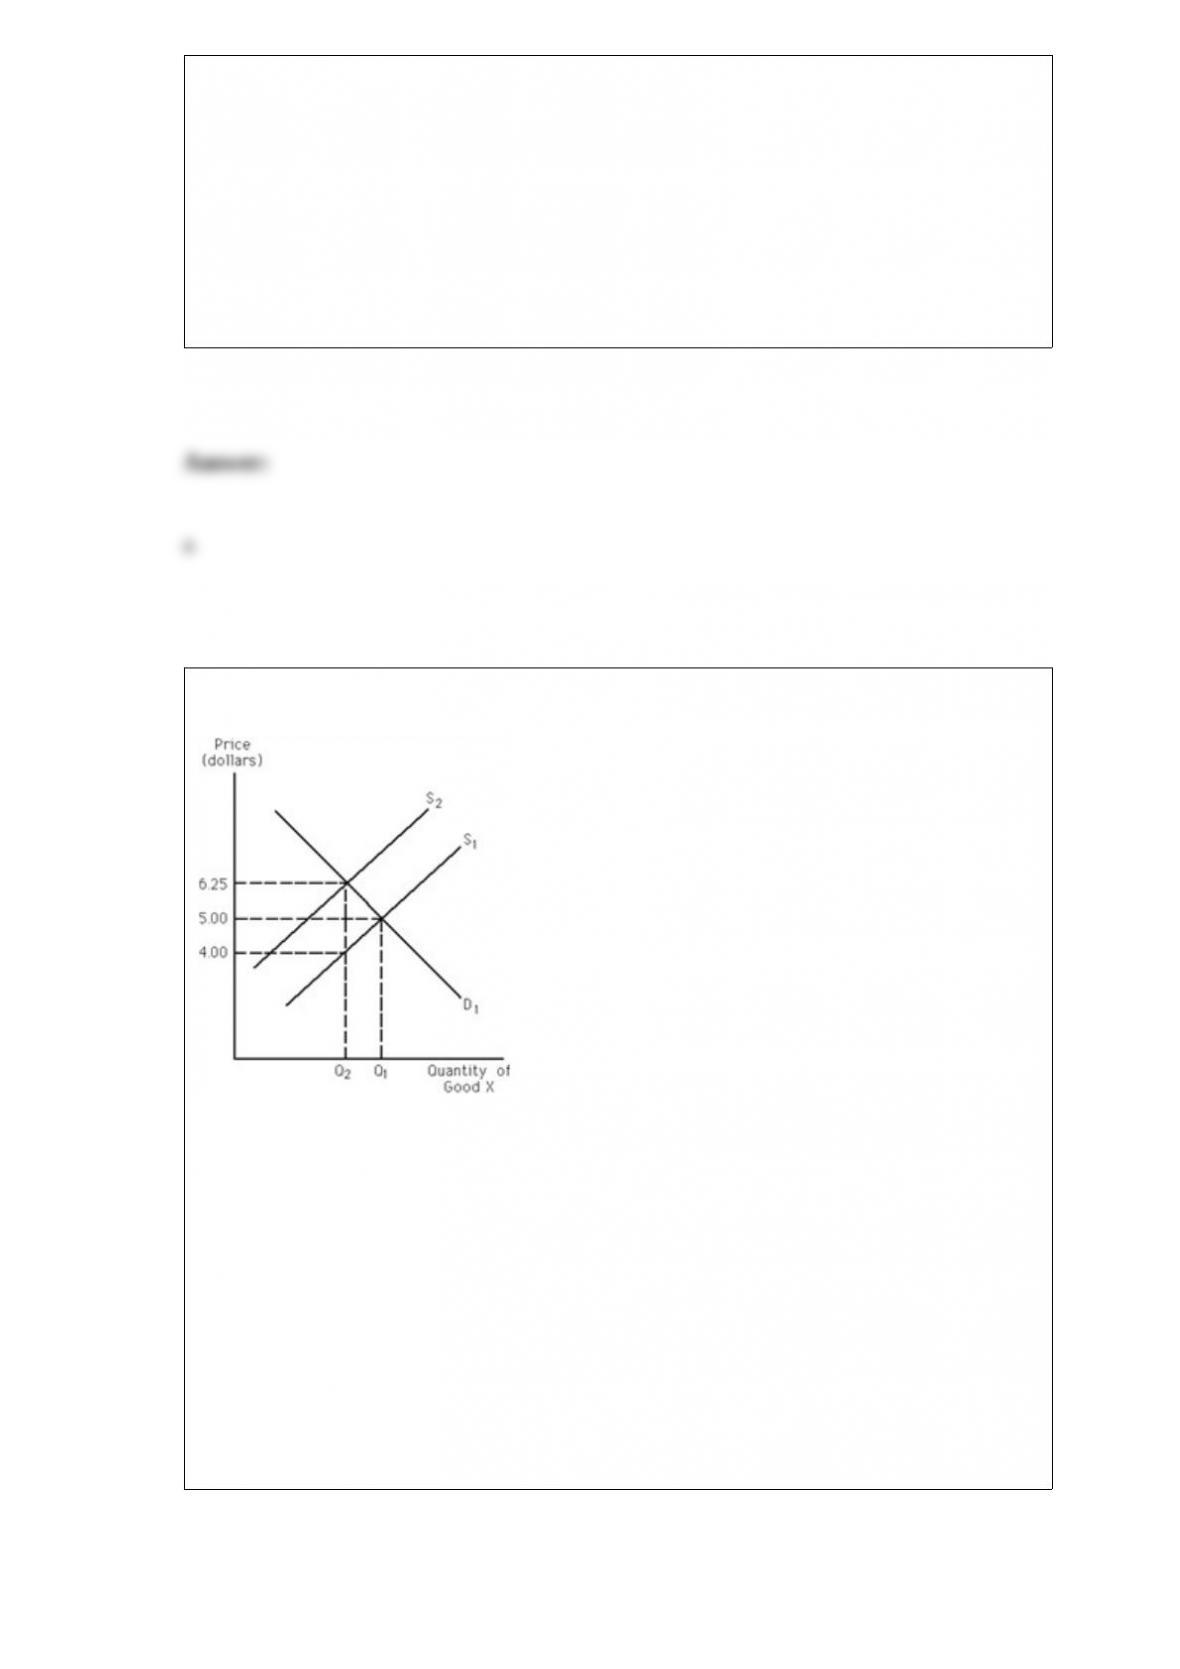
Exhibit 20-2
The market for good X is initially in equilibrium at $5. The government then places a
tax on the producers of good X, taxing them on each unit of good X they sell. As a
result, the supply curve
a. shifts (down and) rightward from S2 to S1.
b. shifts (up and) leftward from S1 to S2.
c. does not shift from S1.
d. There is not enough information to answer the question.

Suppose that in the year 2050, one gallon of water is more expensive than a one-carat
diamond. What could explain this?
a. Water must be much more scarce in the world of 2050 than today.
b. Diamonds must be much less scarce in the world of 2050 than today.
c. The diamond-water paradox does not hold for any pair of goods in the future.
d. The law of diminishing marginal utility no longer holds.
e. a or b
If the price of a good rises and as a result total revenue falls, then it must be true that
a. cross elasticity of demand for the good is negative.
b. price elasticity of demand for the good is less than 1.
c. income elasticity of demand for the good is positive.
d. b and c
e. none of the above

An increase in supply is graphically represented by a leftward shift of the supply curve.
a. True
b. False
For a certain good, when the good’s price falls from $14 to $12, its quantity demanded
rises from 1,200 to 1,400 units. The price elasticity of demand for this good is
a. 2.55.
b. 0.66.
c. 0.39.
d. 0.20.
e. 1.00
Smith, who has $10,000, receives an extra dollar, as does Jones, who has $100,000.
Smith receives more utility from the extra dollar than does Jones. This is an example of
a. an interpersonal utility comparison.
b. the law of diminishing marginal utility.
c. the diamond-water paradox.
d. a and b
A person is more likely to be poor if he or she is
a. African-American or Hispanic rather than white.
b. a member of a male-headed family rather than a female-headed family.
c. old rather than young.
d. all of the above
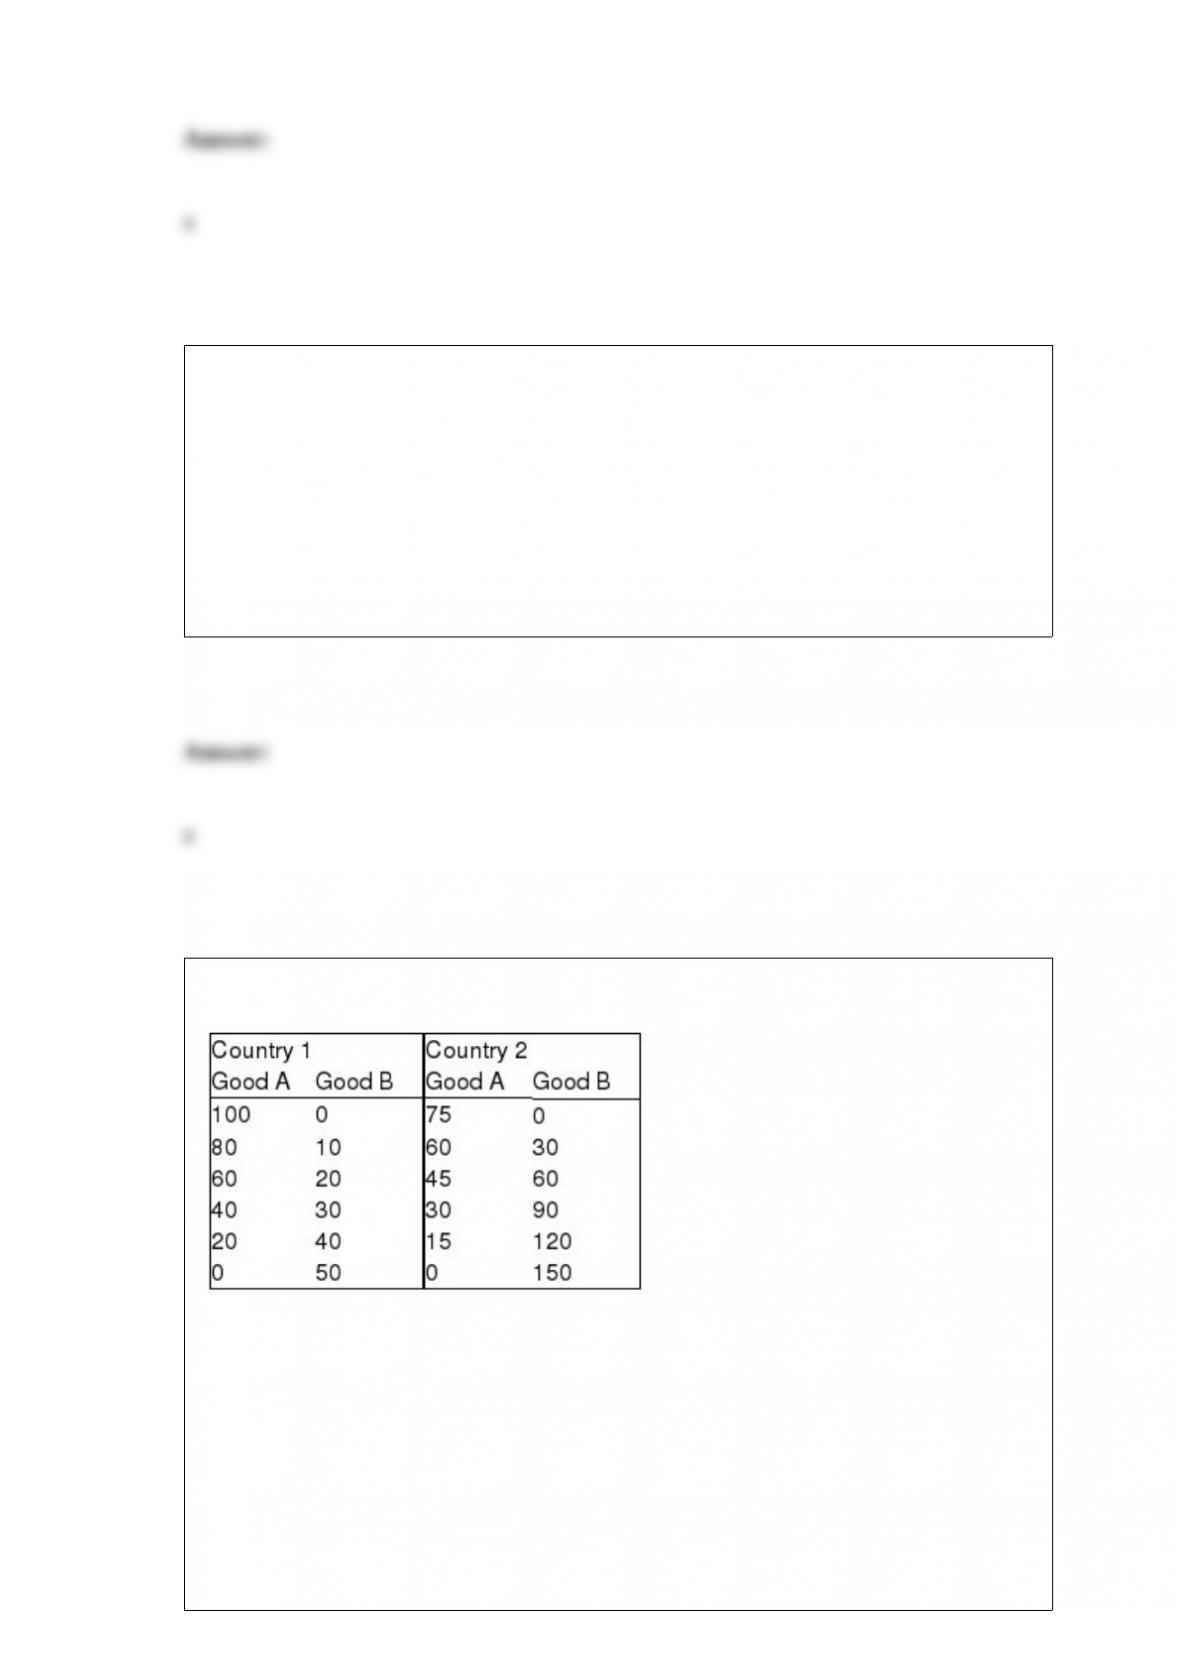
Exhibit 34-5
Country 1 has a comparative advantage in the production of __________, and country 2
has a comparative advantage in the production of __________.
a. good A; good B
b. good B; good A
c. both goods; neither good
d. neither good; both goods
e. neither good; neither good
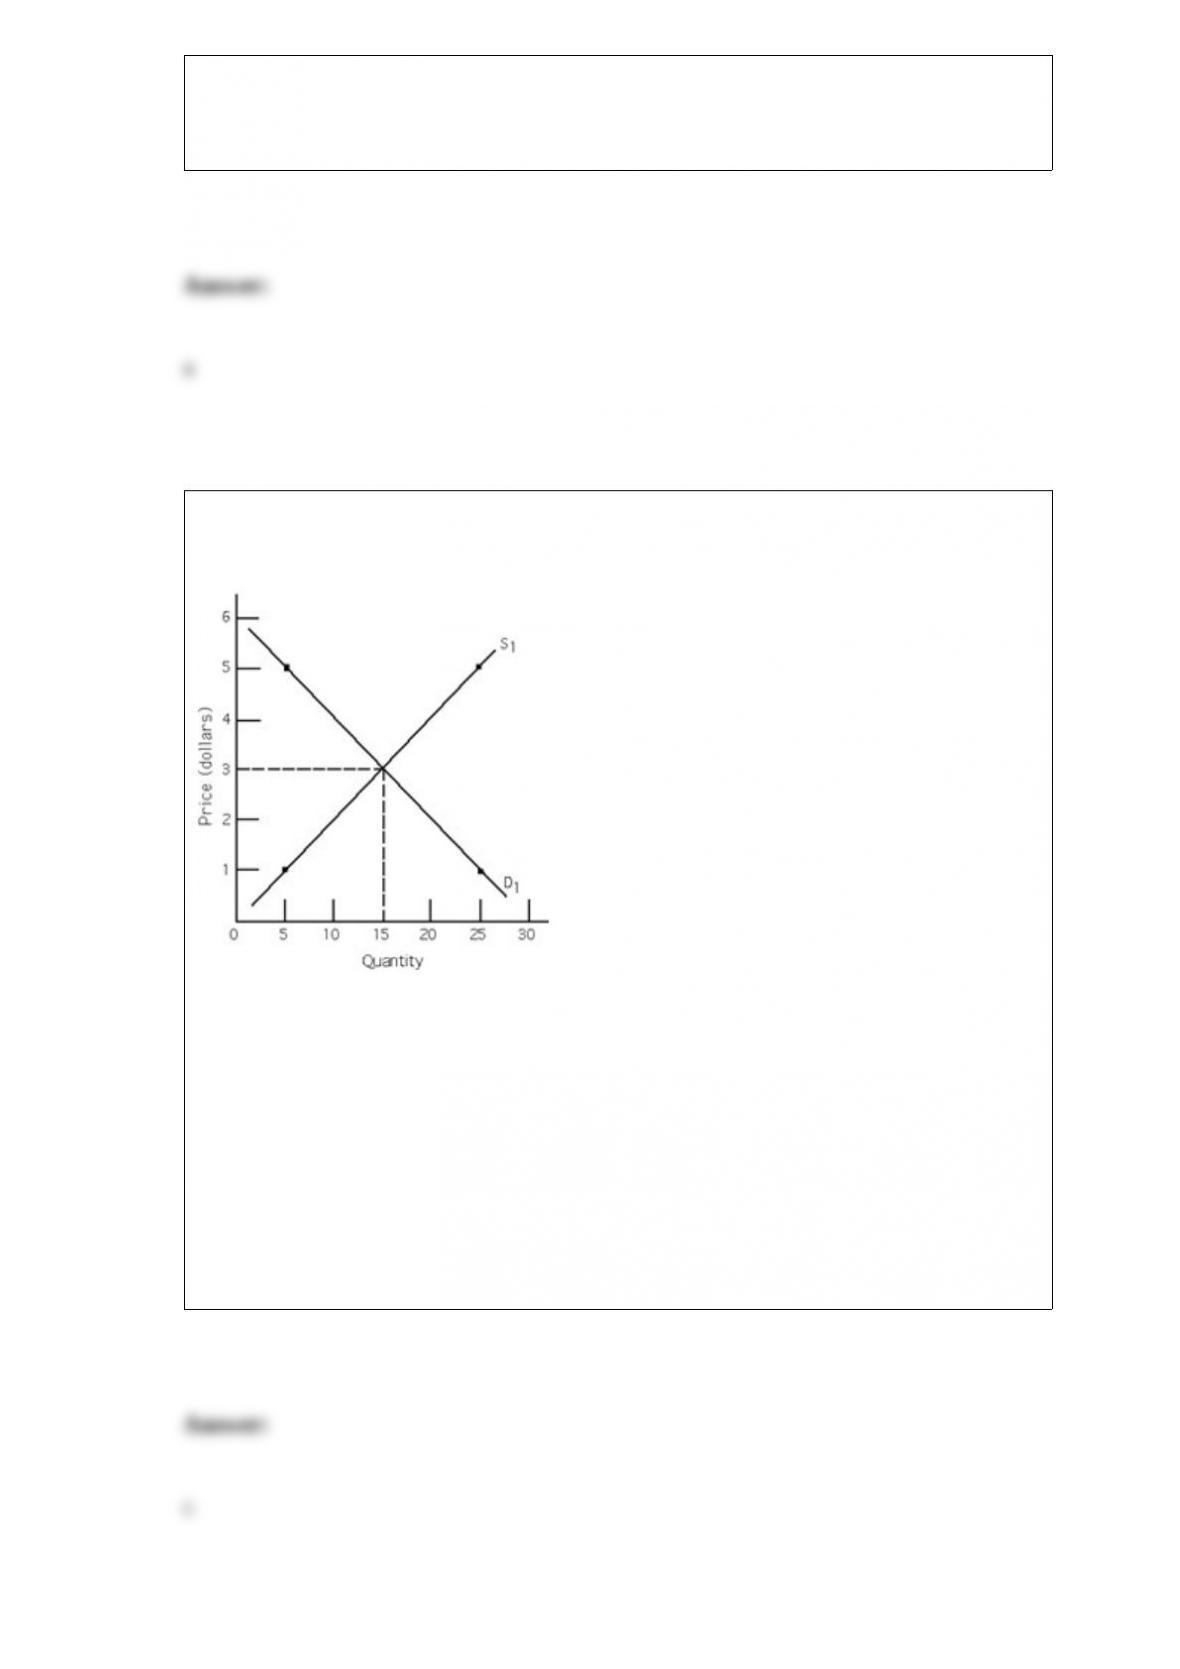
Exhibit 3-8
A price of $5 will result in a ___________________ in this market which will cause the
price of the product to gravitate _______________.
a. shortage; downward
b. shortage; upward
c. surplus; downward
d. surplus; upward

Price rises from $9.99 to $10.99 and quantity demanded does not change for good X. It
follows that the entire demand curve for good X is
a. perfectly inelastic.
b. inelastic.
c. elastic.
d. unit elastic.
e. There is not enough information to answer the question.