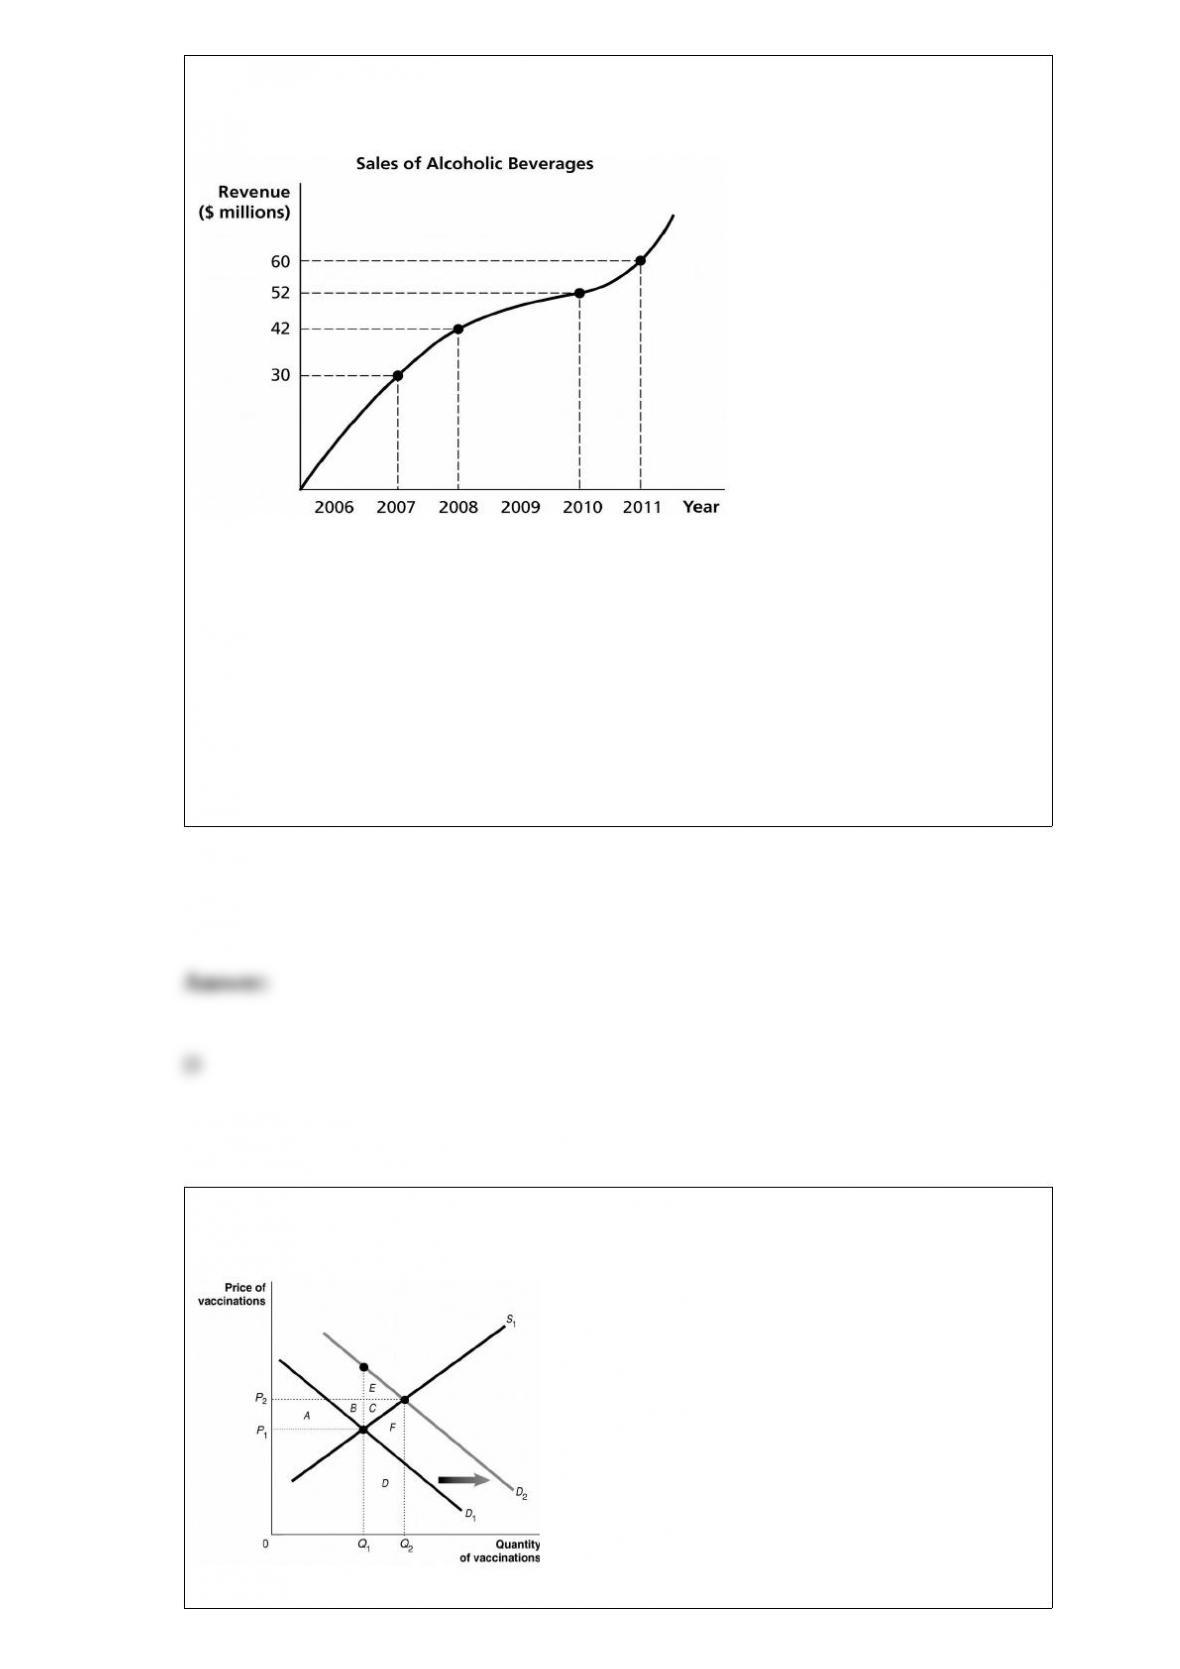
Figure 1-1
Refer to Figure 1-1. Using the information in the figure above, calculate the percentage
change in sales of alcoholic beverages between 2008 and 2011.
A) 23.1%
B) 23.8%
C) 30%
D) 42.9%
Figure 5-6

Figure 5-6 shows the market for measles vaccinations, a product whose use generates
positive externalities.
Refer to Figure 5-6. What does D2 represent?
A) the social welfare curve
B) the demand curve reflecting social benefit
C) the demand curve reflecting private benefit
D) the positive externalities curve
Which of the following is a flow in the circular flow model?
A) the flow of goods and services from households to firms
B) the flow of profit and the flow of revenue
C) the flow of income earned by firms and the flow of expenditures earned by
households
D) the flow of revenue received by firms and the flow of payments to resource owners
Figure 13-17
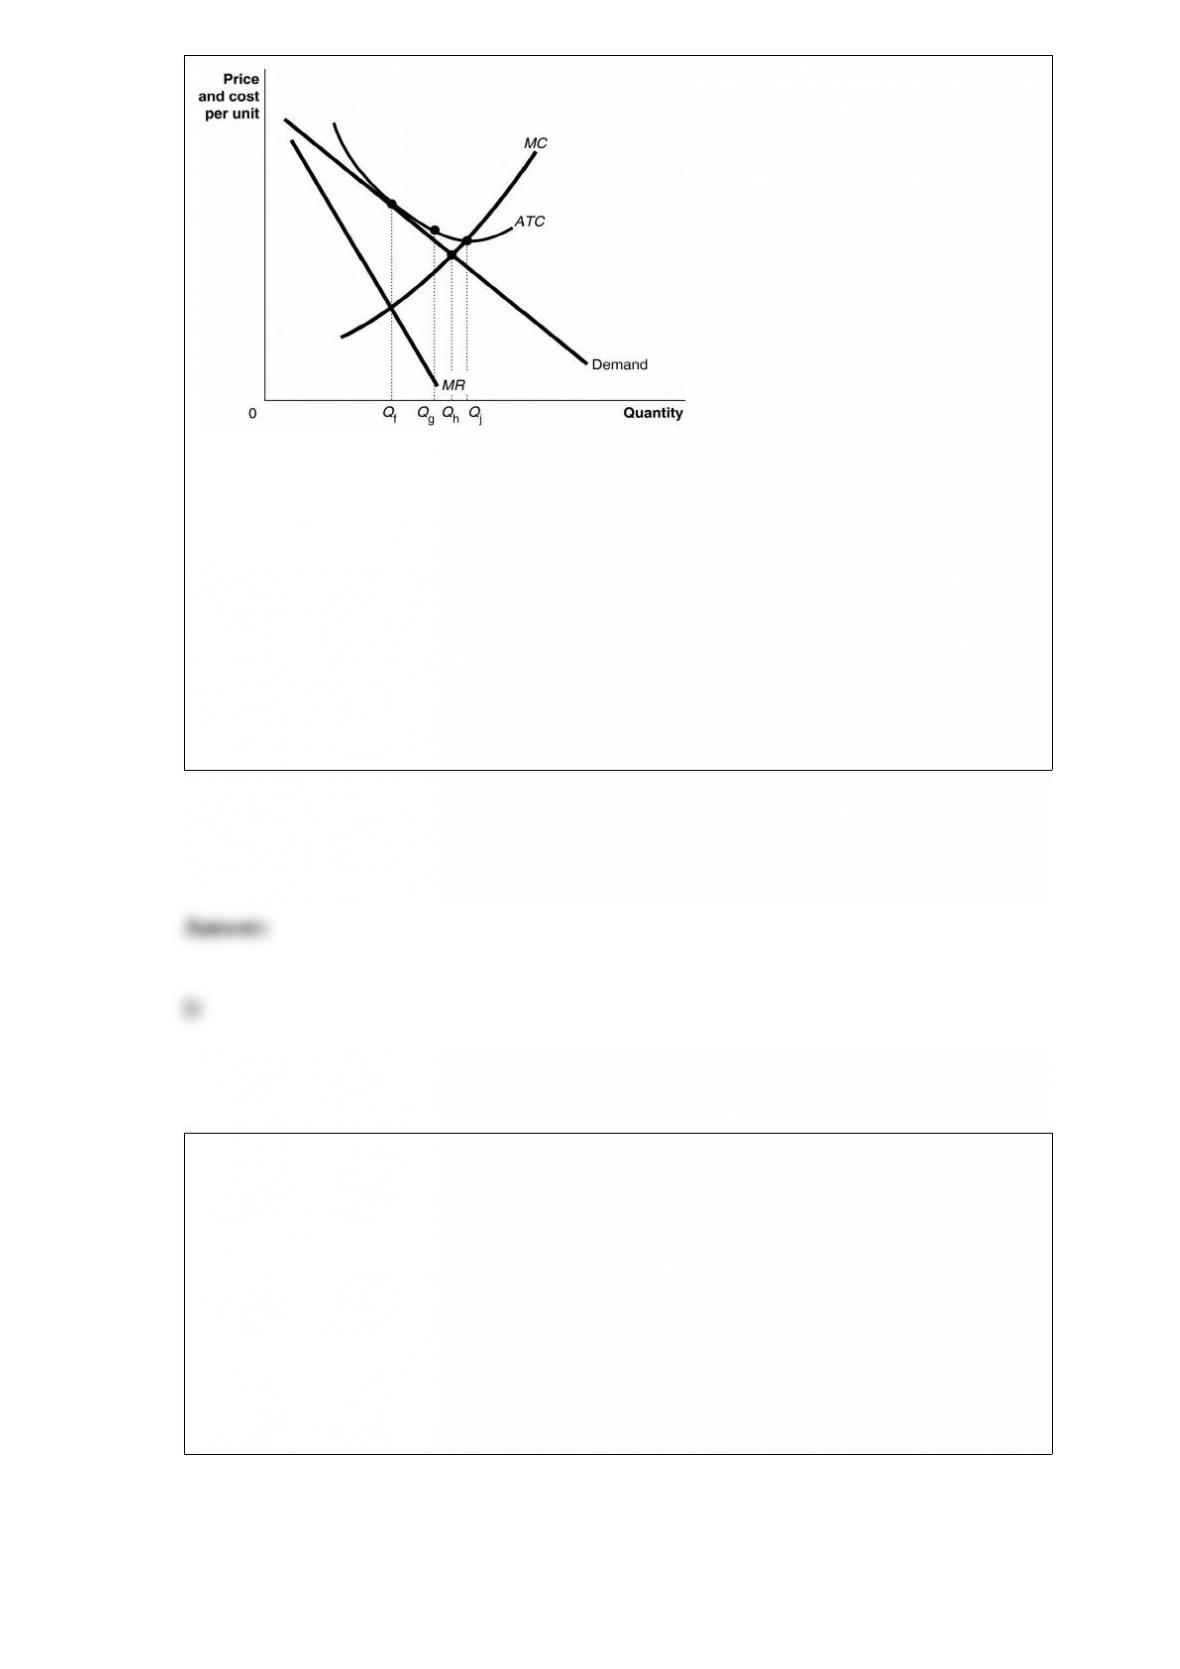
Refer to Figure 13-17. What is the productively efficient output for the firm
represented in the diagram?
A) Qf units
B) Qg units
C) Qh units
D) Qj units
The ________ the sale of an additional unit of a product is a marginal benefit to the
firm.
A) revenue received from
B) extra cost of
C) total value of
D) sales tax on
All of the following are part of the “regulation of health insurance” provision of the
Patient Protection and Affordable Care Act (ACA) except
A) individuals with pre-existing medical conditions will be able to acquire health
insurance.
B) all policies must provide coverage for dependant children up to age 26.
C) lifetime dollar maximums on coverage will be prohibited.
D) limits on the size of deductibles and on waiting periods before coverage takes effect
will be eliminated.
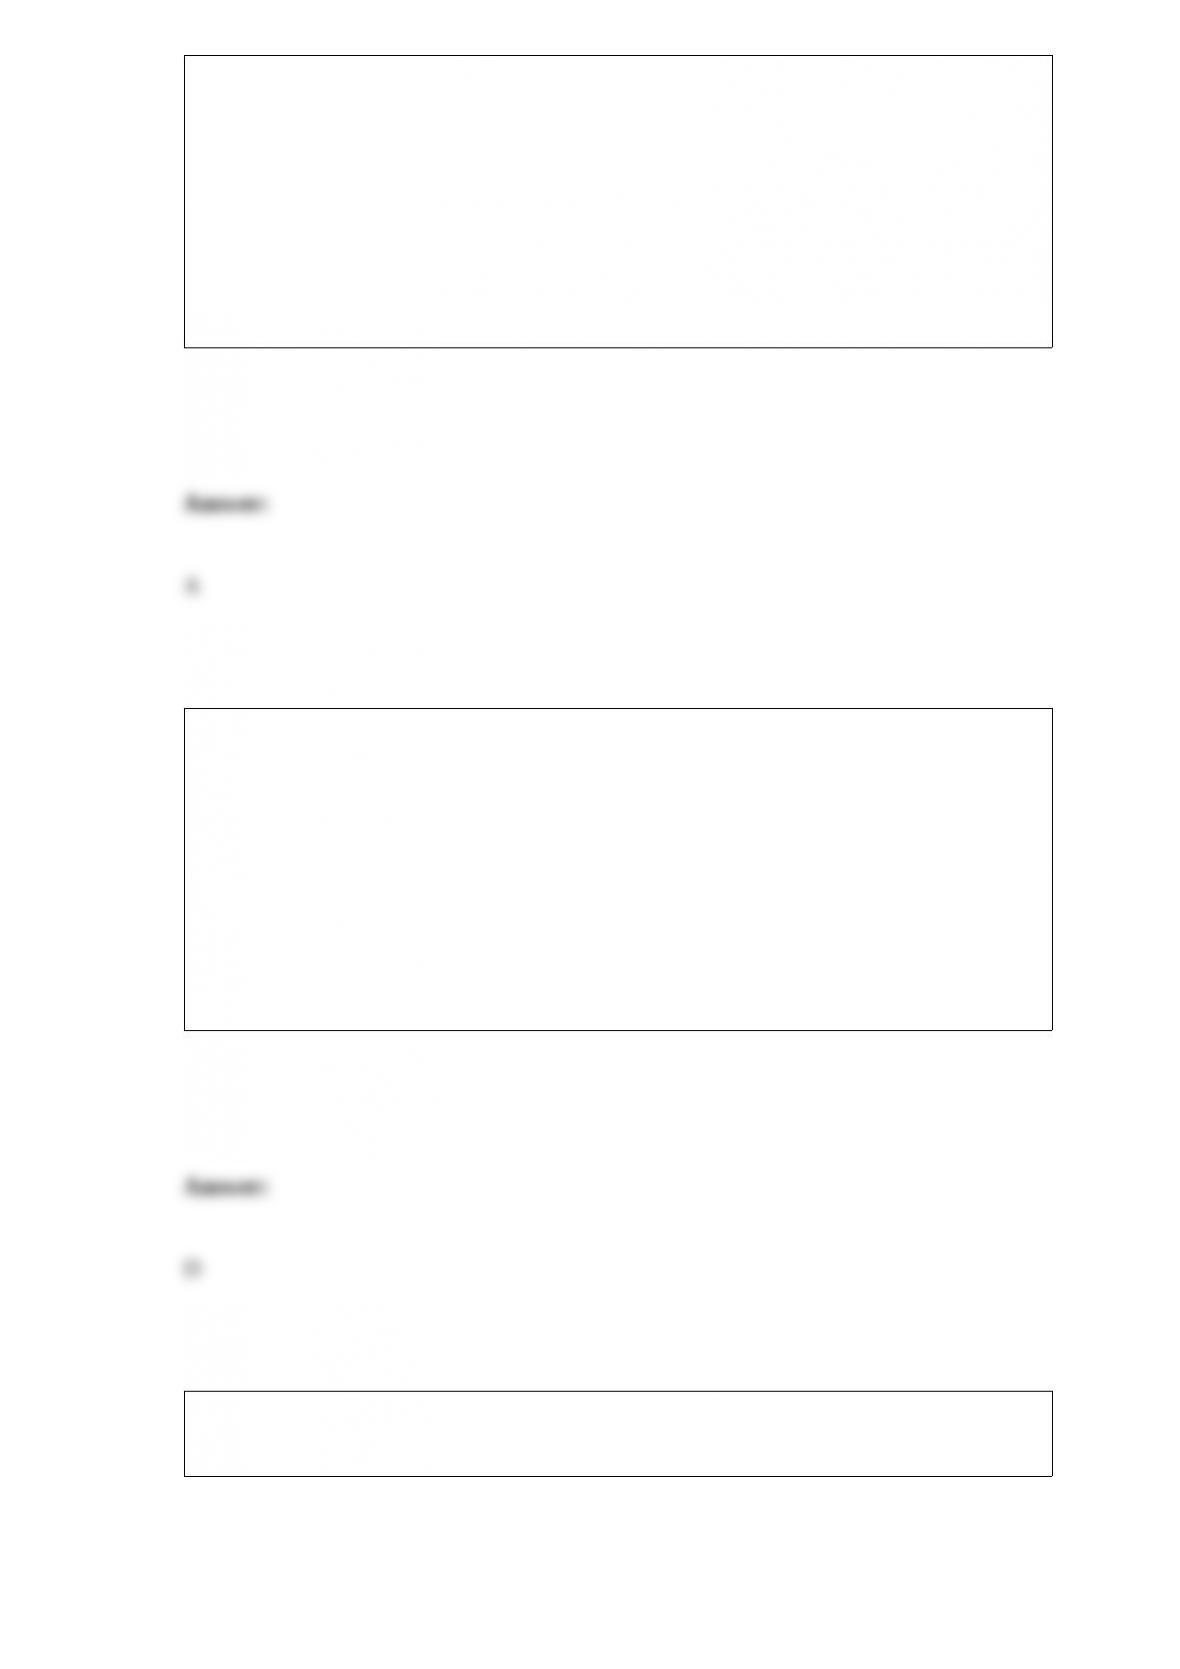
Table 14-3
Suppose OPEC has only two producers, Saudi Arabia and Nigeria. Saudi Arabia has far
more oil reserves and is the lower cost producer compared to Nigeria. The payoff
matrix in Table 14-3 shows the profits earned per day by each country. “Low output”
corresponds to producing the OPEC assigned quota and “high output” corresponds to
producing the maximum capacity beyond the assigned quota.
Refer to Table 14-3. Which of the following statements is true?
A) The Nash equilibrium is a noncooperative, dominant strategy equilibrium.
B) The Nash equilibrium is a cooperative equilibrium.
C) The Nash equilibrium is a collusive equilibrium.
D) There is no Nash equilibrium in this game because each party pursues its dominant
strategy.
The ________ effect refers to the change in quantity demanded for a good that results
from the effect of a change in the good’s price on consumer’s purchasing power.
A) ceteris paribus
B) population
C) substitution
D) income
Figure 5-1
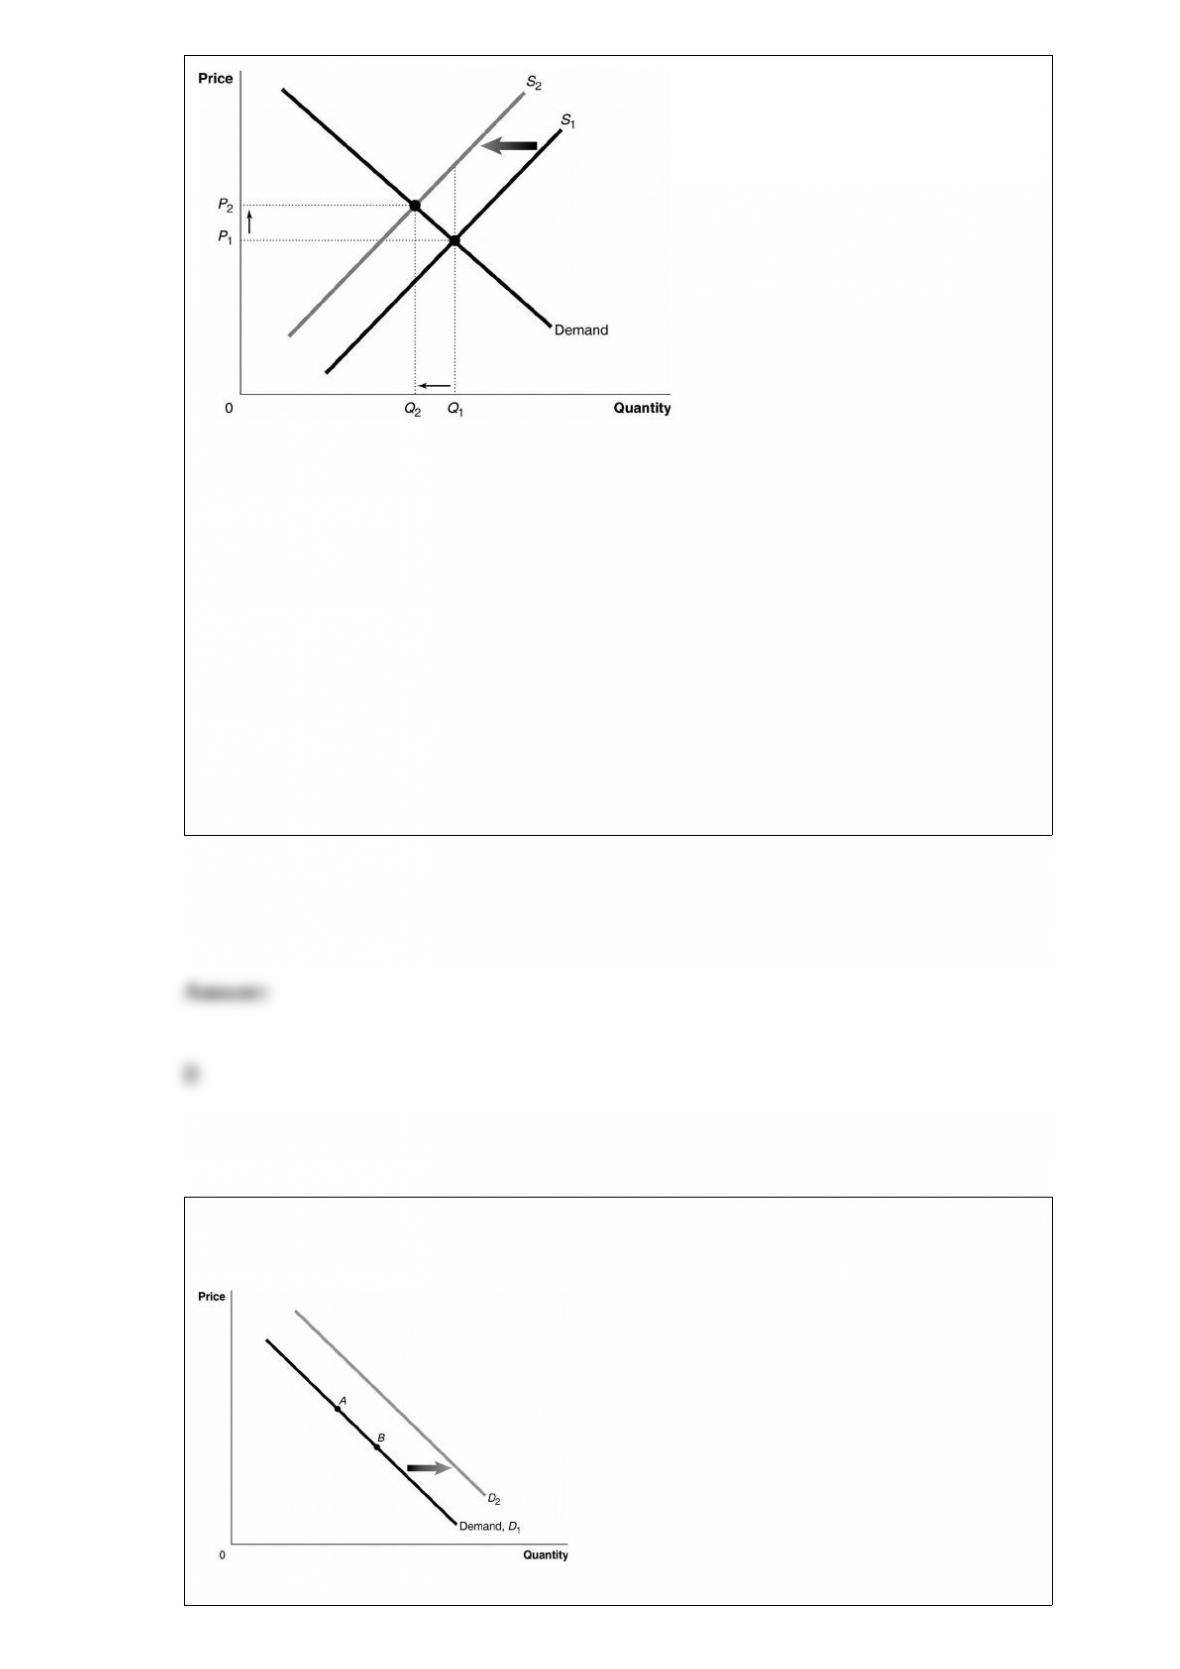
Figure 5-1 shows a market with an externality. The current market equilibrium output of
Q1 is not the economically efficient output. The economically efficient output is Q2.
Refer to Figure 5-1. If, because of an externality, the economically efficient output is
Q2 and not the current equilibrium output of Q1, what does S2 represent?
A) the market supply curve reflecting private cost
B) the market supply curve reflecting social cost
C) the market supply curve reflecting external cost
D) the market supply curve reflecting implicit cost
Figure 3-1
Refer to Figure 3-1. An increase in the expected future price of the product would be

represented by a movement from
A) A to B.
B) B to A.
C) D1 to D2.
D) D2 to D1.
Society faces a trade-off in all of the following situations except
A) when deciding who will receive the goods and services produced.
B) when deciding what goods and services will be produced.
C) when deciding how goods and services will be produced.
D) when some previously unemployed workers find jobs.
The antitrust law that prohibits price discrimination on grounds that it reduces
competition is
A) the Clayton Act.
B) the Federal Trade Commission Act.

C) the Robinson-Patman Act.
D) the Sherman Act.
A change in the slope of an isocost line is due to a change in
A) the output price.
B) the price of one or both inputs.
C) total cost.
D) quantity of output.
Figure 6-4
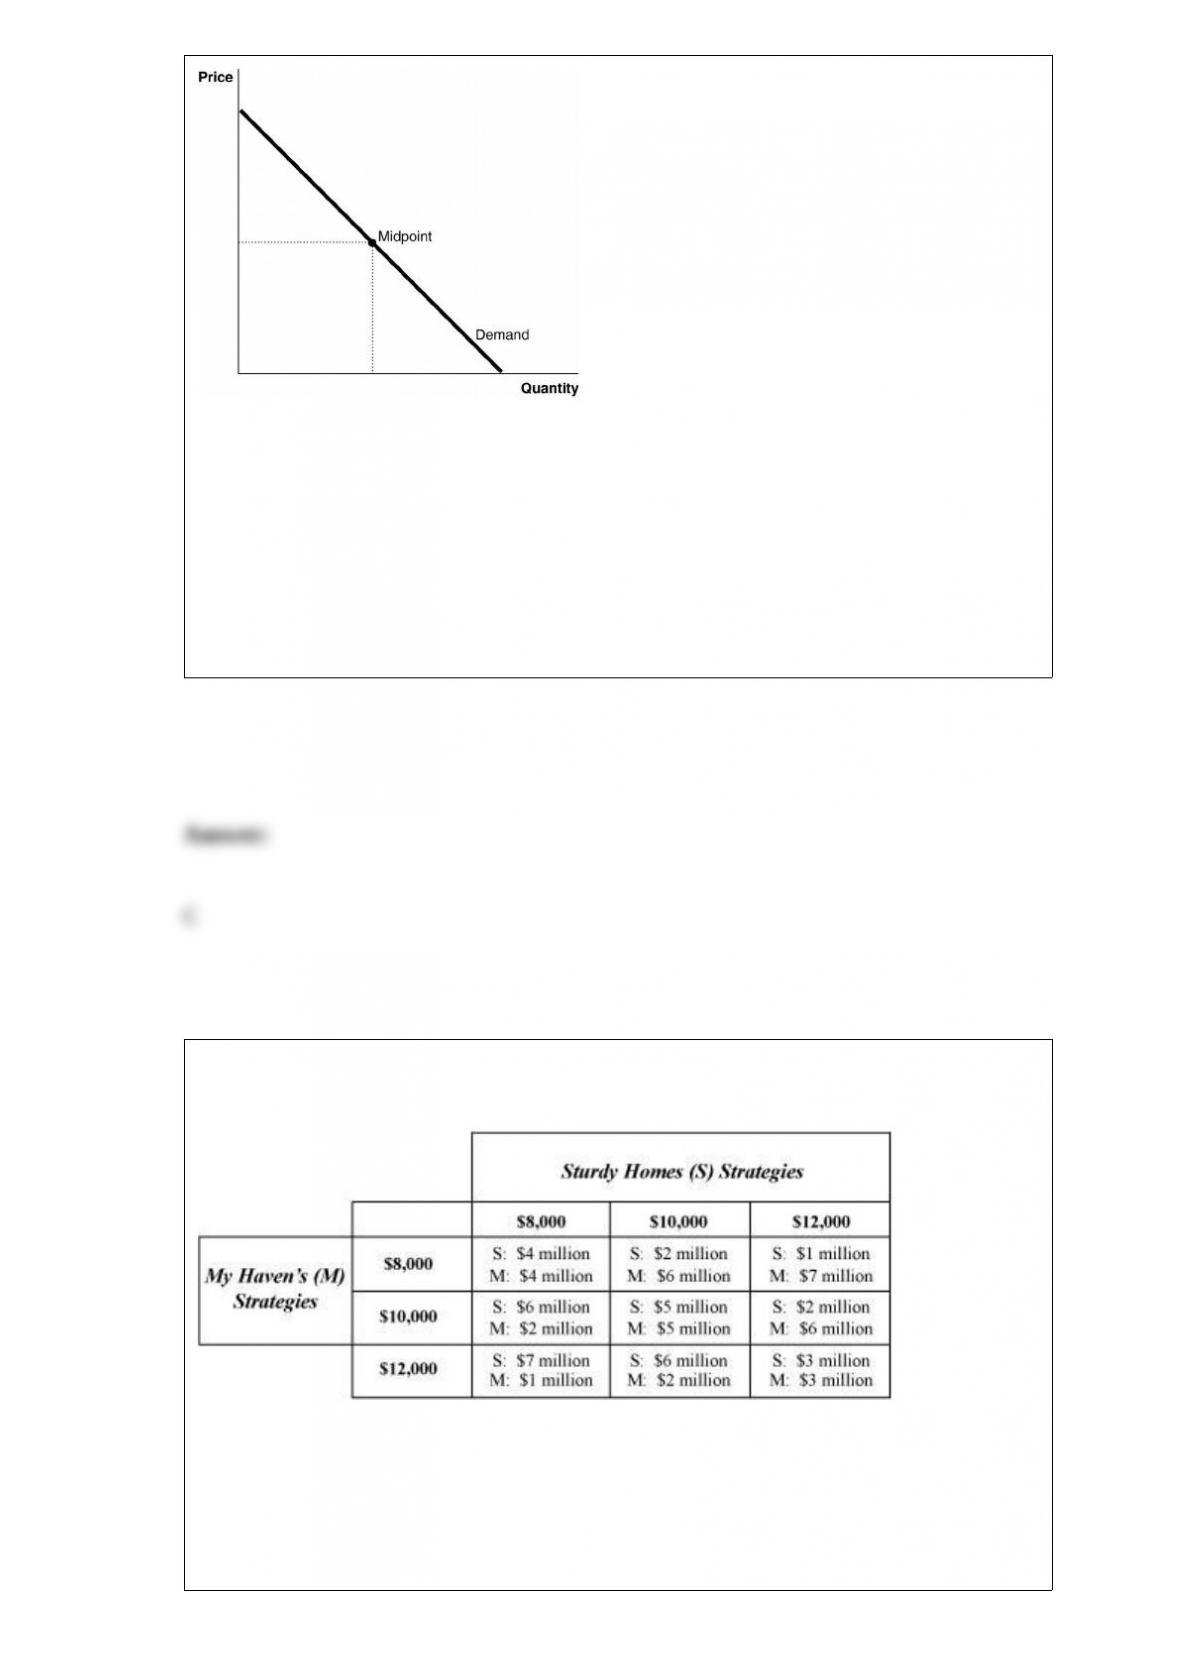
Refer to Figure 6-4. The inelastic segment of the demand curve
A) is coincident with the horizontal axis.
B) is coincident with the vertical axis.
C) lies below the midpoint of the curve.
D) lies above the midpoint of the curve.
Table 14-6
There are two mobile home manufacturers in Nevada, Sturdy Homes (S) and My Haven
(M). Sturdy Homes has been in the market for a long time and must now compete with
newcomer, My Haven. Suppose that Sturdy Homes believes that My Haven will match
any price it sets. Use Table 14-6 to answer the following question and assume
throughout that Sturdy Homes believes that My Haven will match any price it sets.

Refer to Table 14-6. What price will Sturdy Homes charge and what profit does Sturdy
Homes expect to make?
A) Price = $8,000; expected profit = $7 million
B) Price = $8,000; expected profit = $4 million
C) Price = $10,000; expected profit = $5 million
D) Price = $12,000; expected profit = $3 million
Which of the following is the best example of an oligopolistic industry?
A) the beef market
B) the pharmaceutical industry
C) public education
D) the beauty products industry
Suppose a monopolistically competitive firm sells 25 units at a price of $10. Calculate
its marginal revenue per unit of output if it sells 5 more units of output when it reduced
its price to $9.
A) $270

B) $20
C) $4
D) $2.50
Michael Spence proposed the signaling hypothesis. According to this hypothesis
A) workers signal their desire to work for a particular firm by the way they answer
questions in job interviews.
B) employers signal their preferences for the type of employee they wish to hire
through job ads and the questions they ask during job interviews.
C) employers view a college education as a signal that potential workers have certain
desirable qualities.
D) high wages are a signal that workers have skills that are highly valued by employers.
Why do convex indifference curve have a negative slope?
A) because consumers take market prices as given
B) because consumers face a budget constraint
C) because to keep utility constant, a consumer must get more of one good if she is to
give up some of the other

D) because scarcity implies that it is not possible to consume more of one good without
giving up some of the other
We can derive the market demand curve for gold earrings
A) only if the tastes of all gold earring consumers are similar.
B) by adding horizontally the individual demand curves of each gold earring consumer.
C) by adding vertically the quantity demanded of each gold earring consumed at each
price.
D) by adding the prices each gold earring consumer is willing to pay for each quantity.
Figure 13-10
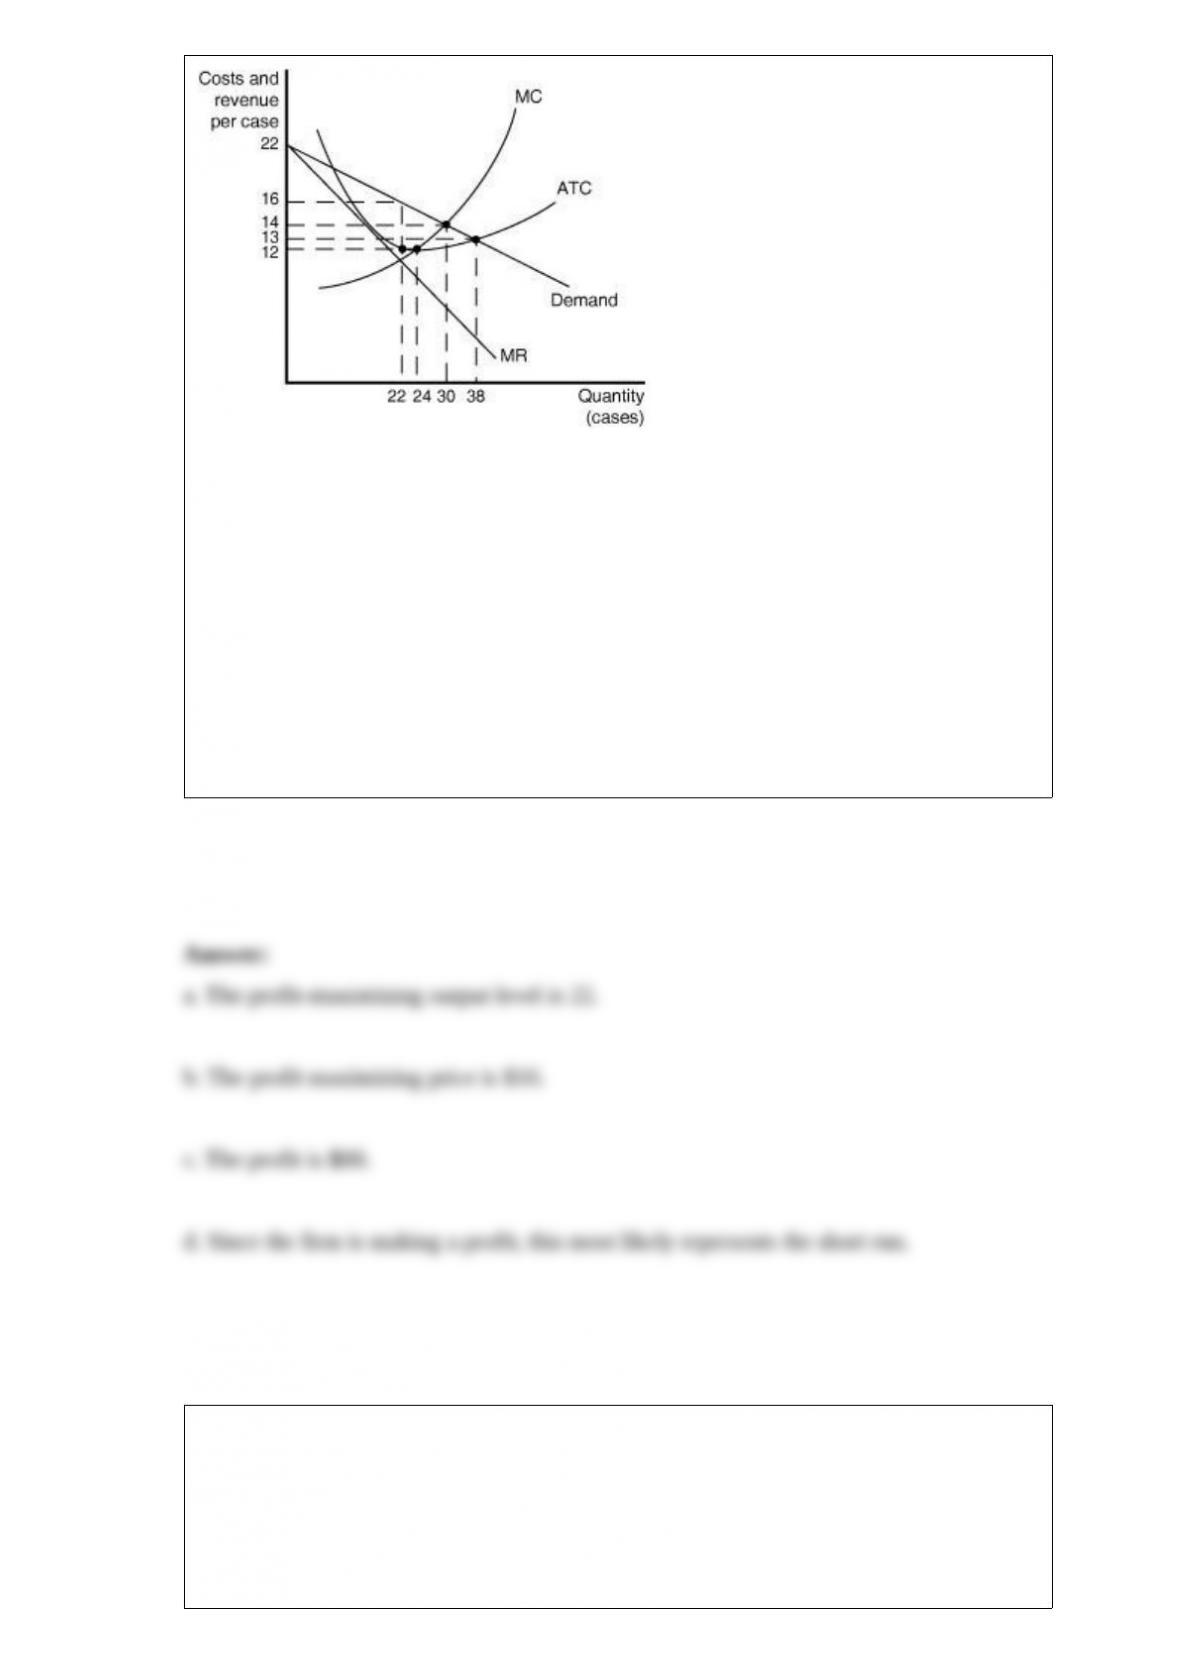
Figure 13-10 shows cost and demand curves for a monopolistically competitive
producer of iced tea.
Refer to Figure 13-10. to answer the following questions.
a. What is the profit-maximizing output level?
b. What is the profit-maximizing price?
c. At the profit-maximizing output level, how much profit will be realized?
d. Does this graph most likely represent the long run or the short run? Why?
________ place limits on the quantity of a product being imported.
A) Embargoes
B) Trade blocs

C) Nontariff barriers
D) Anti-dumping duties
If the price of hairspray is represented by equation P = 10 – 0.2 QD, then the
corresponding quantity of hairspray demanded is represented by the equation
A) QD = 5P – 2.
B) QD = 0.5P + 2.
C) QD = 50 -5P.
D) QD = -10 + 0.2P.
Figure 15-9
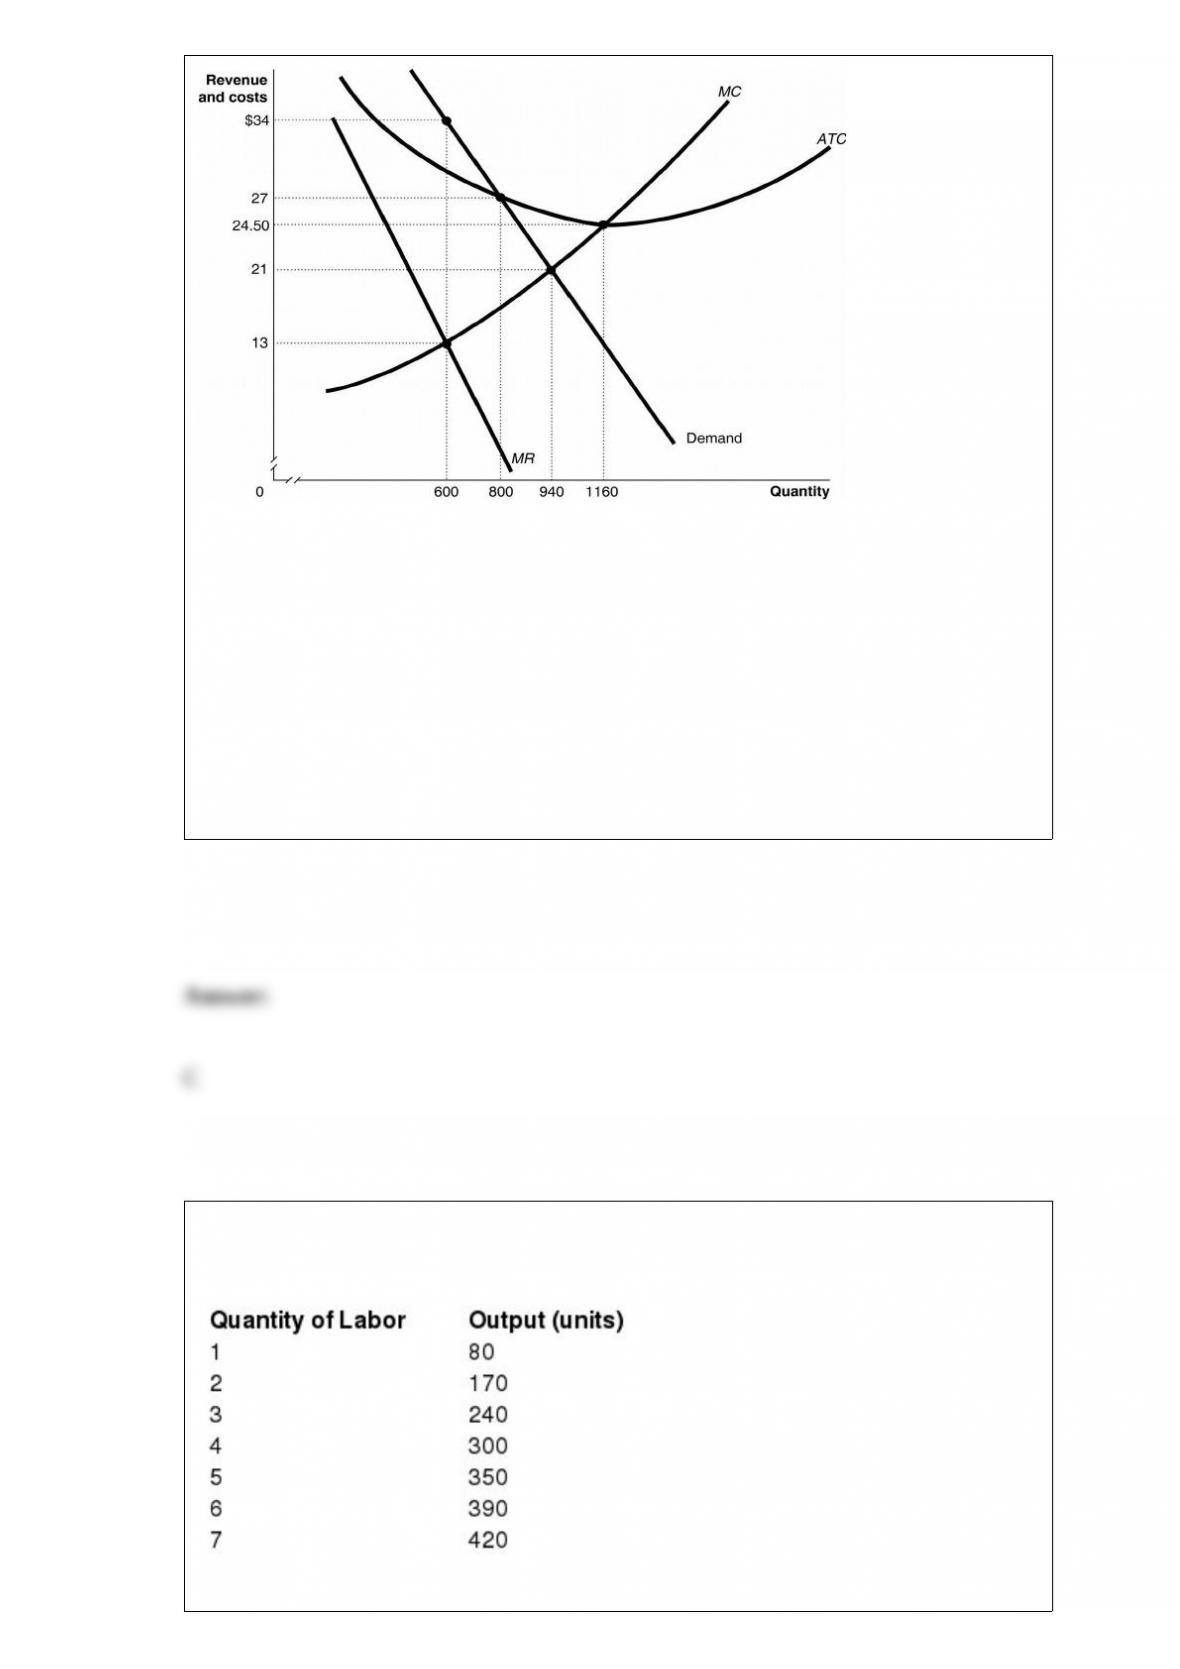
Figure 15-9 shows the demand and cost curves for a monopolist.
Refer to Figure 15-9. What is the economically efficient output level?
A) 600 units
B) 800 units
C) 940 units
D) 1160 units
Table 17-1
Refer to Table 17-1. If the output price is $3, what is the marginal revenue product of
the fifth unit of labor?
A) $1,050
B) $360
C) $210
D) $150
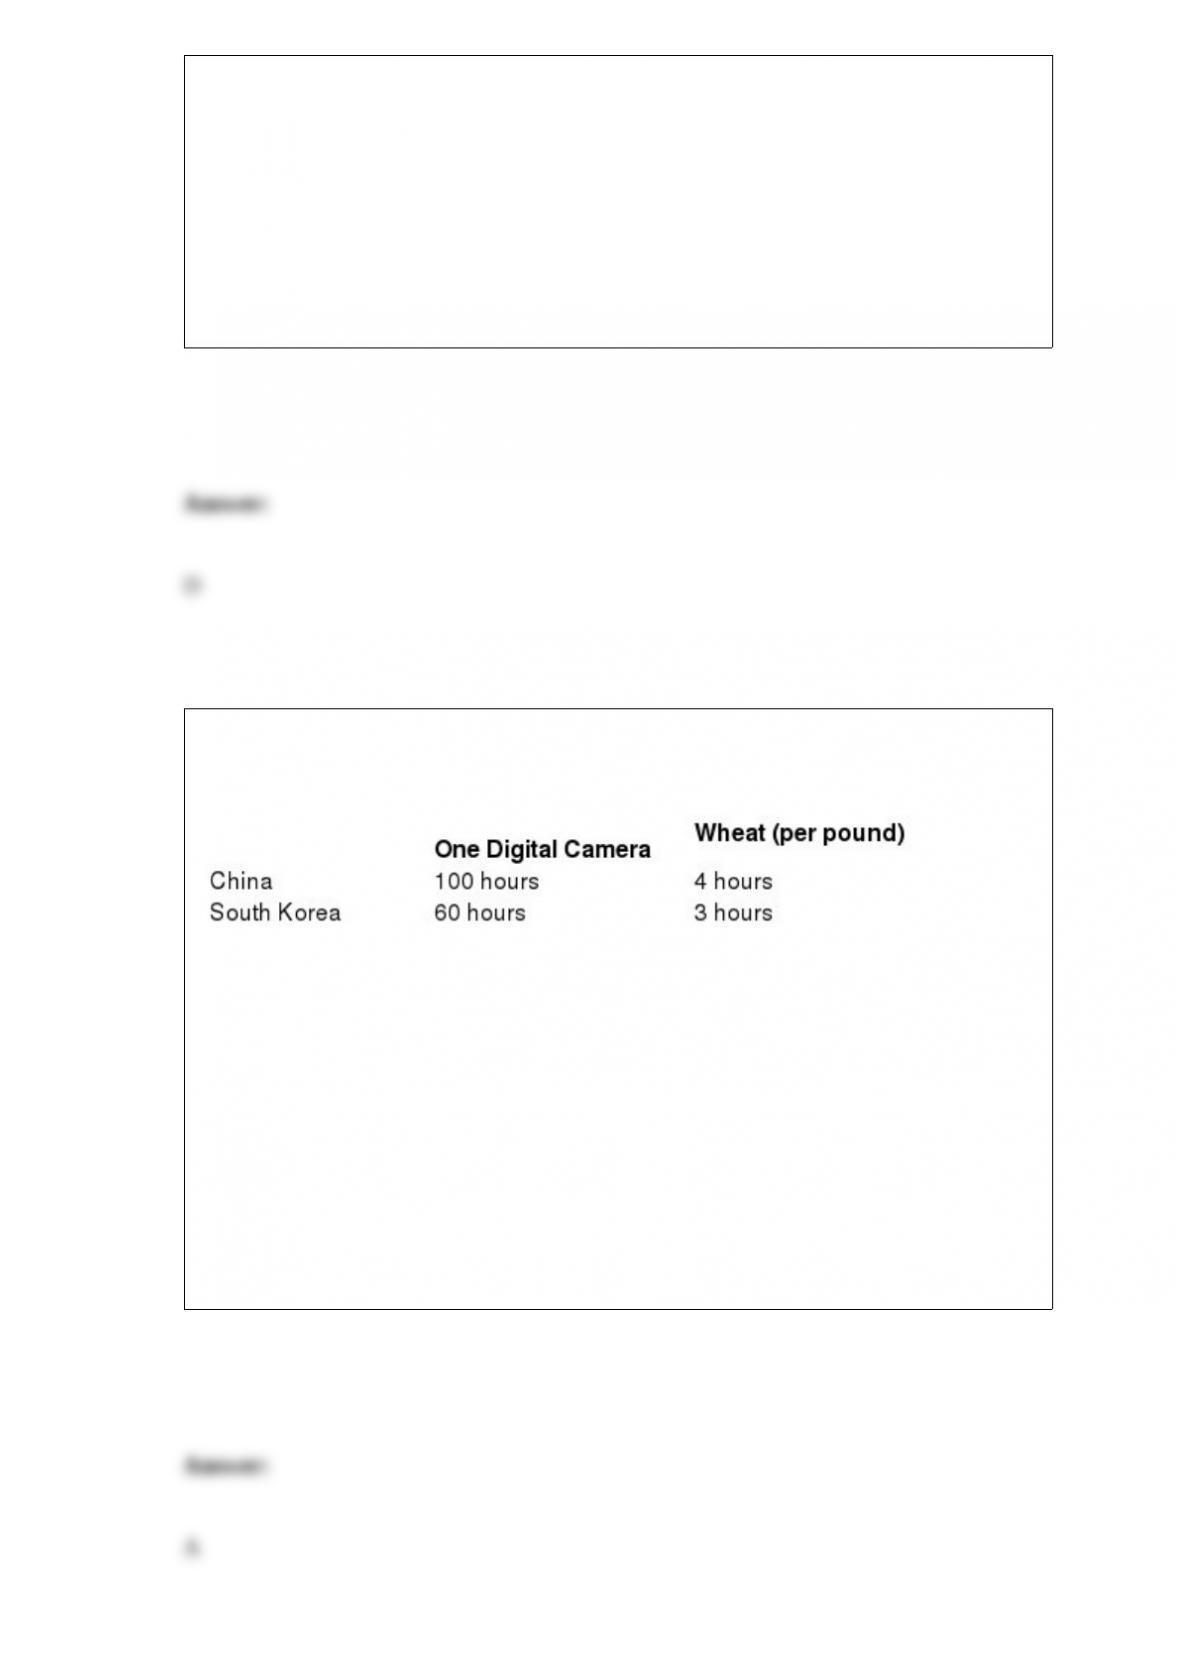
Table 2-8
Table 2-8 shows the number of labor hours required to produce a digital camera and a
pound of wheat in China and South Korea.
Refer to Table 2-8. China has a comparative advantage in the production of
A) wheat.
B) digital cameras.
C) both products.
D) neither product.

In 1930, the U.S. government attempted to help domestic firms that were harmed by the
Great Depression by
A) establishing the General Agreement on Tariffs and Trade (GATT).
B) passing the Smoot-Hawley Tariff.
C) establishing the World Trade Organization (WTO).
D) passing the North American Free Trade Agreement (NAFTA).
Exemptions and deductions are used
A) to add to taxes that must be paid.
B) by taxpayers to reduce the amount of income subject to tax.
C) to determine the type of tax structure.
D) to determine what items are subject to sales taxes.
An increase in the wage rate causes
A) a rightward shift of the firm’s labor demand curve.
B) a leftward shift of the firm’s labor demand curve.
C) a decrease in the quantity of labor demanded.
D) an increase in labor’s marginal productivity.
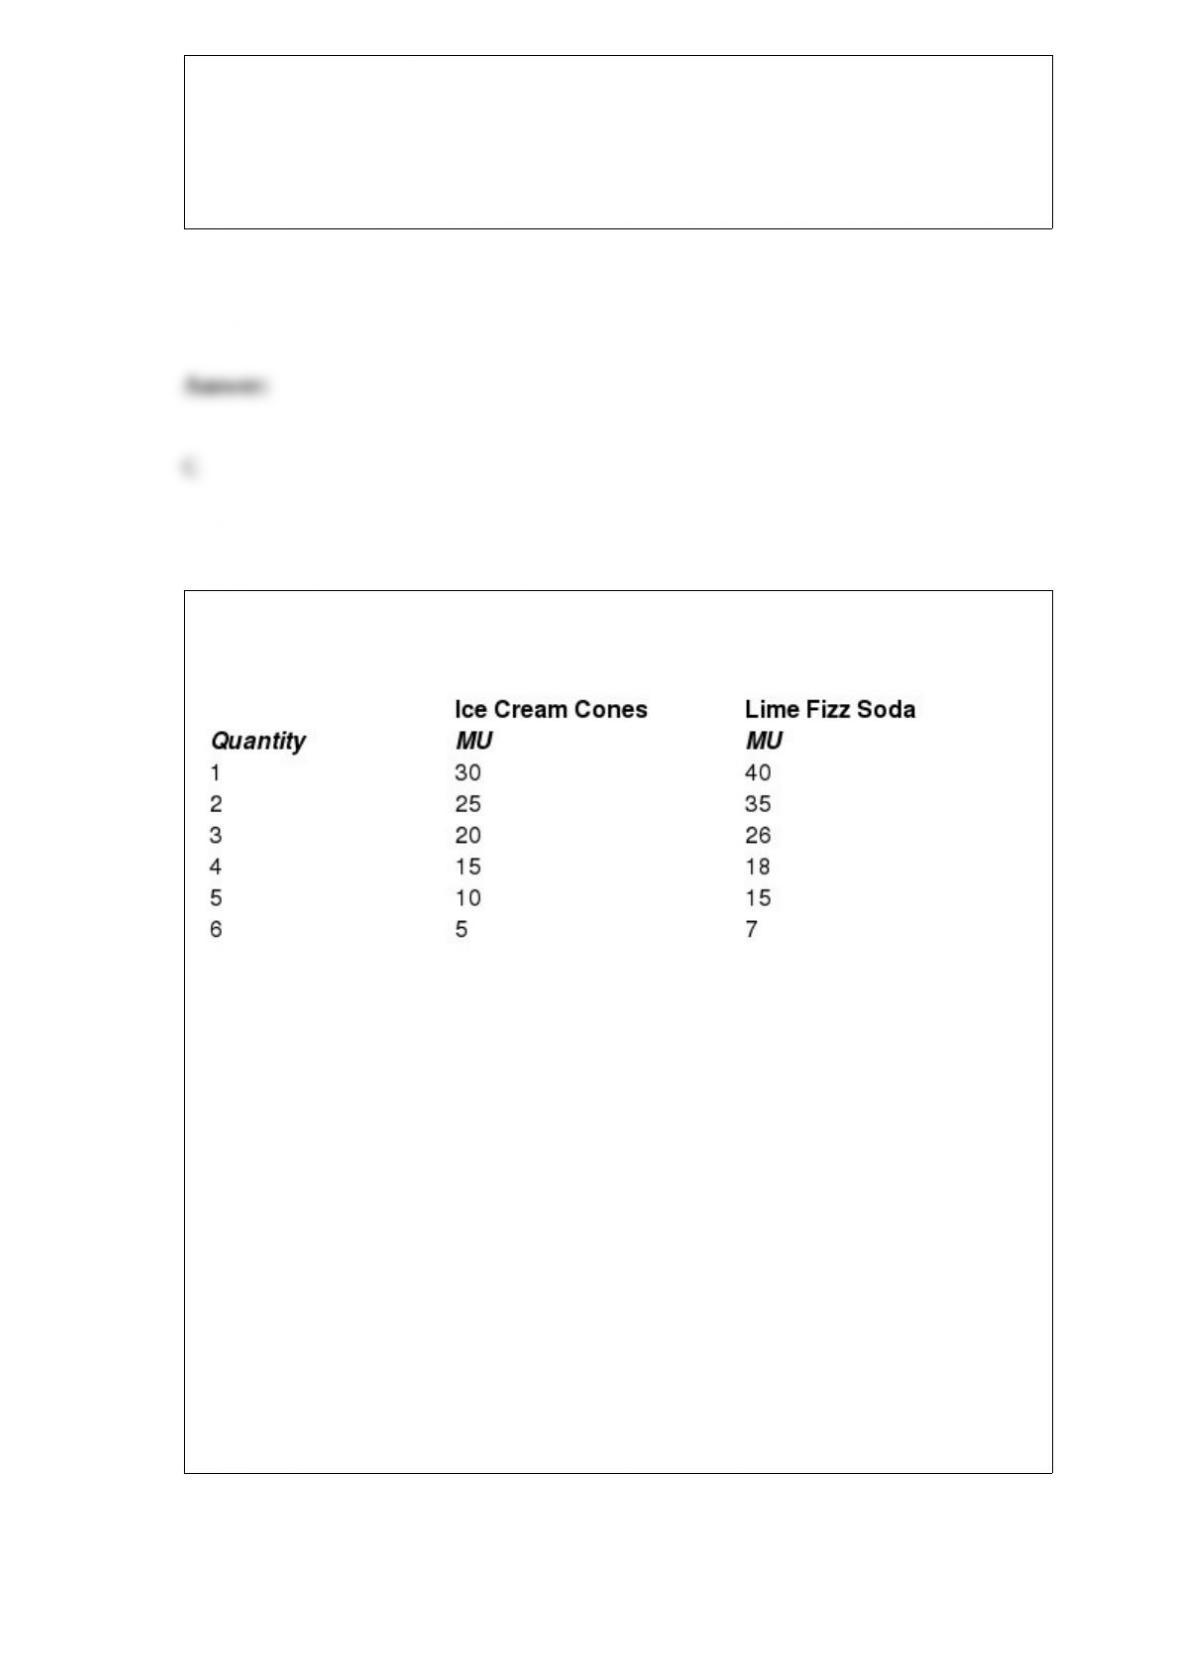
Table 10-3
Refer to Table 10-3. The table above shows Lee’s marginal utility per dollar from
consuming ice cream cones and cans of Lime Fizz Soda. The price of an ice cream cone
is $2 and the price of Lime Fizz Soda is $1. Use this information to select the correct
statement.
A) We cannot determine how many ice cream cones and cans of Lime Fizz Soda Lee
will consume without knowing what his income is.
B) To maximize his utility Lee should consume 1 ice cream cone and 5 cans of Lime
Fizz Soda.
C) We cannot determine how many ice cream cones and cans of Lime Fizz Soda will
maximize Lee’s utility because we are given only the marginal utility per dollar values.
We also need to know the marginal utility for each quantity.
D) If Lee has an unlimited budget he will maximize his utility by buying only Lime
Fizz Soda.

Perfect price discrimination is also known as
A) monopoly.
B) first-degree price discrimination.
C) third-degree price discrimination.
D) yield management.
Leisure is
A) an inferior good.
B) a complementary good to labor.
C) wasteful to society.
D) a normal good.