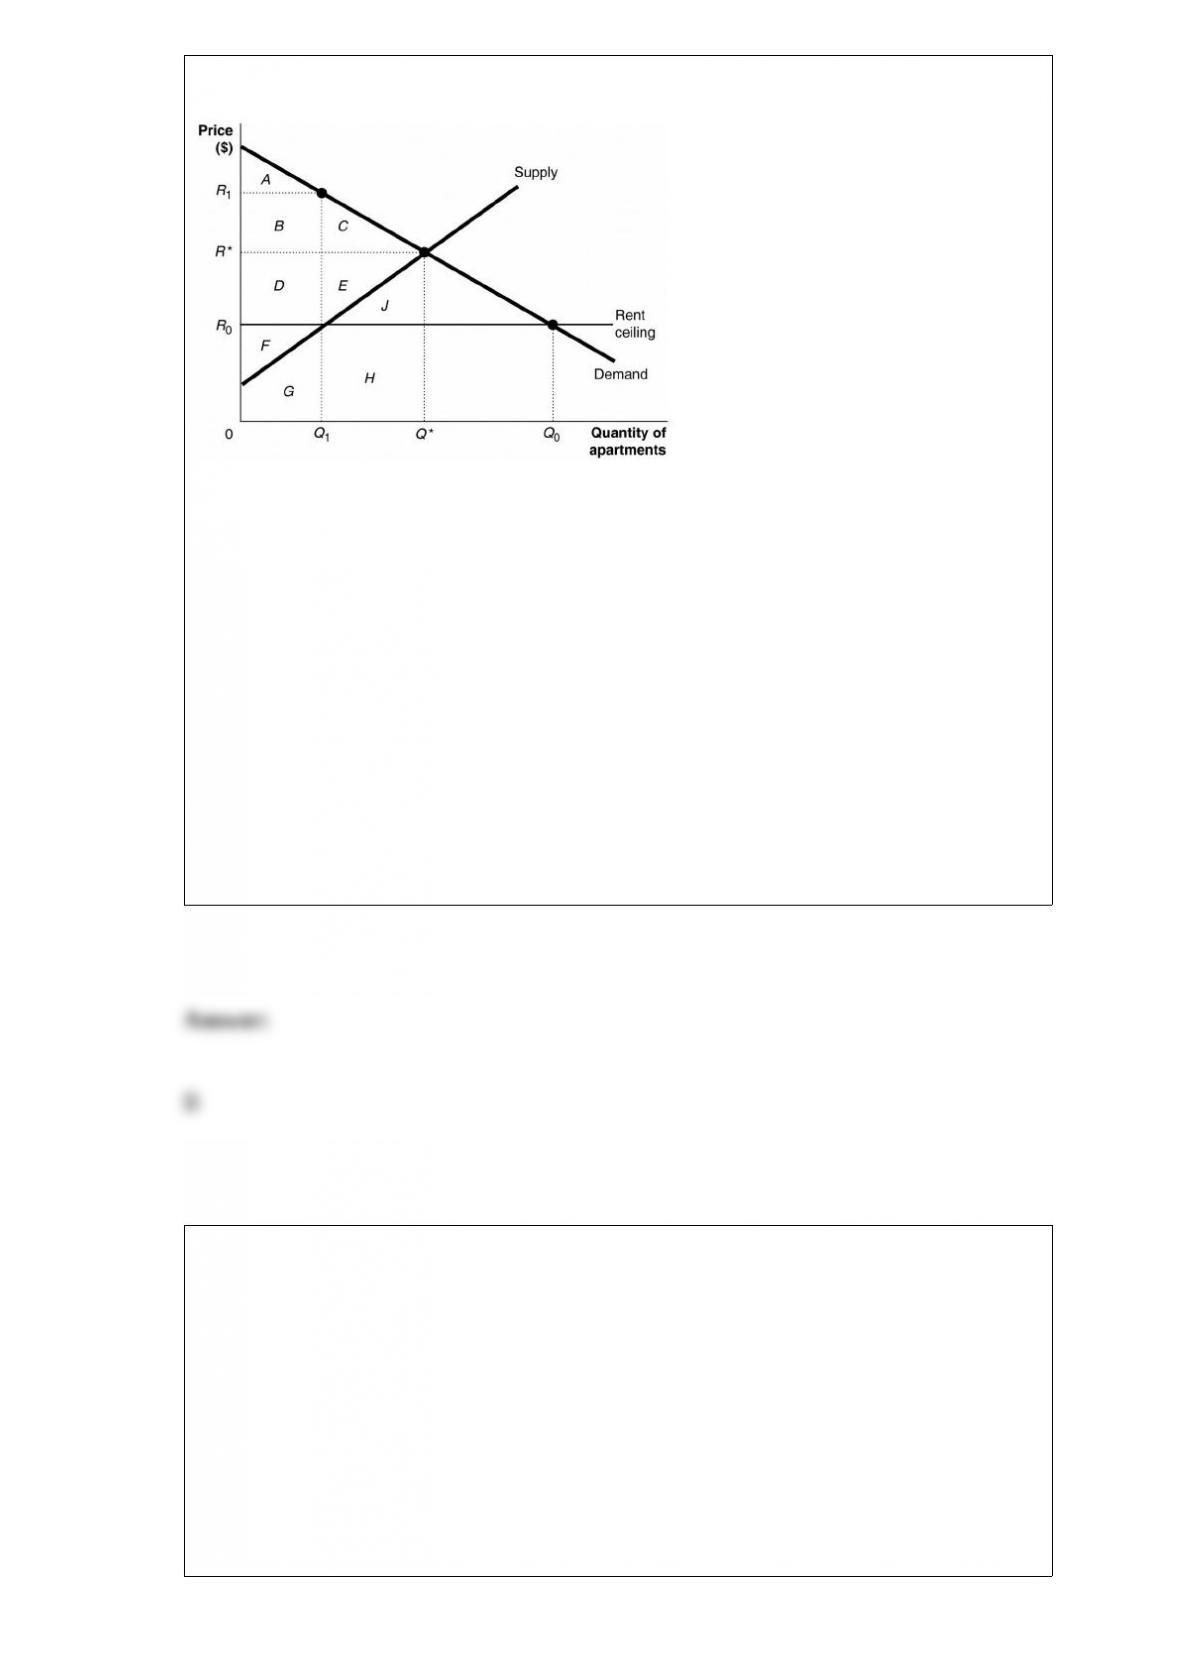
Figure 4-5
Figure 4-5 shows the market for apartments in Bay City. Recently, the government
imposed a rent ceiling at R0.
Refer to Figure 4-5. Suppose that instead of a price ceiling, the government imposed a
price floor of R1. What is the area representing the portion of consumer surplus
transferred to producers as a result of the price floor?
A) A
B) B
C) B + C
D) A + B
In 2013, the dividend yield on Abercrombie & Fitch (ANF) stock rose from a low of
1.33% in May to 2.24% in October. Which of the following would have generated that
result?
A) The closing price of ANF stock rose.
B) ANF announced an increase in the dividend it would pay per share.
C) The price-earnings ratio fell.
D) ANF issued bonds with a coupon rate equal to 2.24%.

If the absolute value of the tax multiplier equals 1.6, real GDP is $13 trillion, and
potential real GDP is $13.4 trillion, then taxes would need to be cut by ________ to
restore the economy to potential real GDP.
A) $250 billion
B) $400 billion
C) $640 billion
D) None of the above are correct. Taxes should be increased in this case.
In response to already low interest rates doing little to stimulate the economy, the Fed
began buying 10-year Treasury notes and certain mortgage-backed securities to keep
interest rates low. This policy is known as
A) inflation targeting.
B) contractionary monetary policy.
C) securities-bubble deflating.
D) quantitative easing.

A bond is a financial security that represents
A) ownership in a corporation.
B) the portion of profits paid to shareholders.
C) the interest rate paid on a share of stock.
D) a promise to repay a fixed amount of funds.
The monetary growth rule is a plan for increasing the quantity of money
A) at a fixed rate that does not respond to changes in the economic condition.
B) at a rate which increases as the economy grows.
C) at a rate which decreases as the economy declines.
D) at a rate which increases during recessions and decreases during expansions.
Which of the following is counted as “capital” in economics?
A) the money people have
B) the machines workers have to work with
C) the accumulated skills and training workers have
D) the wealth people have
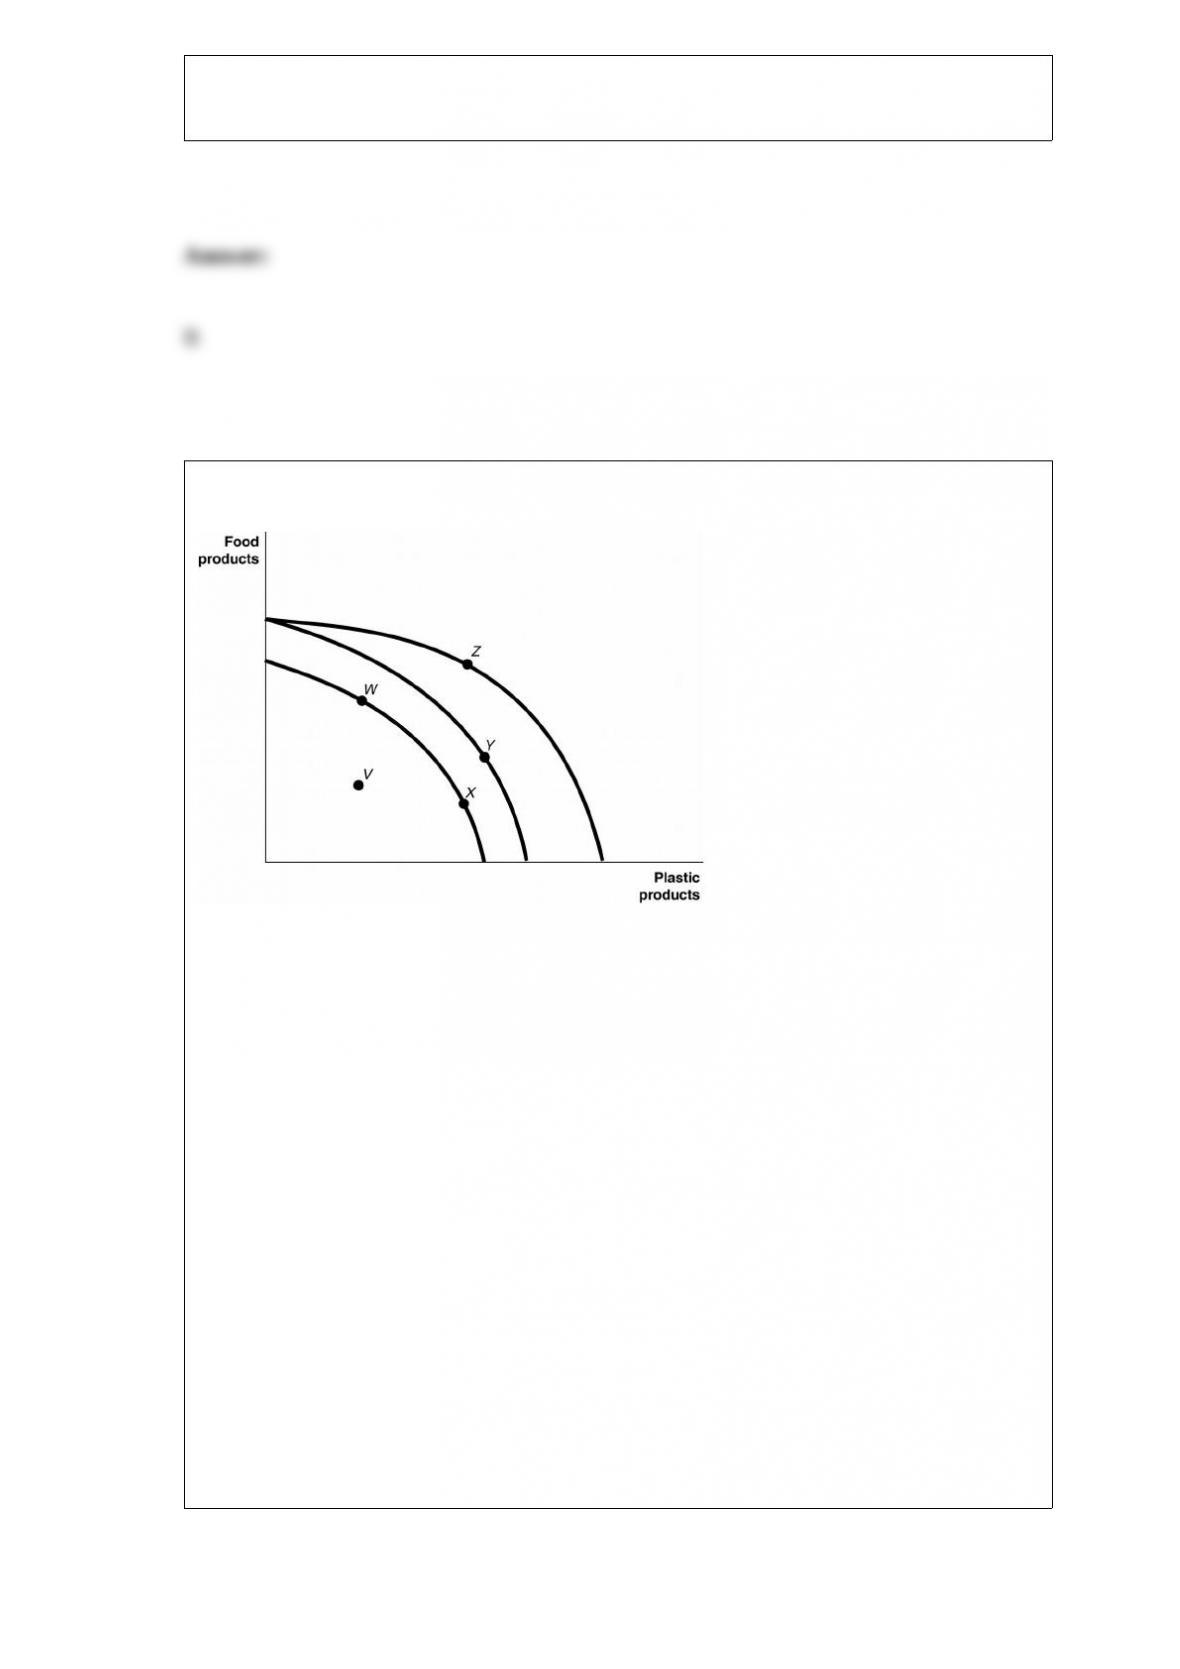
Figure 2-4
Figure 2-4 shows various points on three different production possibilities frontiers for
a nation.
Refer to Figure 2-4. Consider the following events:
a. an increase in the unemployment rate
b. general technological advancement
c. an increase in consumer wealth
Which of the events listed above could cause a movement from Z to V ?
A) a only
B) a and b only
C) b and c only
D) a, b, and c
Imagine that you borrow $5,000 for one year and at the end of the year you repay the
$5,000 plus $600 of interest. If the inflation rate was 4%, what was the real interest rate
you paid?
A) 16 percent
B) 12 percent
C) 8 percent
D) 6 percent
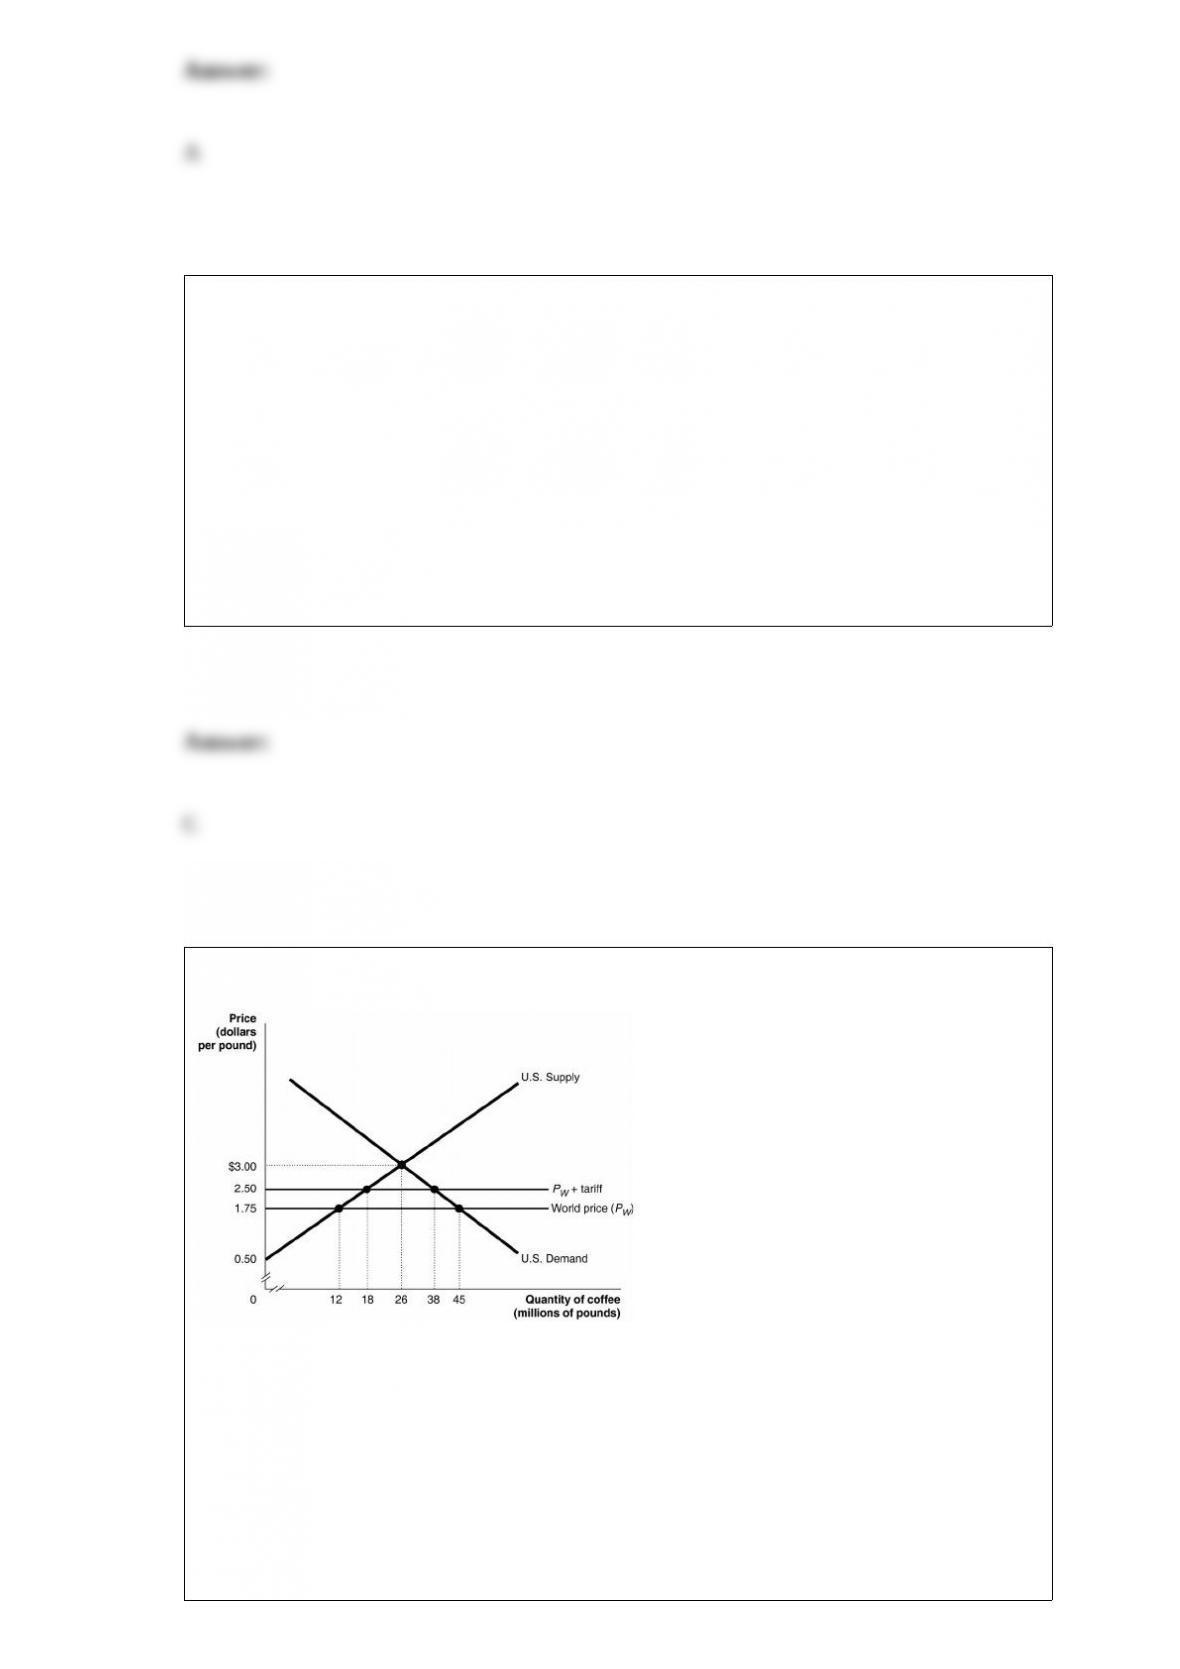
Figure 7-2
Suppose the U.S. government imposes a $0.75 per pound tariff on coffee imports.
Figure 7-2 shows the impact of this tariff.
Refer to Figure 7-2. Without the tariff in place, the United States produces
A) 12 million pounds of coffee.
B) 26 million pounds of coffee.
C) 33 million pounds of coffee.
D) 45 million pounds of coffee.
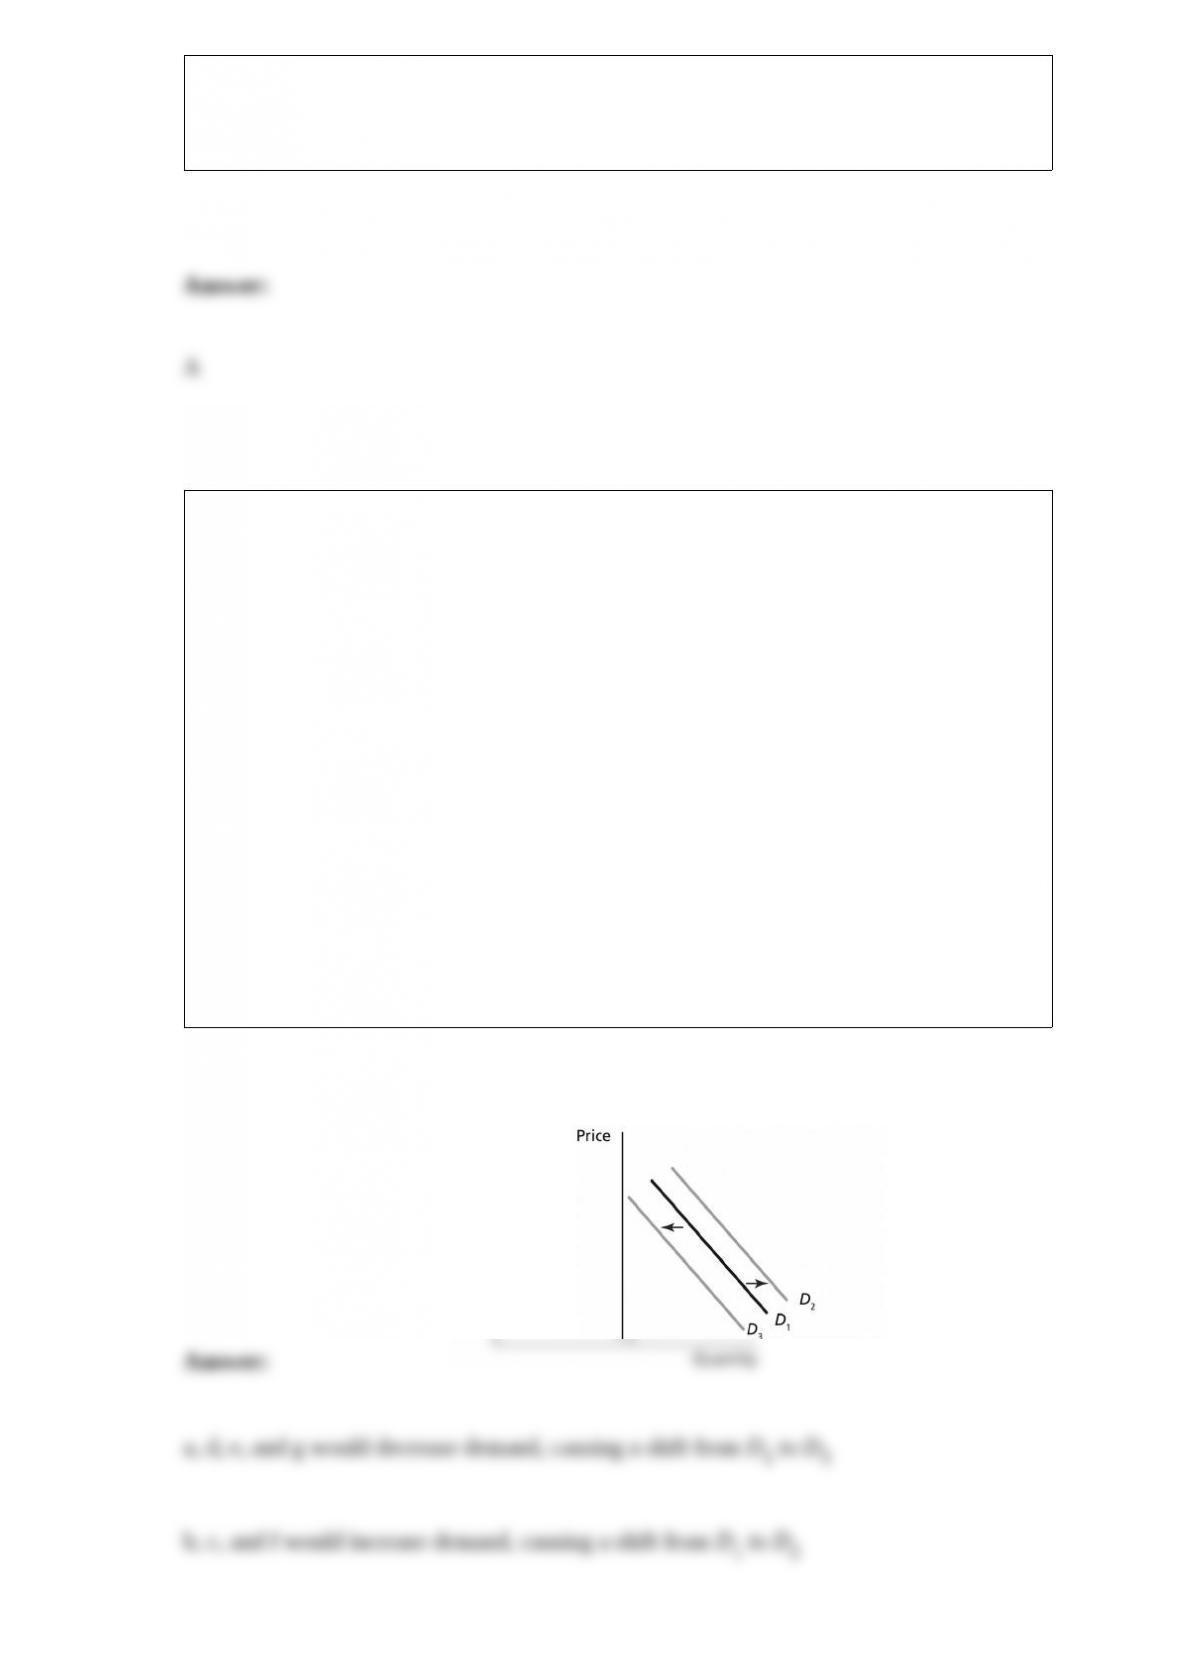
Draw a demand curve and label it D1. On the graph, illustrate an increase in demand
and a decrease in demand, and label the curves D2 and D3, respectively. Starting on
demand curve D1, explain the shift that would result from each of the following events:
a. a decrease in income and the good is a normal good
b. a decrease in income and the good is an inferior good
c. an increase in the price of a substitute good
d. an increase in the price of a complementary good
e. a decrease in the taste for the good
f. an increase in population
g. a decrease in the expected future price of the good
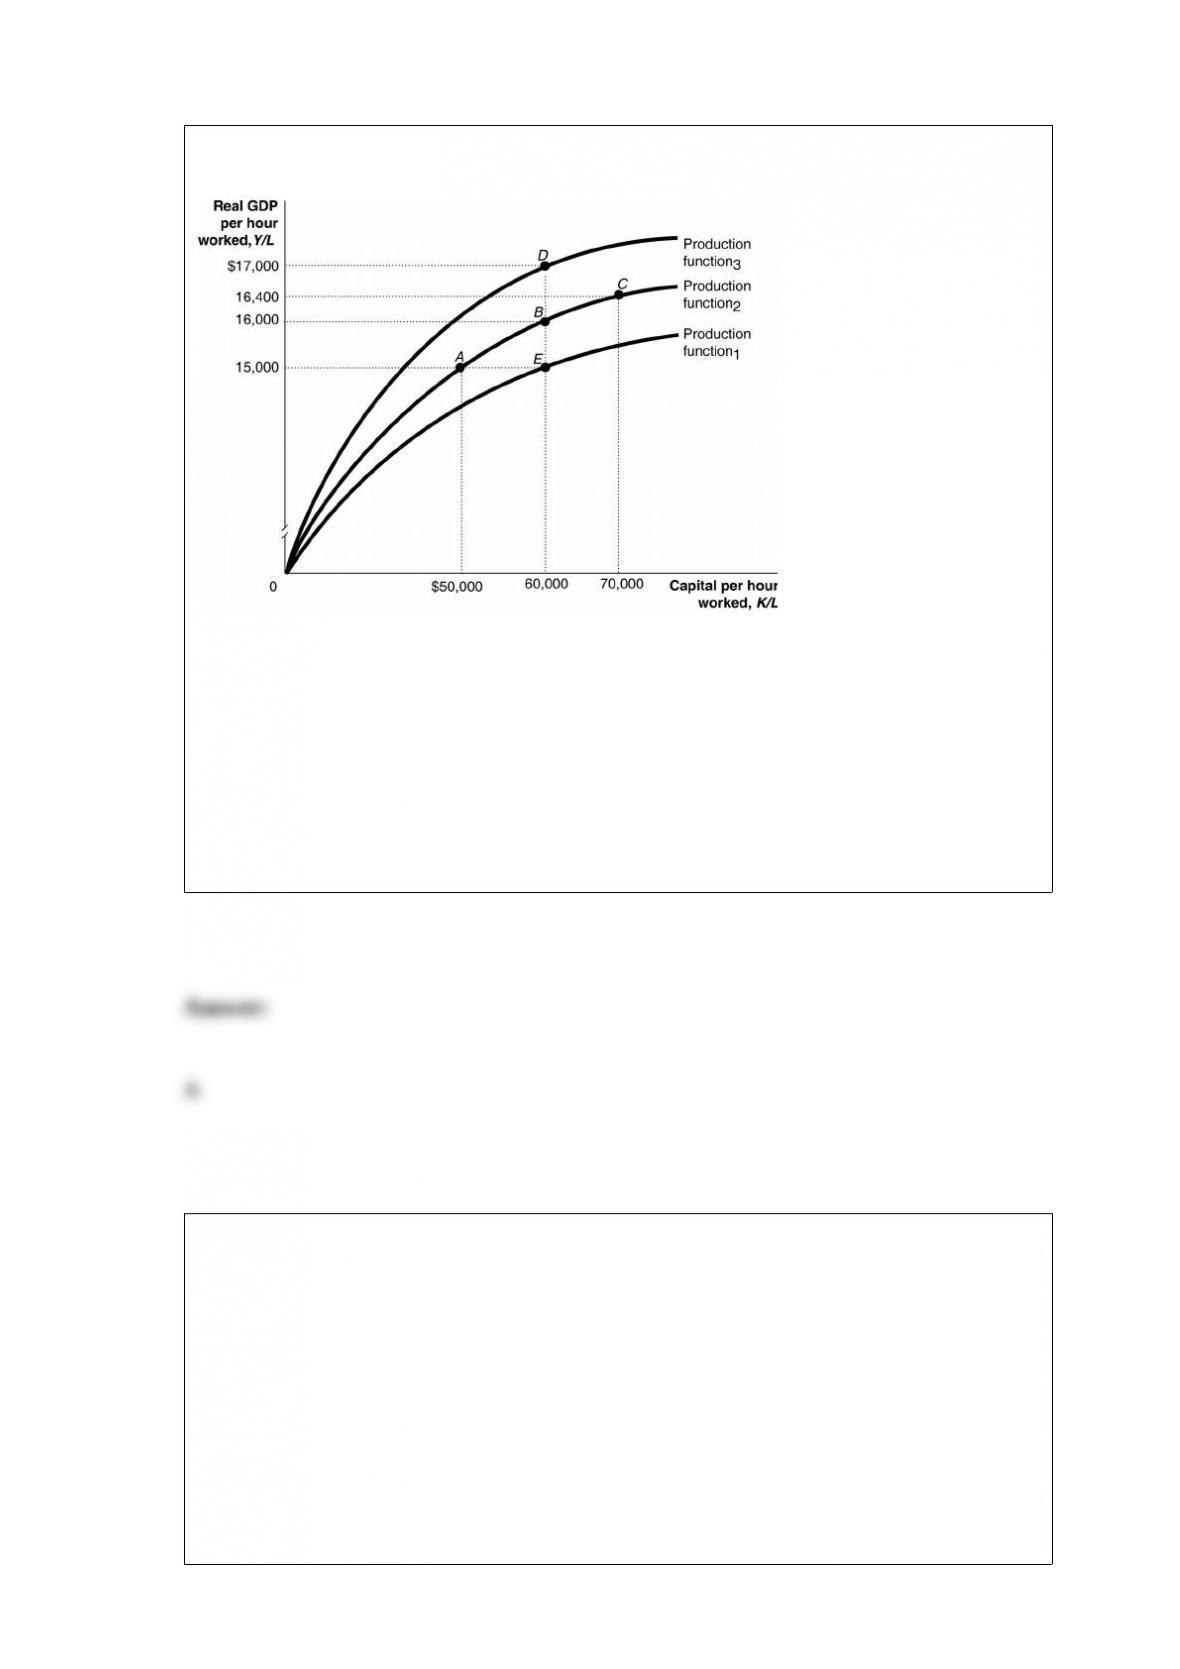
Figure 11-4
Refer to Figure 11-4. The movement from E to B to D in the figure above illustrates
A) an improvement in technology.
B) a decline in capital per worker.
C) diminishing returns to capital.
D) diminishing returns to labor.
How will the exchange rate (foreign currency per dollar) respond to an increase in
preference for imported goods in the United States in the long run?
A) Exchange rates will rise.
B) Exchange rates will fall.
C) Exchange rates will be unaffected by changes in the relative rate of productivity
growth in the United States, both in the short run and in the long run.
D) The exchange rate will be affected in the short run, but not in the long run.

If the price of milk was $1.25 a gallon and it is now $2.25 a gallon, what is the
percentage change in price?
A) 4.4 percent
B) 8 percent
C) 44 percent
D) 80 percent