
Figure 7-8 shows three different cost curves, labeled A, B, and C. Which of these
curves is most likely to represent marginal cost?
Production is productively efficient when
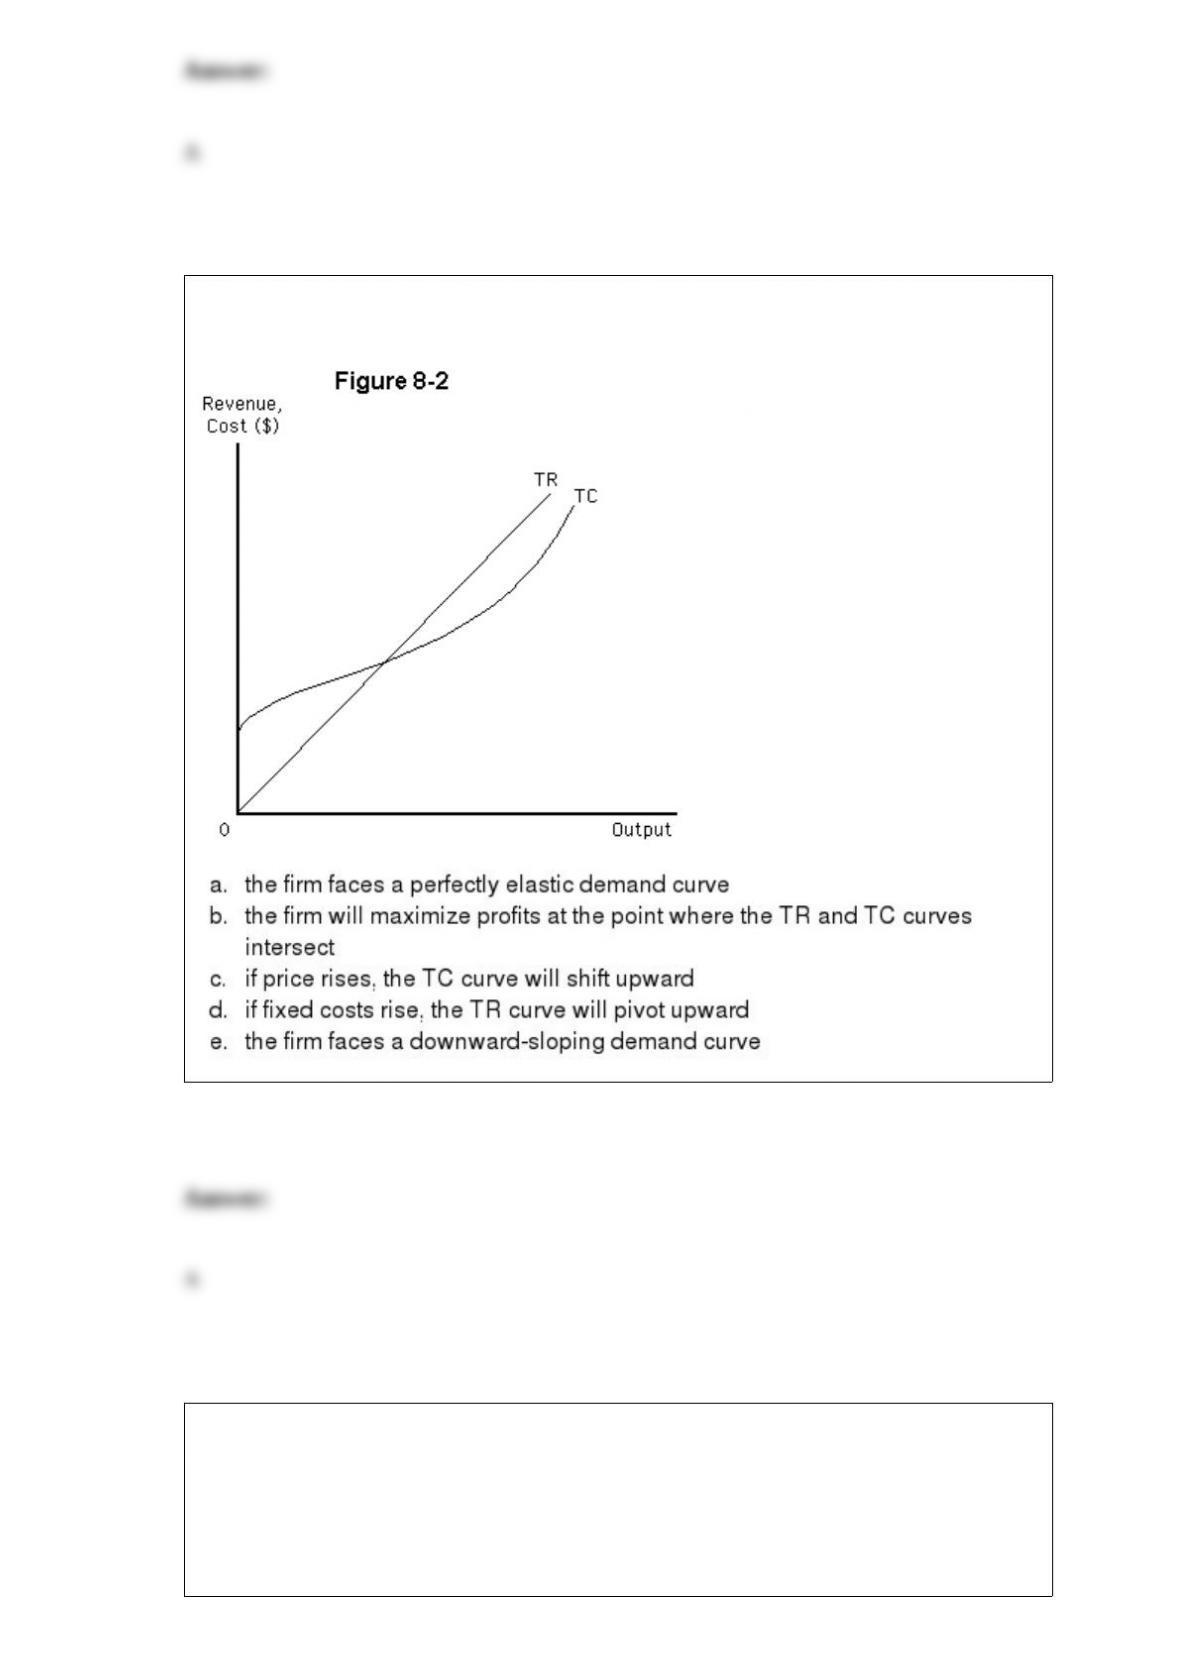
What can be said about the firm shown in Figure 8-2?
What is the equilibrium condition in the loanable funds market?
a. S + G = IP– T
b. S = IP+ T – G
c. S + IP= G – T
d. S – T = IP+ G

e. S = IP+ G – T
Suppose the Dow Jones Industrial Average has risen for three days in a row. According
to the efficient markets theory of stock prices,
Which of the following best describes the aggregate production function if output is
measured on the vertical axis and the number of workers employed is measured on the
horizontal axis? The curve is
a. downward sloping and becomes flatter as the number of workers employed increases
b. downward sloping and becomes steeper as the number of workers employed
increases
c. downward sloping with the same slope throughout
d. upward sloping and becomes steeper as the number of workers employed increases
e. upward sloping and becomes flatter as the number of workers employed increases
Which of the following statements is accurate?
a. When unplanned inventory changes are positive, GDP is below its equilibrium value
b. When unplanned inventory changes are negative, GDP is above its equilibrium value
c. When unplanned inventory changes are positive, GDP is at its equilibrium value
d. When unplanned inventory changes are negative, GDP is below its equilibrium value
e. None of the above
If the demand curve is a horizontal line,
If Americans became more pessimistic about the economy, what would happen to the
consumption-income line?
a. A rightward movement along the line
b. A leftward movement along the line
c. The entire line would shift upward
d. The entire line would shift downward
e. The entire line would shift downward and there would be a rightward movement
along the new line
Which of the following would be an example of a flow variable?