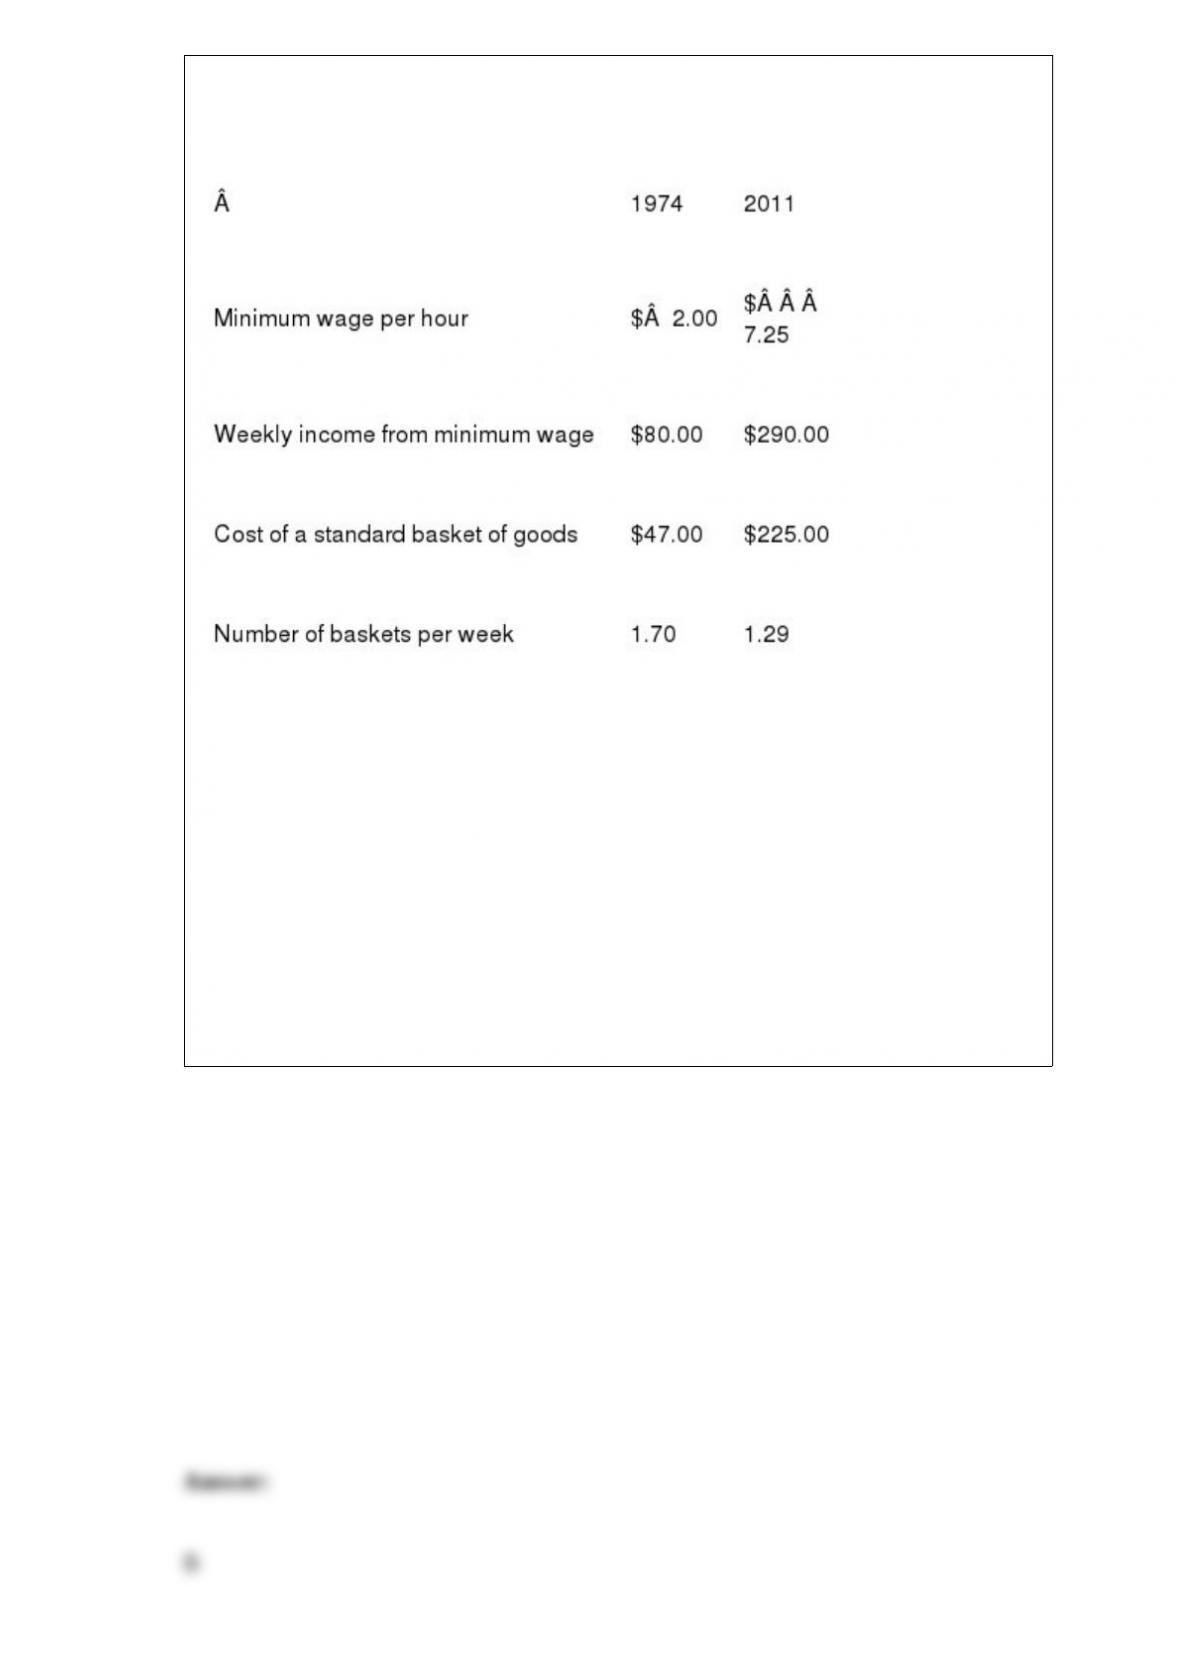
Table 2.5
Refer to the table above. By what percentage did the federal minimum wage increase
from 1974 to 2011?
A) 72.41 percent
B) 262.5 percent
C) 362.5 percent
D) 525.0 percent
If the tariffs on the textiles, apparel items and footwear mentioned in the Application
were replaced by equivalent voluntary export restraints (VERs), low-income consumers
would probably
A) be better off.
B) be worse off.
C) be no better nor worse off.
D) not be subject to the VERs.
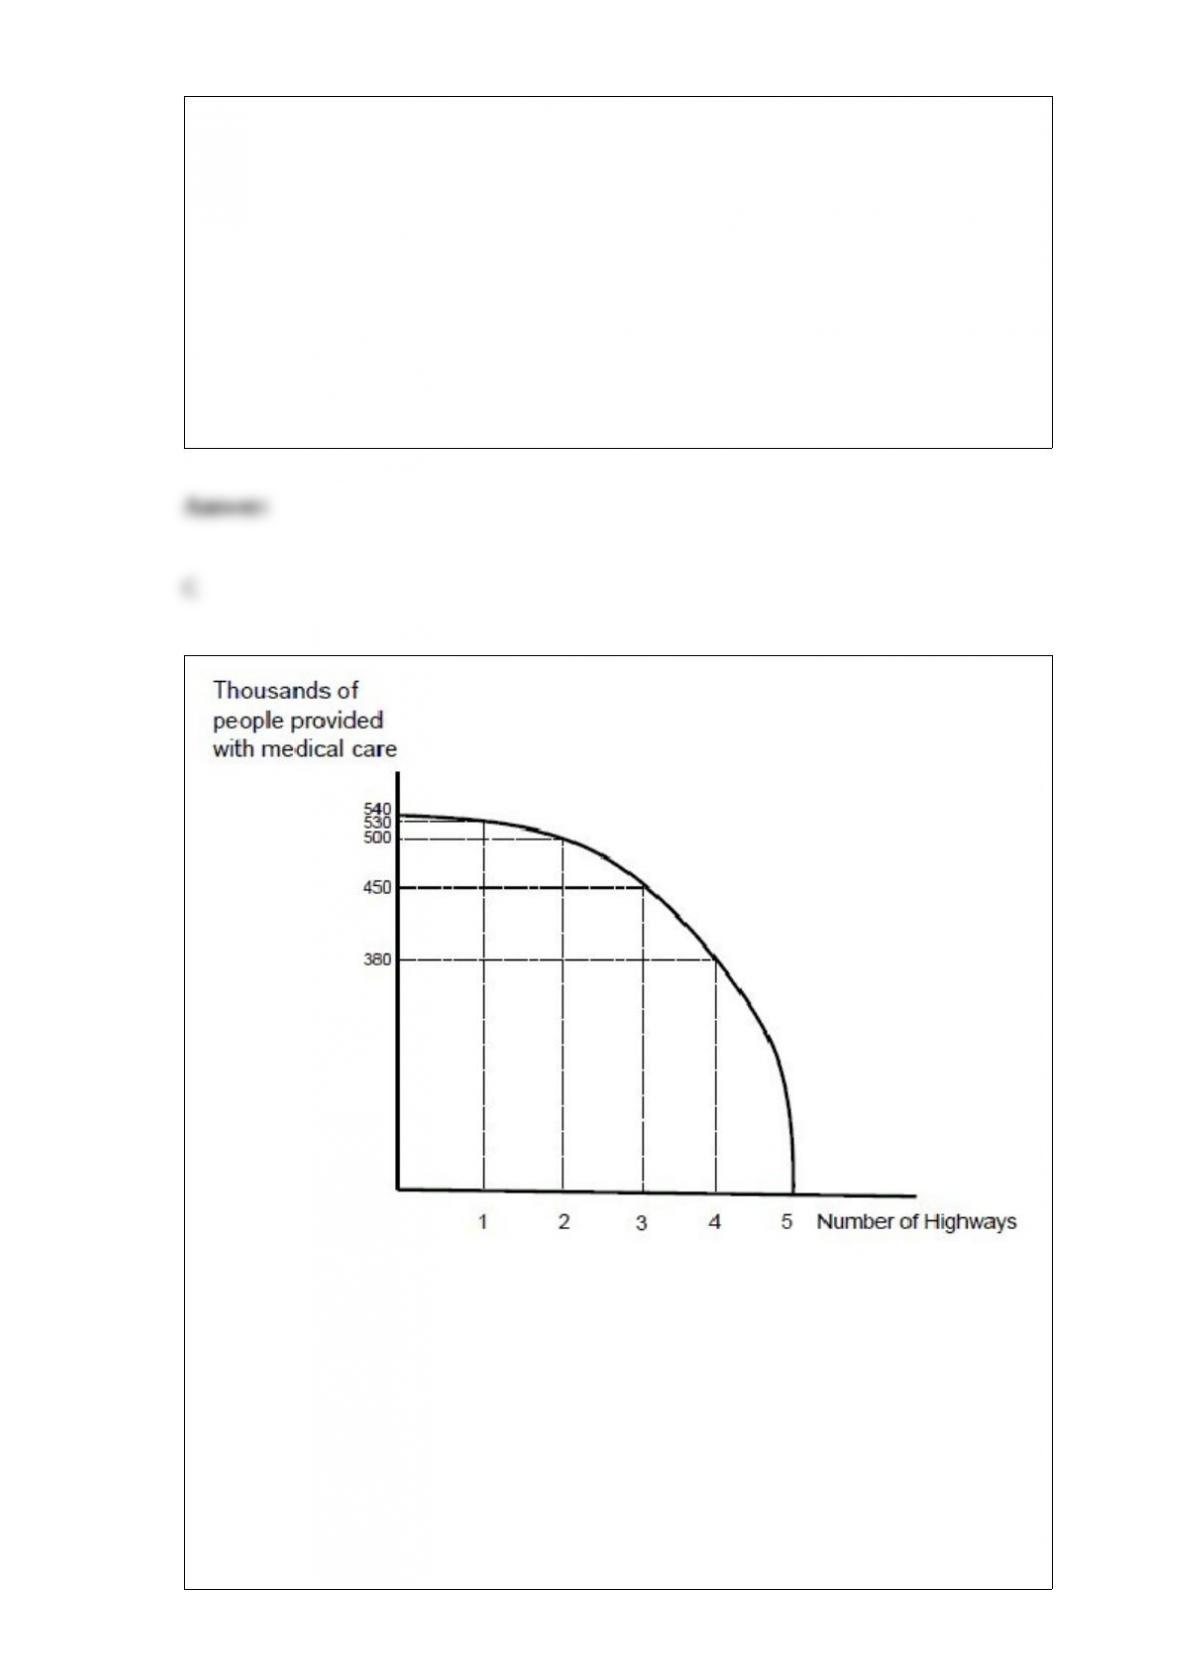
Figure 2.2
Figure 2.2 presents a production possibilities curve for a country that can either produce
highways or provide people with medical care in a given year. The opportunity cost of
the third new highway built in a year is:
A) 10,000 people provided with medical care.
B) 50,000 people provided with medical care.
C) 90,000 people provided with medical care.
D) 450,000 people provided with medical care.
Congress increases government spending. This is an example of:
A) monetary policy.
B) supply-side policy.
C) fiscal policy.
D) incomes policy.
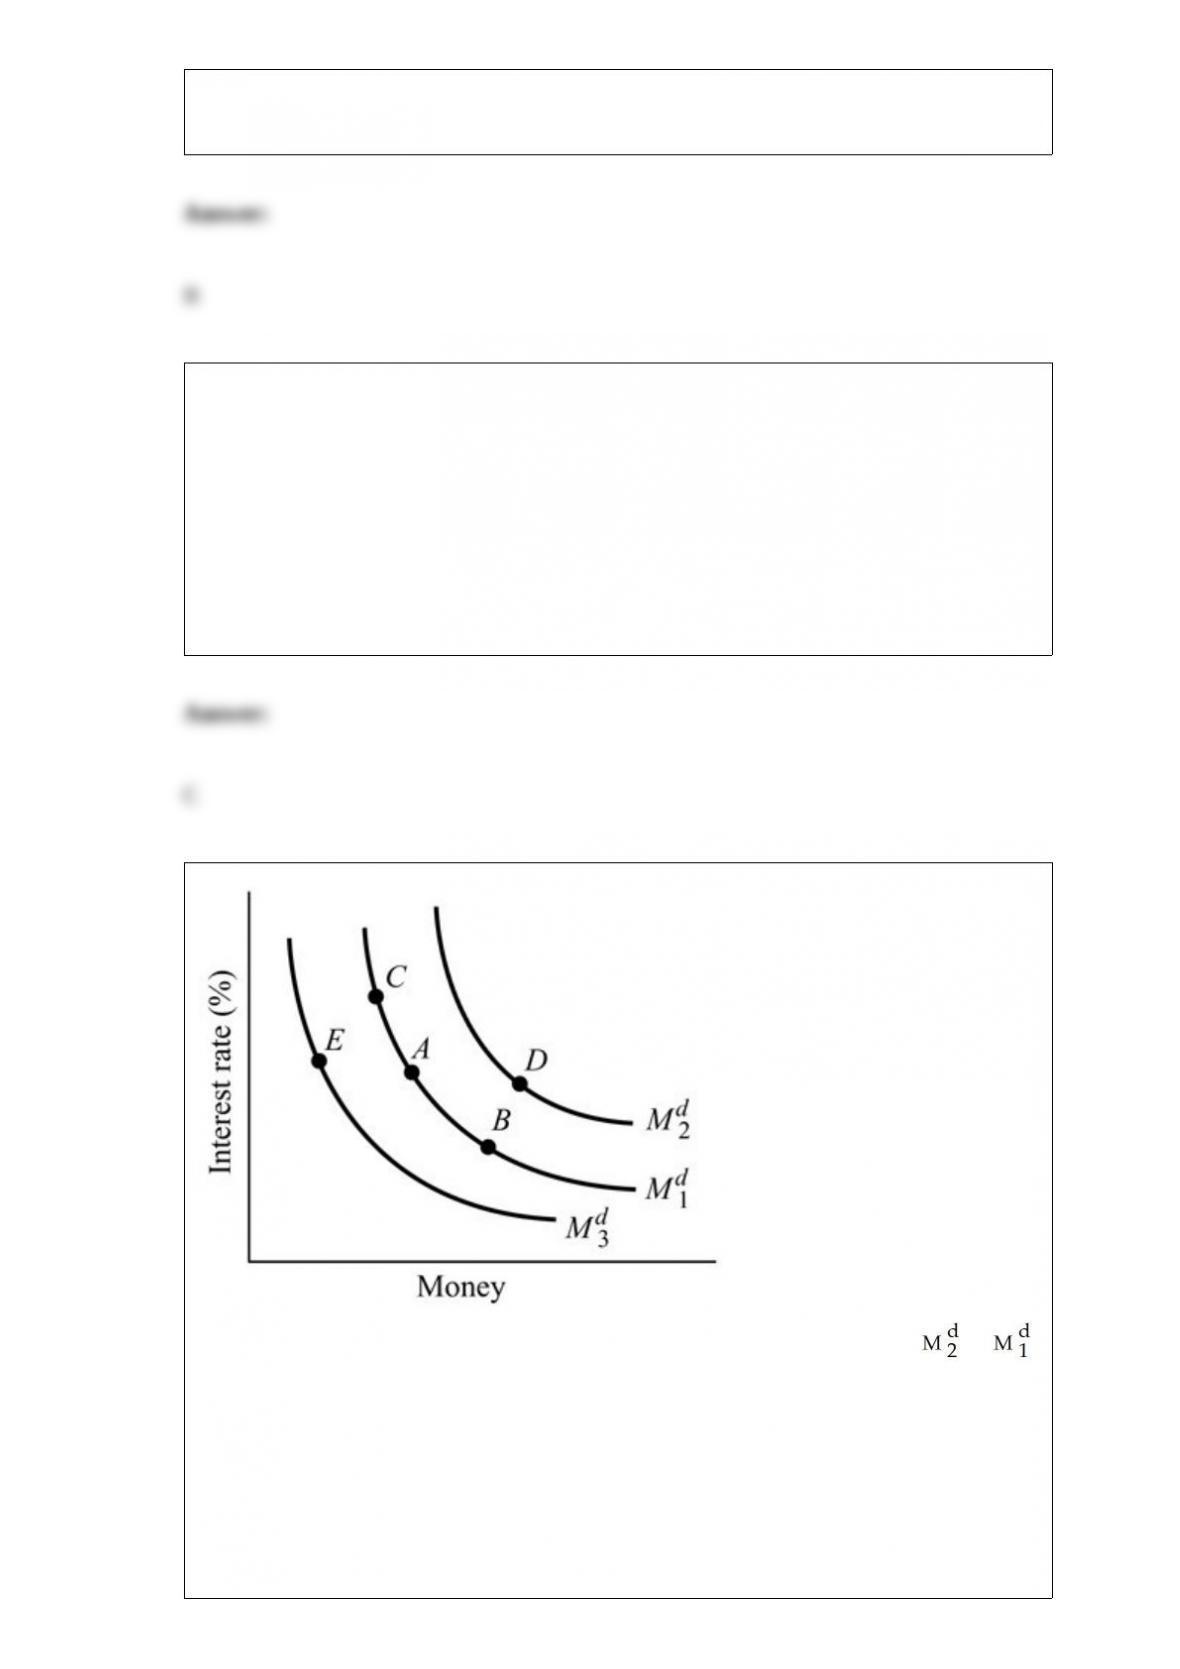
Figure 14.1 Refer to Figure 14.1. The money demand curve will shift from to
if:
A) the price level decreases.
B) income increases.
C) interest rates fall.
D) interest rates rise.
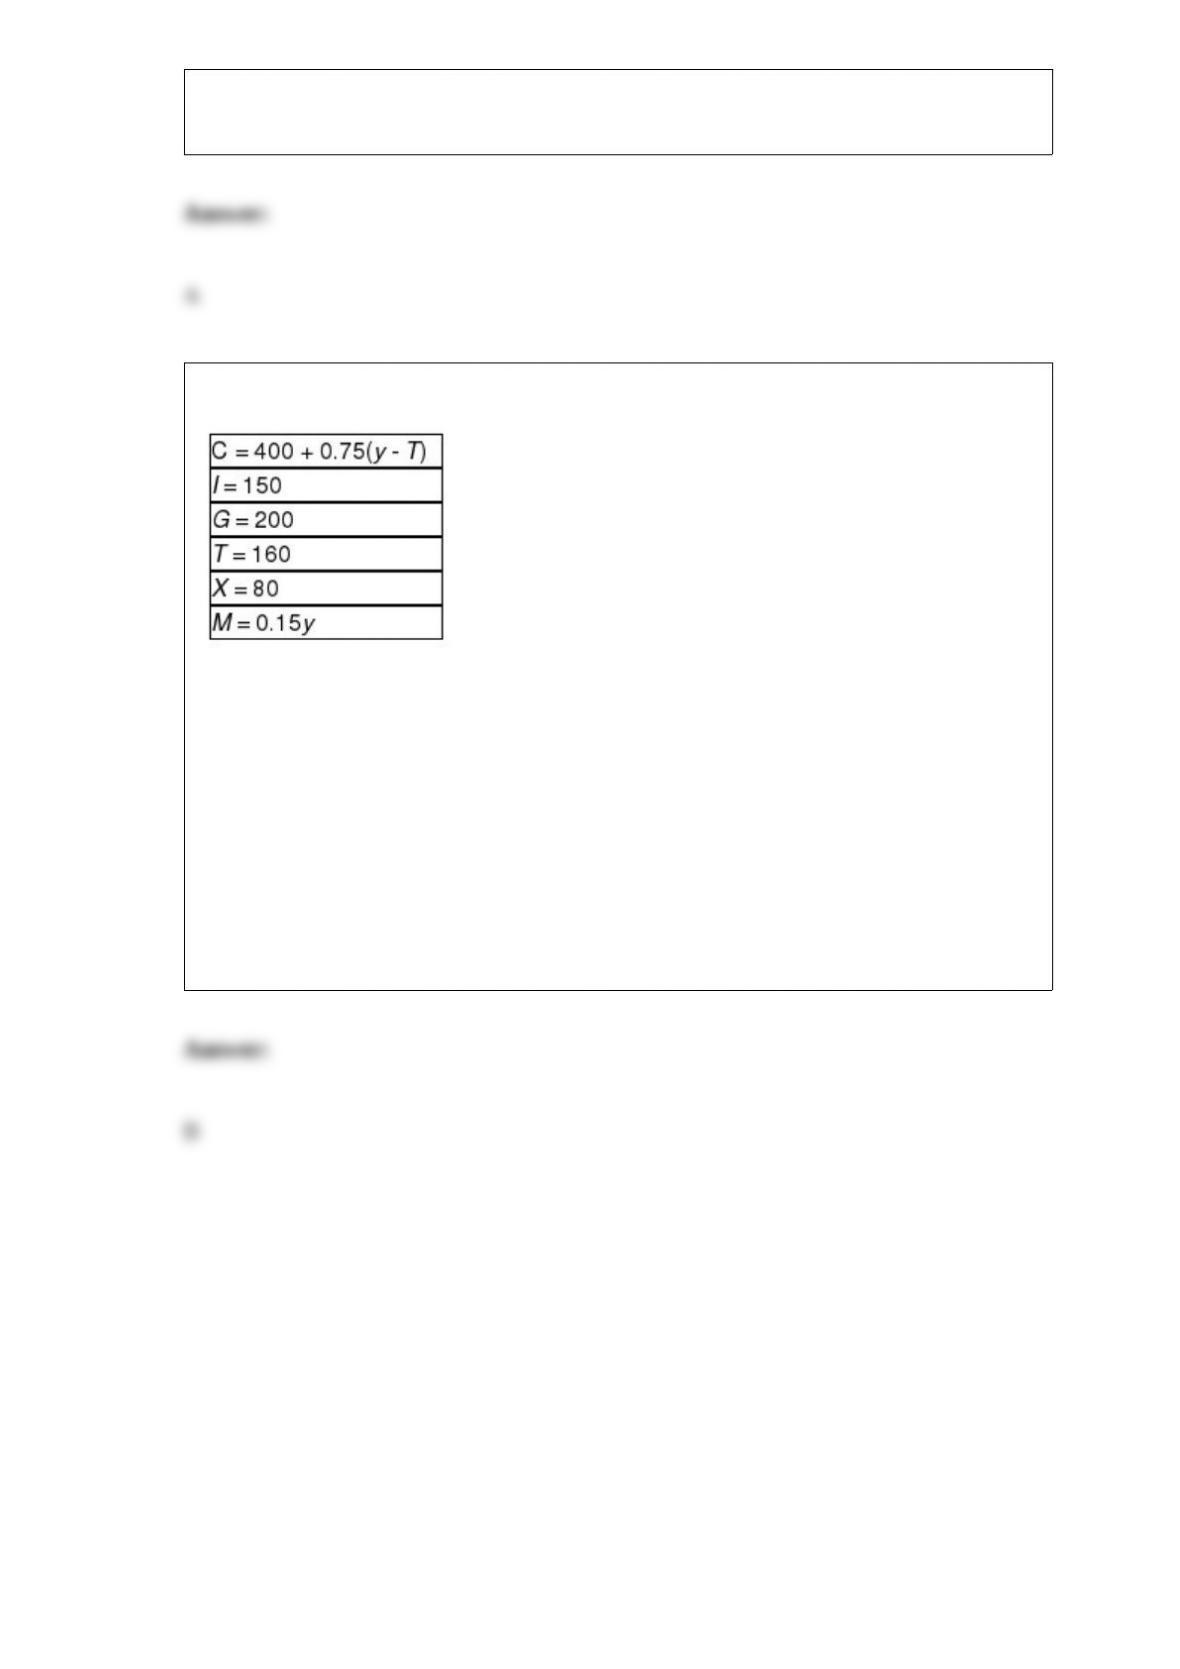
Table 11.1
Refer to Table 11.1. What is the value of the government spending multiplier?
A) 1.67
B) 2.5
C) 3.33
D) 4
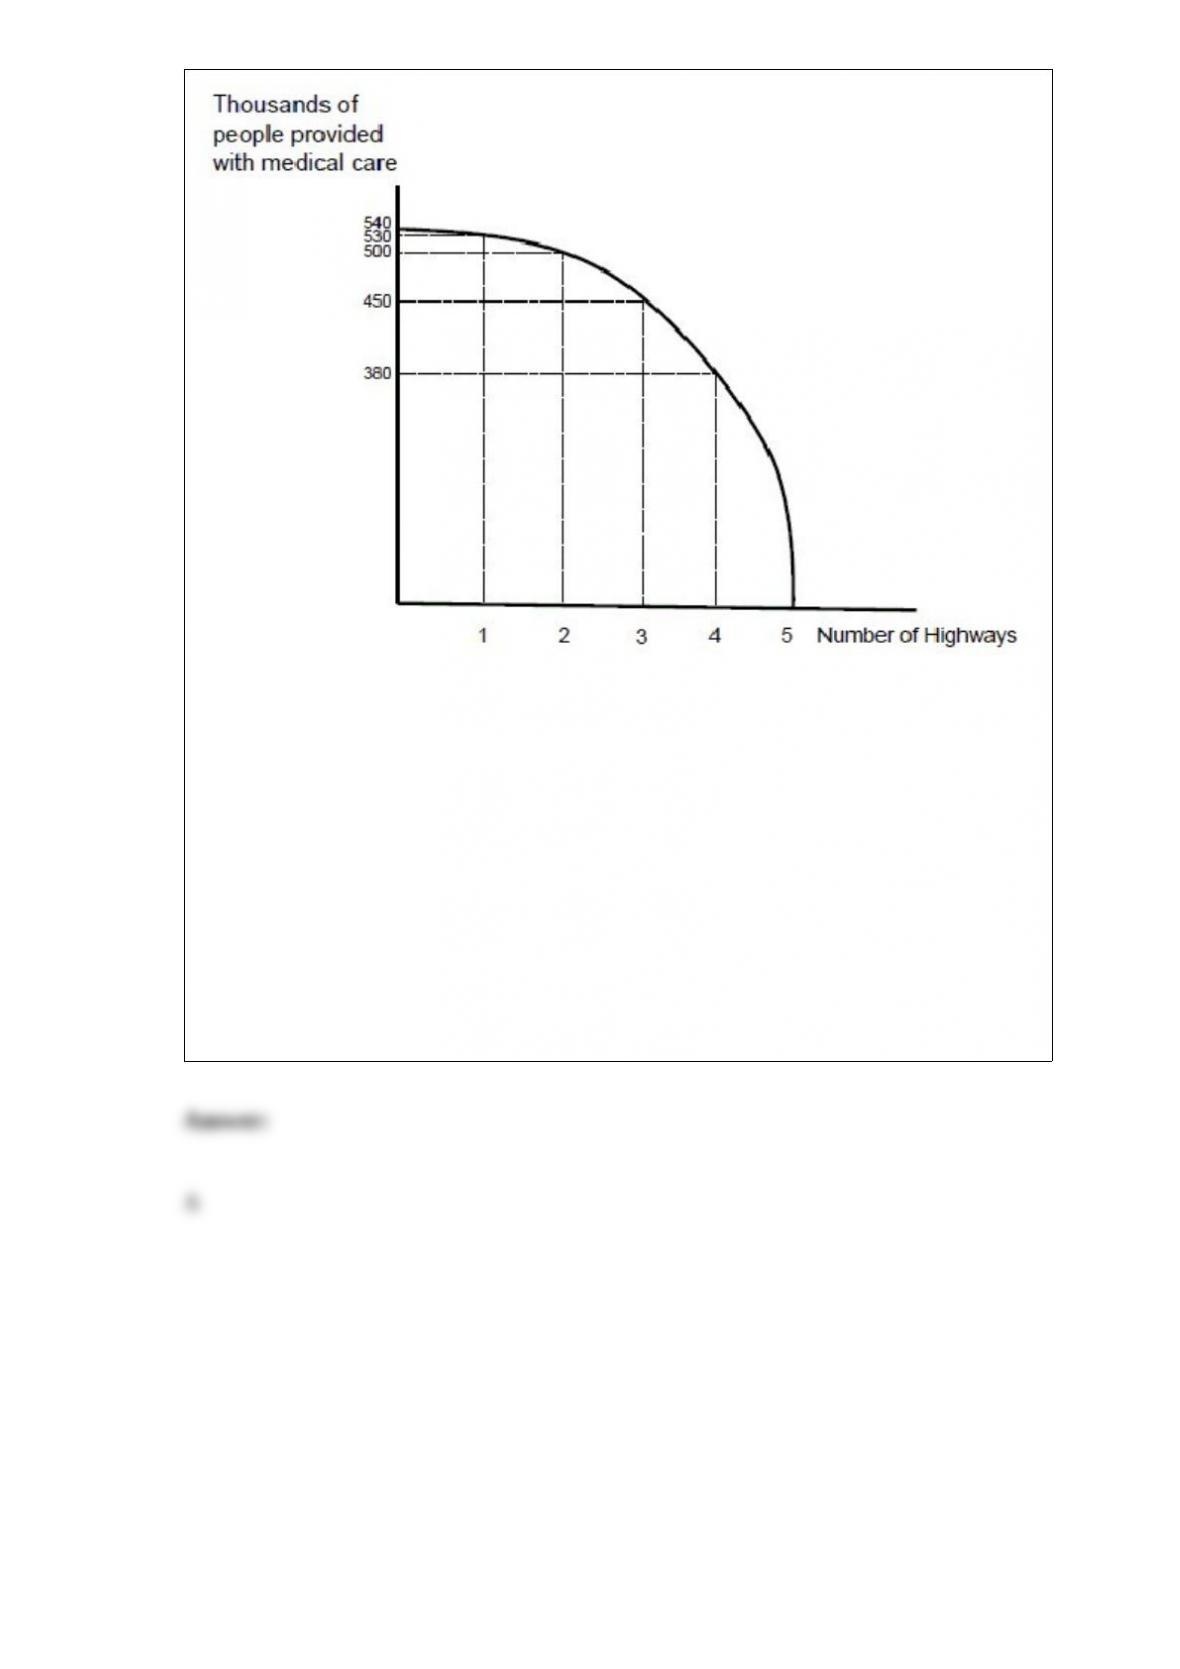
Figure 2.2
Figure 2.2 presents a production possibilities curve for a country that can either produce
highways or provide people with medical care in a given year. The opportunity cost of
the second new highway built in a year is:
A) 30,000 people provided with medical care.
B) 40,000 people provided with medical care.
C) 50,000 people provided with medical care.
D) 500,000 people provided with medical care.
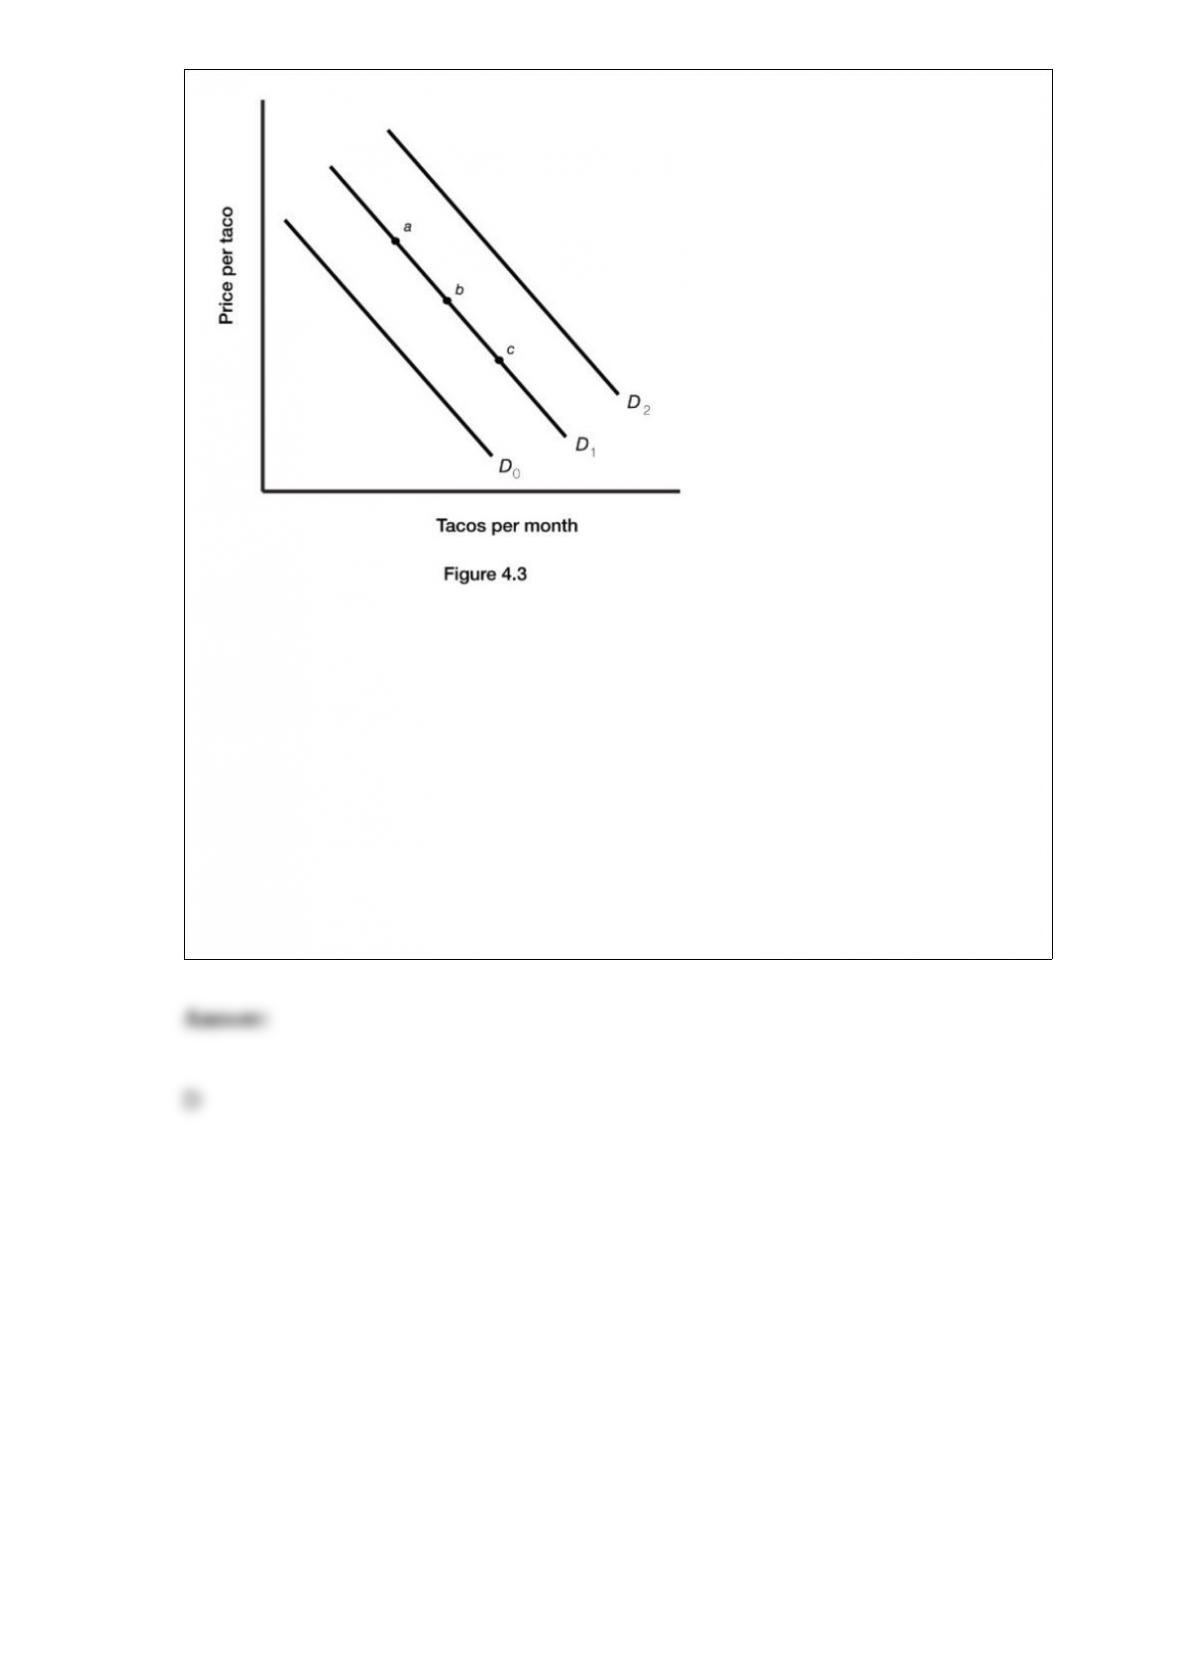
Figure 4.3 illustrates the demand for tacos. A successful advertising campaign to sell
tacos would bring about a movement from
A) point a to point .
B) point c to point .
C) D2 to D1.
D) D0 to D1.
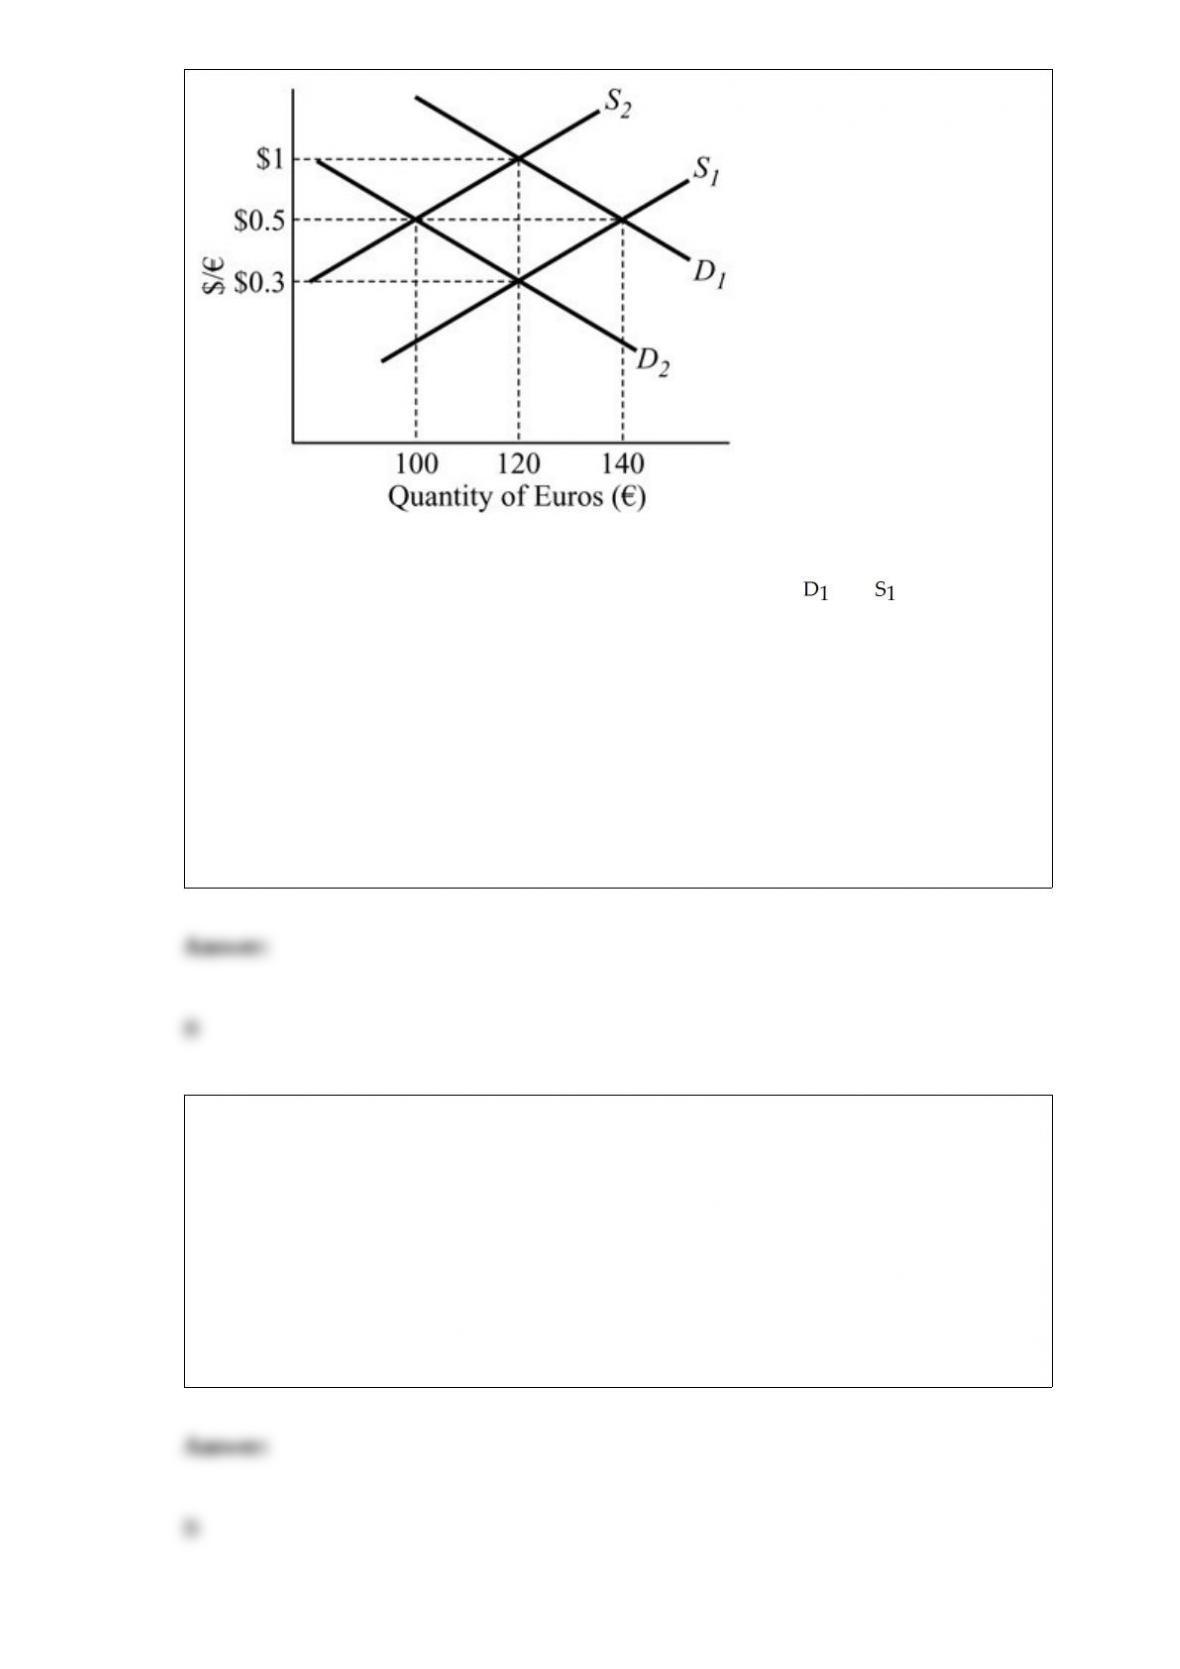
Figure 19.2
Refer to Figure 19.2. If the demand and supply of euros (¬) are and , the
equilibrium is:
A) $1 per ¬ and the quantity is 120 ¬.
B) $0.5 per ¬ and the quantity is 140 ¬.
C) 0.5 ¬ per $ and the quantity is 140 ¬.
D) $0.3 per ¬ and the quantity is 100 ¬.
Which of the following is a way in which a firm can add to its capital stock?
A) expanding its labor force
B) building a new plant and equipment
C) purchasing raw materials
D) unplanned inventory depletion

Joe runs a business and needs to decide how many hours to stay open. Figure 2.2
illustrates his marginal benefit of staying open for each additional hour. Suppose that
Joe’s marginal cost of staying open per hour is $32. How many hours should Joe stay
open?
A) 4 hours
B) 5 hours
C) 6 hours
D) 7 hours
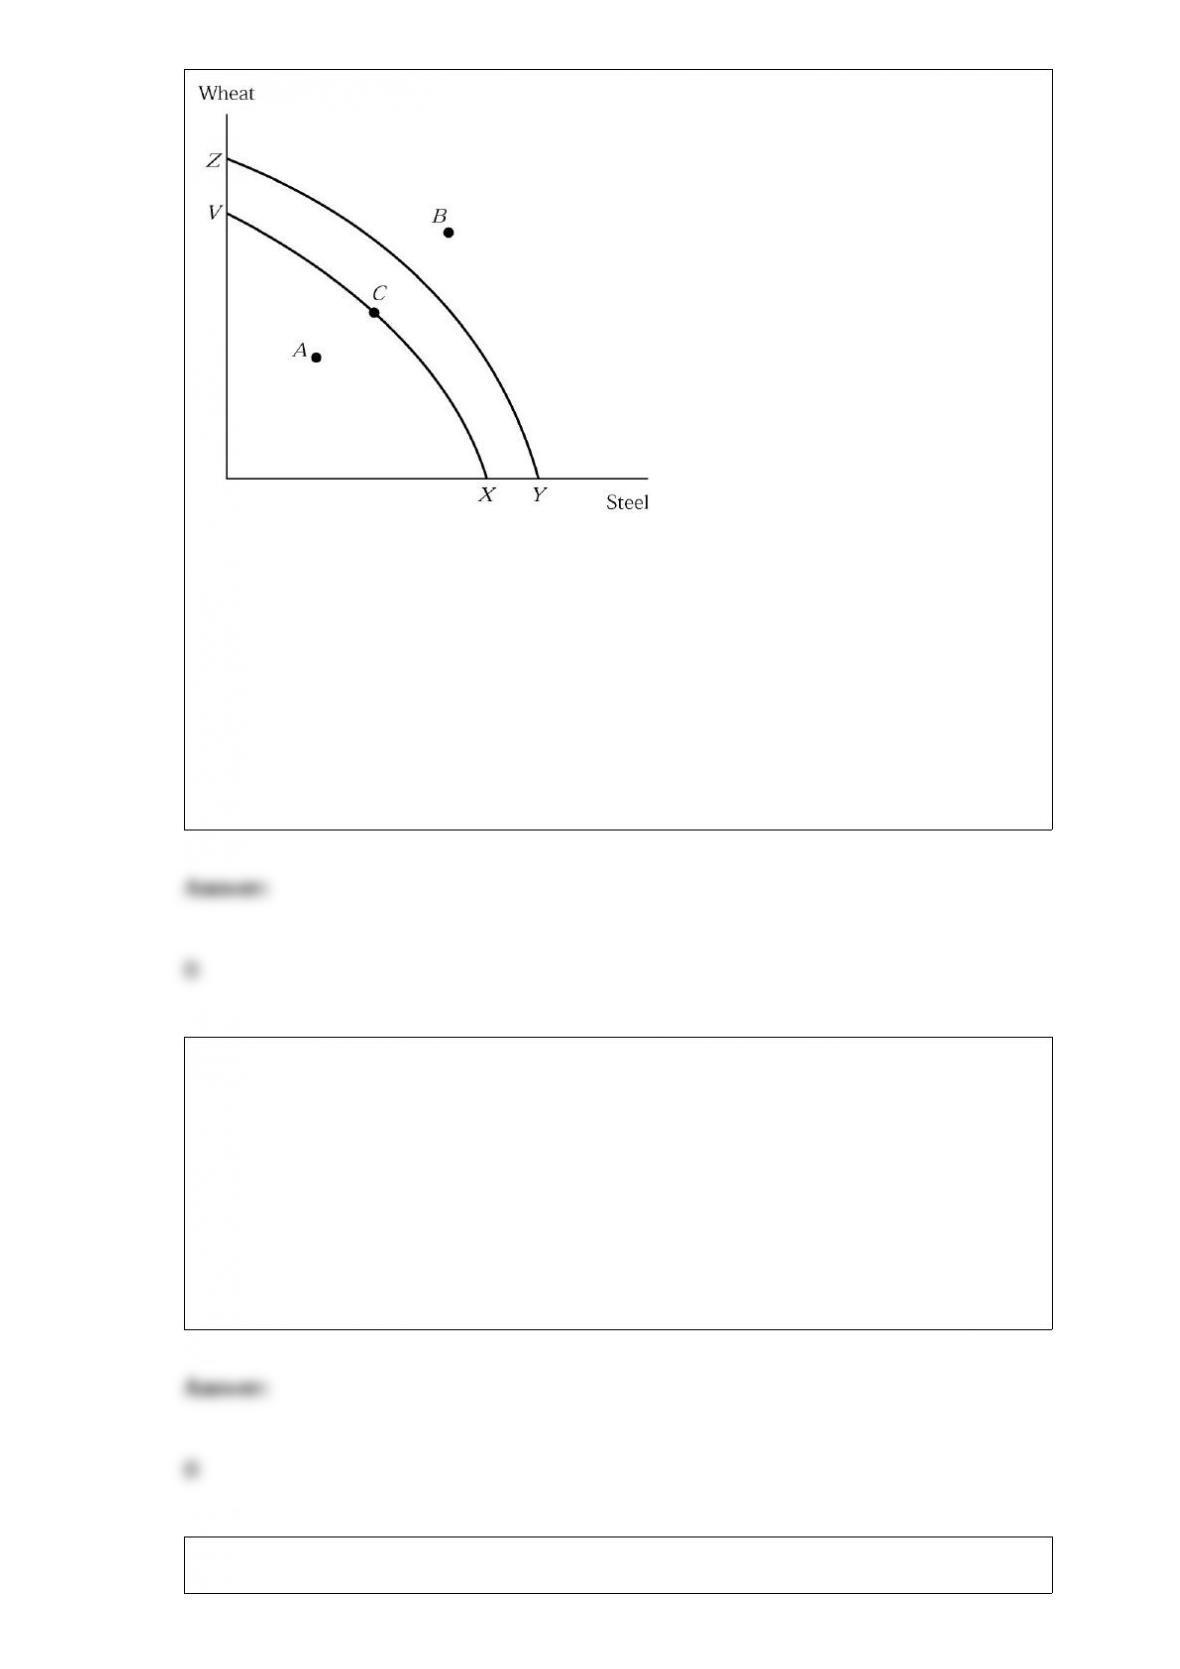
Figure 2.3 In Figure 2.3, the move from production possibility curve XV to production
possibility curve YZ could be caused by:
A) decreased unemployment.
B) more land, labor or capital.
C) a decline in technology.
D) all of the above.
If the public forms their expectations rationally, a credible central bank will
A) tend to encourage wage increases.
B) tend to deter wage increases.
C) have no influence over wages.
D) ignore the public’s beliefs.
Suppose that in October the price of a cup of cafe latte was $1.50 and 400 lattes were

consumed. In November the price of a latte was $2.00 and 200 lattes were consumed.
What might have caused this change?
A) The price of tea (a substitute for cafe lattes) fell.
B) The price of tea (a substitute for cafe lattes) rose.
C) The price of coffee beans (an input of production of cafe lattes) rose.
D) The price of coffee beans (an input of production of cafe lattes) fell.
If the income from investments by Americans abroad exceeds the income from
investments by non-Americans in the U.S., then net income from abroad is:
A) positive.
B) negative.
C) zero.
D) decreasing.
The following table lists the basket of goods in the
Consumer Price Index for the nation of Astro (Assume 2010 is the base year.)
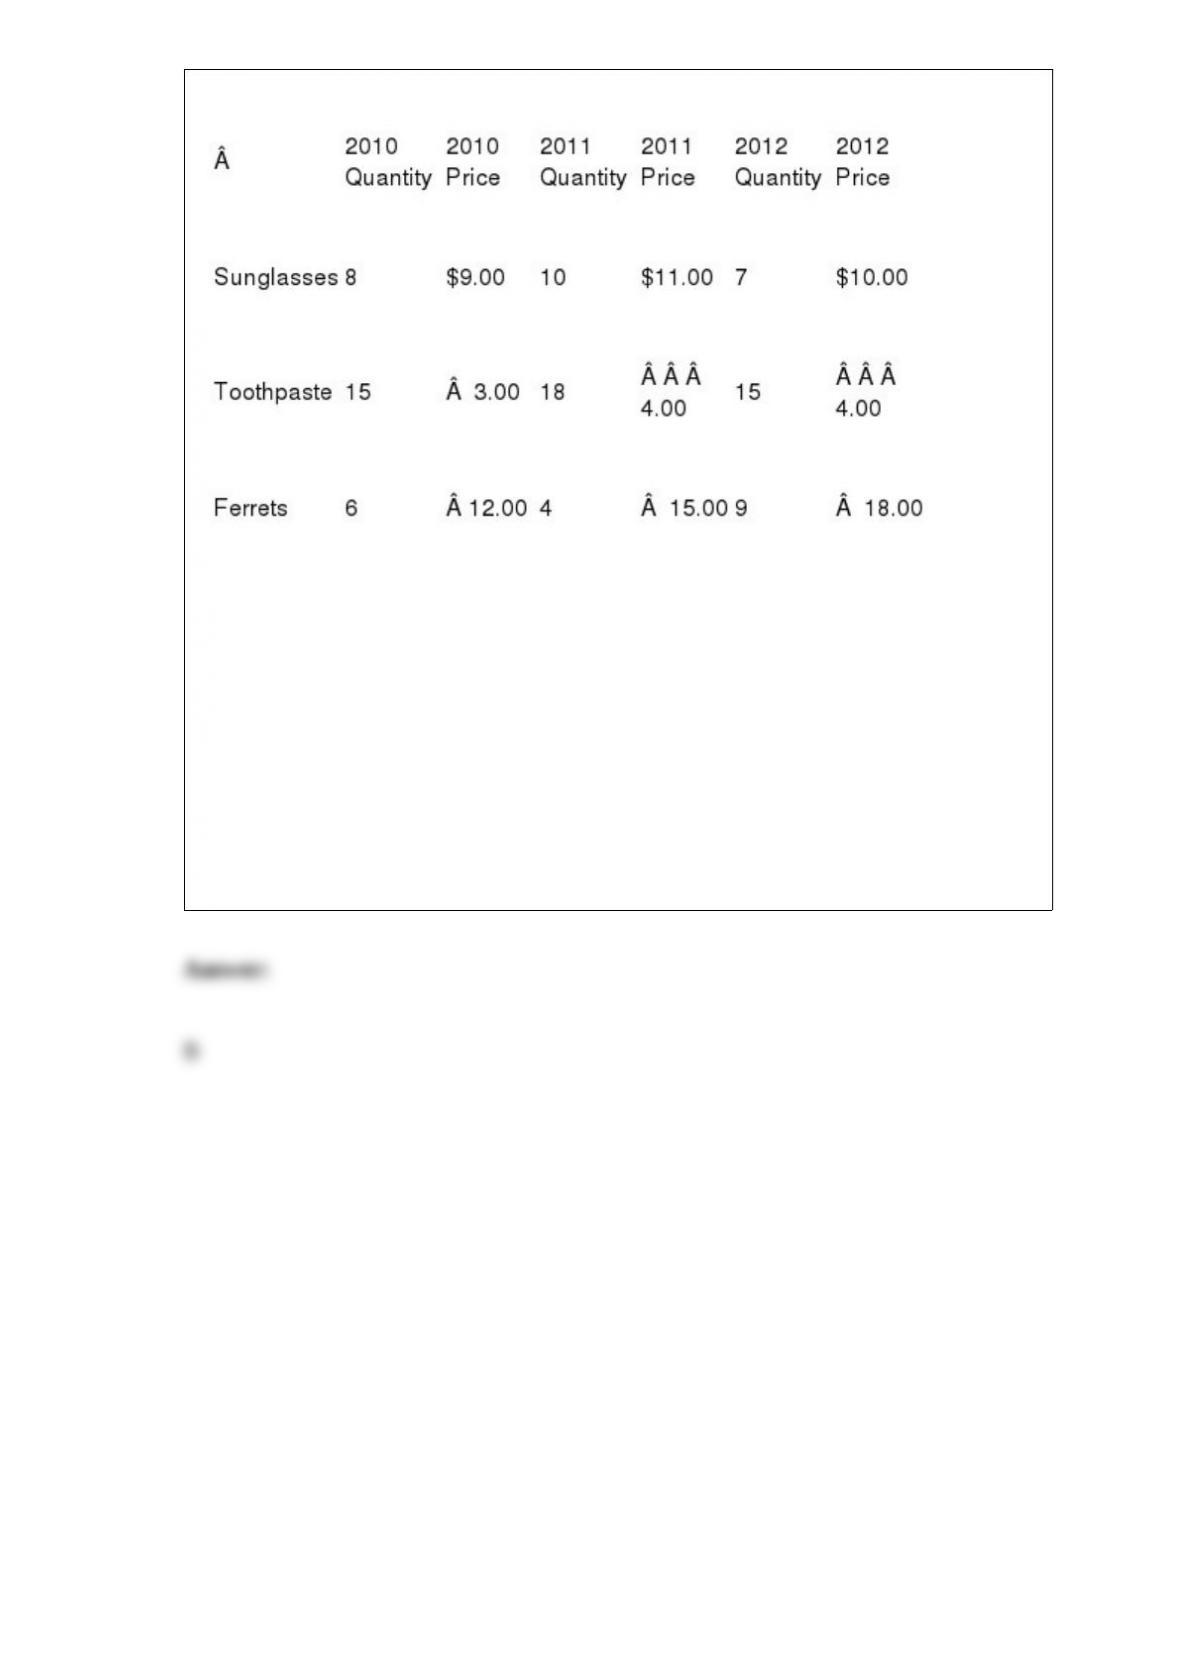
Table 6.2
Using the information in Table 6.2, the Astro Consumer Price Index for 2010 is
A) 24.
B) 100.
C) 124.
D) 189.