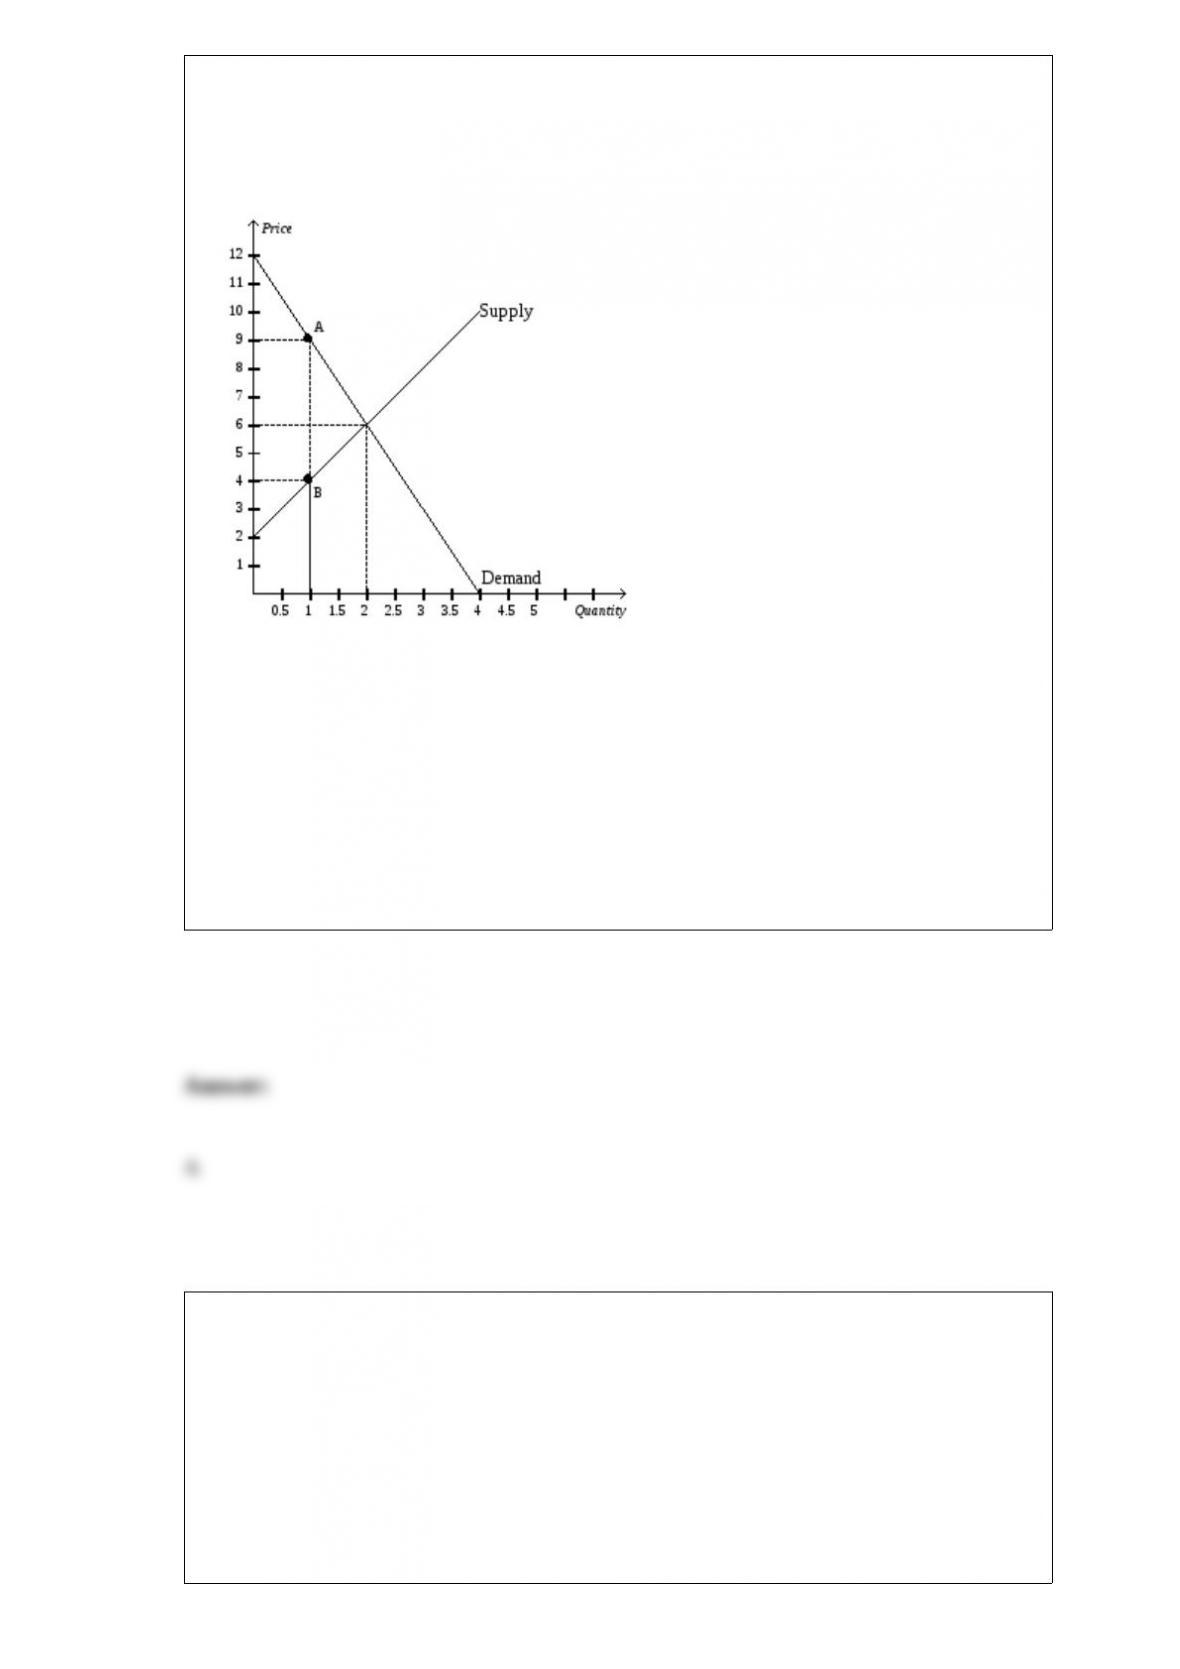
Figure 8-2
The vertical distance between points A and B represents a tax in the market.
Refer to Figure 8-2. Consumer surplus without the tax is
a. $6, and consumer surplus with the tax is $1.50.
b. $6, and consumer surplus with the tax is $4.50.
c. $10, and consumer surplus with the tax is $1.50.
d. $10, and consumer surplus with the tax is $4.50.
On a bowed production possibilities frontier, as you move down along the curve
a. more of one good must be given up to receive one unit of the other good.
b. the available production technology does not change.
c. the opportunity cost increases.
d. All of the above are correct.

The evidence from hyperinflations indicates that money growth and inflation
a. are positively related, which is consistent with the quantity theory of money.
b. are positively related, which is not consistent with the quantity theory of money.
c. are not related in a discernible fashion, which is consistent with the quantity theory of
money.
d. are not related in a discernible fashion, which is not consistent with the quantity
theory of money.
In a particular country in 1998, the average worker needed to work 40 hours to produce
100 units of output. In that same country in 2008, the average worker needed to work
36 hours to produce 72 units of output. In that country, the productivity of the average
worker
a. decreased between 1998 and 2008, so we would expect the standard of living to have
decreased accordingly.
b. increased between 1998 and 2008, so we would expect the standard of living to have
increased accordingly.
c. decreased between 1998 and 2008, so we would expect inflation to have decreased
accordingly.
d. increased between 1998 and 2008, so we would expect inflation to have increased
accordingly.

In early2010 Molly paid $200,000 for a house built in 2000. She spent $30,000 on new
materials to remodel the house. Although Molly lived in the house after she remodeled
it, its rental value rose. Which of the following contributed to real GDP in 2010?
a. the price of the house, the cost of remodeling materials, the increase in rental value
b. the price of the house and the cost of remodeling materials, but not the increase in
rental value
c. the costs of the remodeling materials and the increase in rent, but not the price of the
house
d. None of the above are correct.
Proponents of zero inflation argue that a successful program to reduce inflation
a. eventually reduces inflation expectations.
b. eventually raises real interest rates.
c. permanently decreases output.
d. permanently raises unemployment.
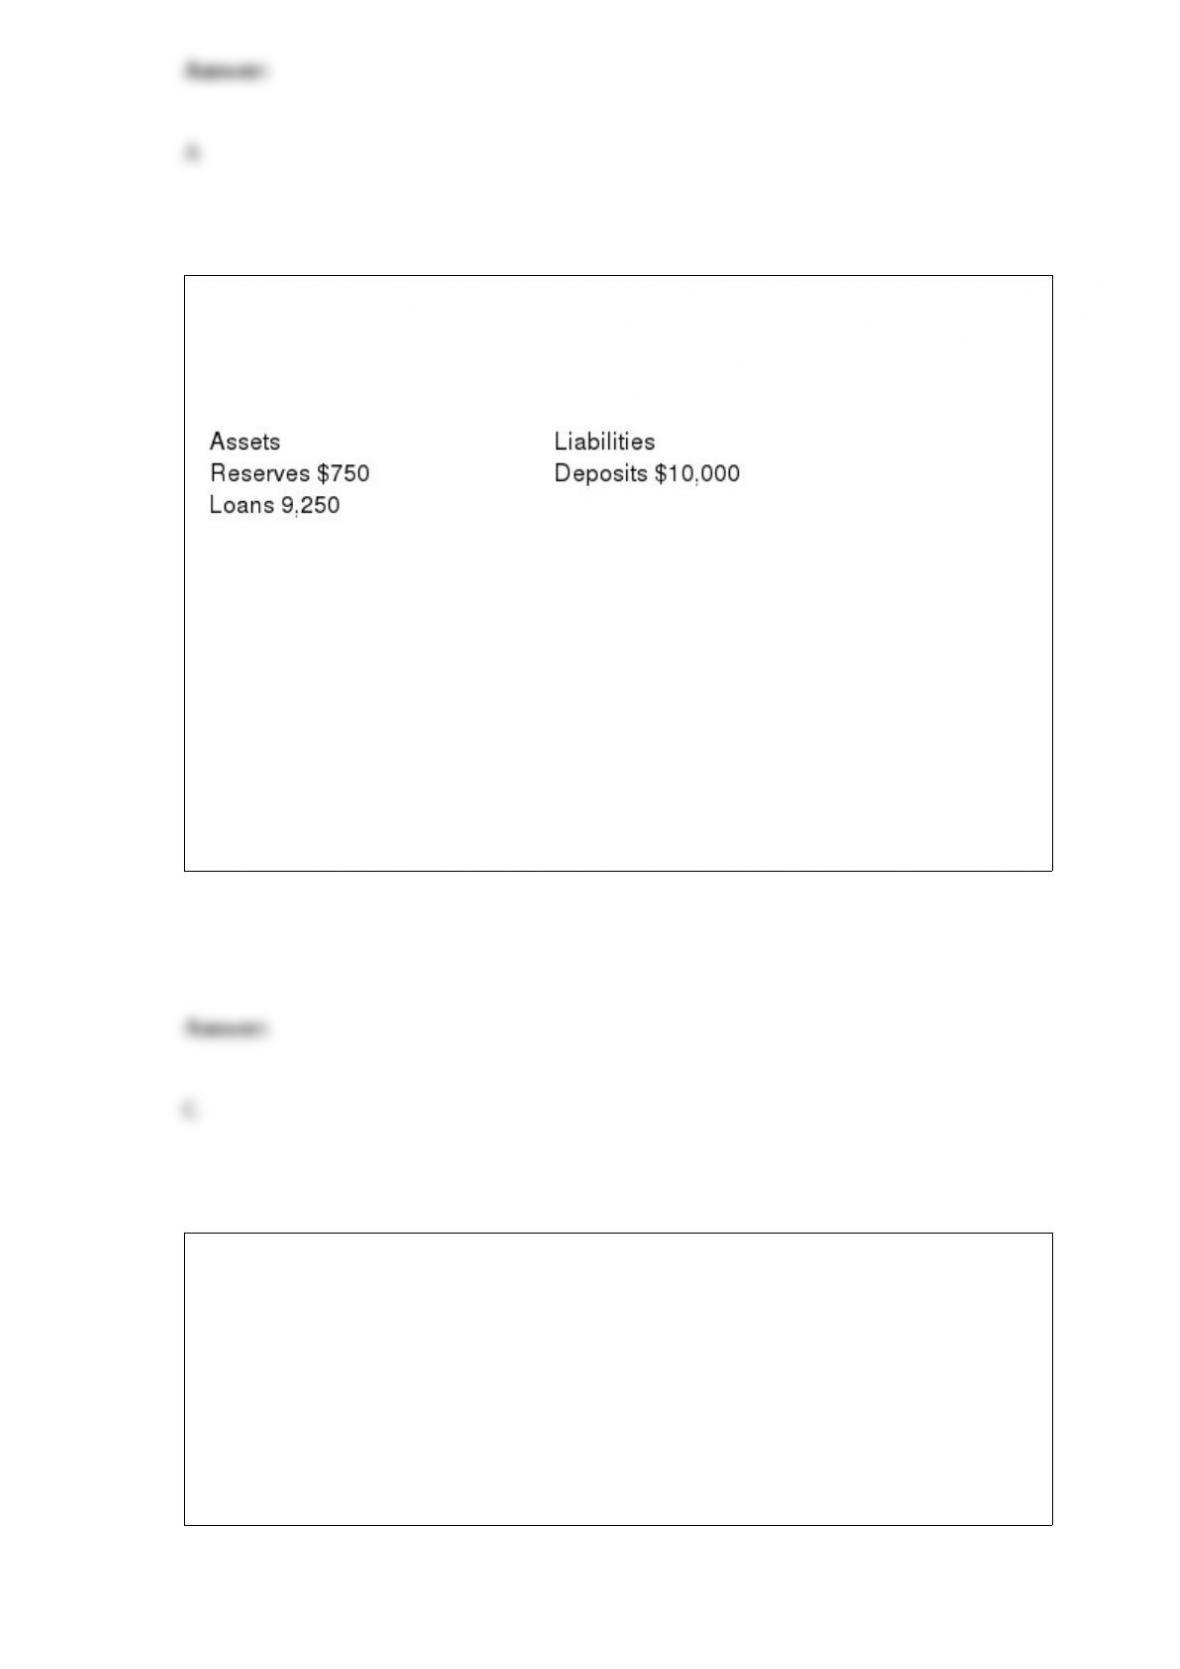
Table 16-2. An economy starts with $10,000 in currency. All of this currency is
deposited into a single bank, and the bank then makes loans totaling $9,250. The
T-account of the bank is shown below.
Refer to Table 16-2. If all banks in the economy have the same reserve ratio as this
bank, then an increase in reserves of $150 for this bank has the potential to increase
deposits for all banks by
a. $866.67.
b. $1,666.67.
c. $2,000.00.
d. an infinite amount.
A likely example of substitute goods for most people would be
a. peanut butter and jelly.
b. tennis balls and tennis rackets.
c. televisions and subscriptions to cable television services.
d. pencils and pens.

The Kennedy tax cut of 1964 included an investment tax credit that was designed to
a. increase aggregate demand in the short run and aggregate supply in the long run.
b. increase aggregate supply in the short run and aggregate demand in the long run.
c. only increase aggregate supply in the long run.
d. only increase aggregate demand in the short run.
If inflation is less than expected, then the unemployment rate is
a. greater than the natural rate. In the long run the short-run Phillips curve will shift
right.
b. greater than the natural rate. In the long run the short-run Phillips curve will shift left.
c. less than the natural rate. In the long run the short-run Phillips curve will shift right.
d. less than the natural rate. In the long run the short-run Phillips curve will shift left.
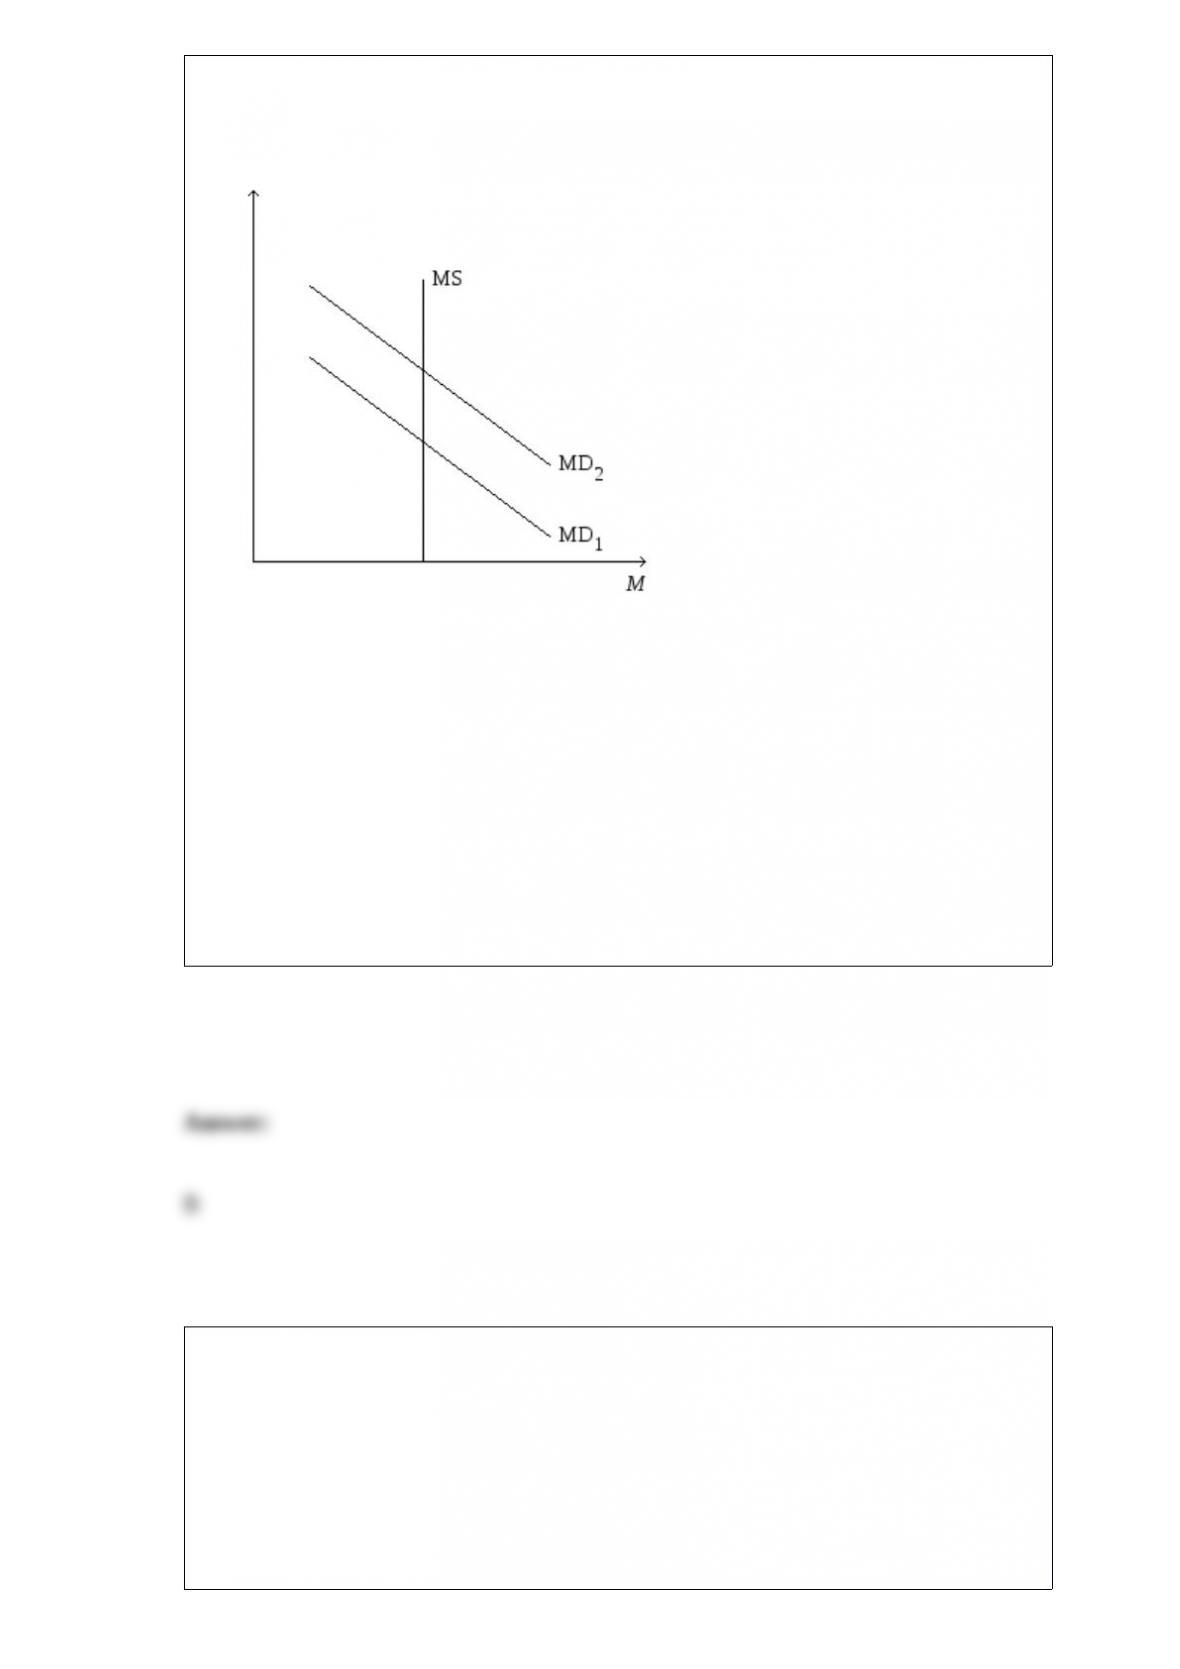
Figure 21-5. On the figure, MS represents money supply and MD represents money
demand.
Refer to Figure 21-5. A shift of the money-demand curve from MD2 to MD1 is
consistent with which of the following sets of events?
a. The government cuts taxes, resulting in an increase in people’s incomes.
b. The government reduces government spending, resulting in a decrease in people’s
incomes.
c. The Federal Reserve increases the supply of money, which decreases the interest rate.
d. All of the above are correct.
A perpetuity is
a. a financial intermediary that has existed throughout recorded history.
b. an instrument of equity finance.
c. a stock that pays dividends forever.

d. a bond that pays interest forever.
When a good is taxed,
a. both buyers and sellers of the good are made worse off.
b. only buyers are made worse off, because they ultimately bear the burden of the tax.
c. only sellers are made worse off, because they ultimately bear the burden of the tax.
d. neither buyers nor sellers are made worse off, since tax revenue is used to provide
goods and services that would otherwise not be provided in a market economy.
Policies such as rent control and trade barriers persist in spite of the fact that economists
are virtually united in their opposition to such policies, probably because
a. economists have not yet convinced the general public that the policies are
undesirable.
b. economists engage in positive analysis, not normative analysis.
c. economists have values that are different from the values of most non-economists.
d. economists’ theories are not easily confirmed or refuted in laboratory analysis.

Which of the following is the most accurate statement?
a. In the 1970s, the late 1980s, 1990s, and 2000s, the GDP deflator and the CPI both
showed high rates of inflation.
b. In the 1970s, both the GDP deflator and the consumer price index showed high rates
of inflation, and in the late 1980s, 1990s, and 2000s, both measures showed low rates of
inflation.
c. In the 1970s, both the GDP deflator and the consumer price index showed low rates
of inflation, and in the late 1980s, 1990s, and 2000s, both measures showed high rates
of inflation.
d. In the 1970s, the late 1980s, 1990s, and 2000s, the GDP deflator and the CPI both
showed low rates of inflation.
The classical theory of inflation
a. is also known as the quantity theory of money.
b. was developed by some of the earliest economic thinkers.
c. is used by most modern economists to explain the long-run determinants of the
inflation rate.
d. All of the above are correct.
According to the long-run Phillips curve, in the long run monetary policy influences
a. both the inflation rate and the unemployment rate.
b. the inflation rate but not the unemployment rate.
c. the unemployment rate but not the inflation rate.
d. neither the unemployment rate nor the inflation rate.
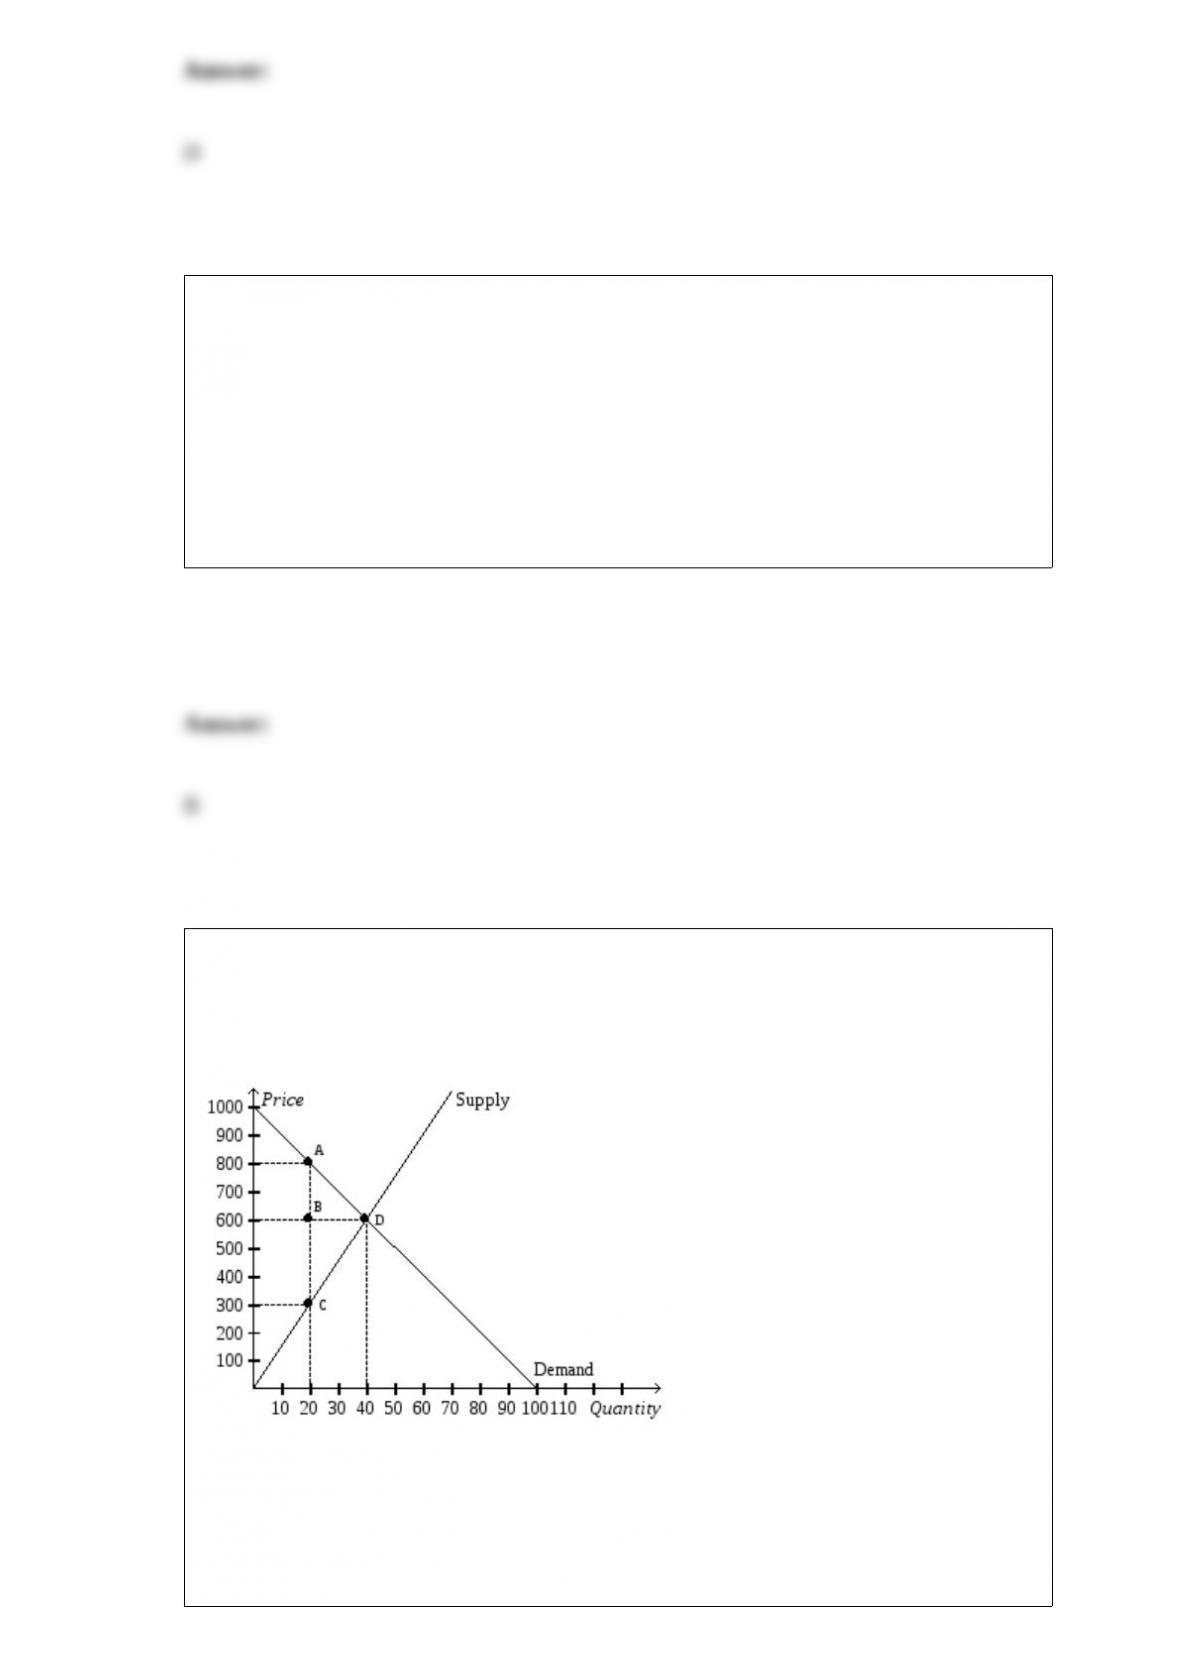
Figure 8-9
The vertical distance between points A and C represent a tax in the market.
Refer to Figure 8-9. The equilibrium price and quantity before the imposition of the
tax is
a. P=$800 and Q=20.

b. P=$600 and Q=20.
c. P=$300 and Q=20.
d. P=$600 and Q=40.
Suppose a tax of $3 per unit is imposed on a good. The supply curve is a typical
upward-sloping straight line, and the demand curve is a typical downward-sloping
straight line. The tax decreases consumer surplus by $3,900 and decreases producer
surplus by $3,000. The tax generates tax revenue of $6,000. The tax decreased the
equilibrium quantity of the good from
a. 2,000 to 1,500.
b. 2,400 to 2,000.
c. 2,600 to 2,000.
d. 3,000 to 2,400.
The initial impact of an increase in an investment tax credit is to shift
a. aggregate demand right.
b. aggregate demand left.
c. aggregate supply right.

d. aggregate supply left.
If in some year nominal GDP was $20 billion and the GDP deflator was 50, what was
real GDP ?
a. $2.5 billion
b. $10 billion
c. $40 billion
d. $100 billion
A stock index is
a. an average of a group of stock prices.
b. an average of a group of stock yields.
c. a measure of the risk relative to the profitability of corporations.
d. a report in a newspaper or other media outlet on the price of the stock and earnings of
the corporation that issued the stock.
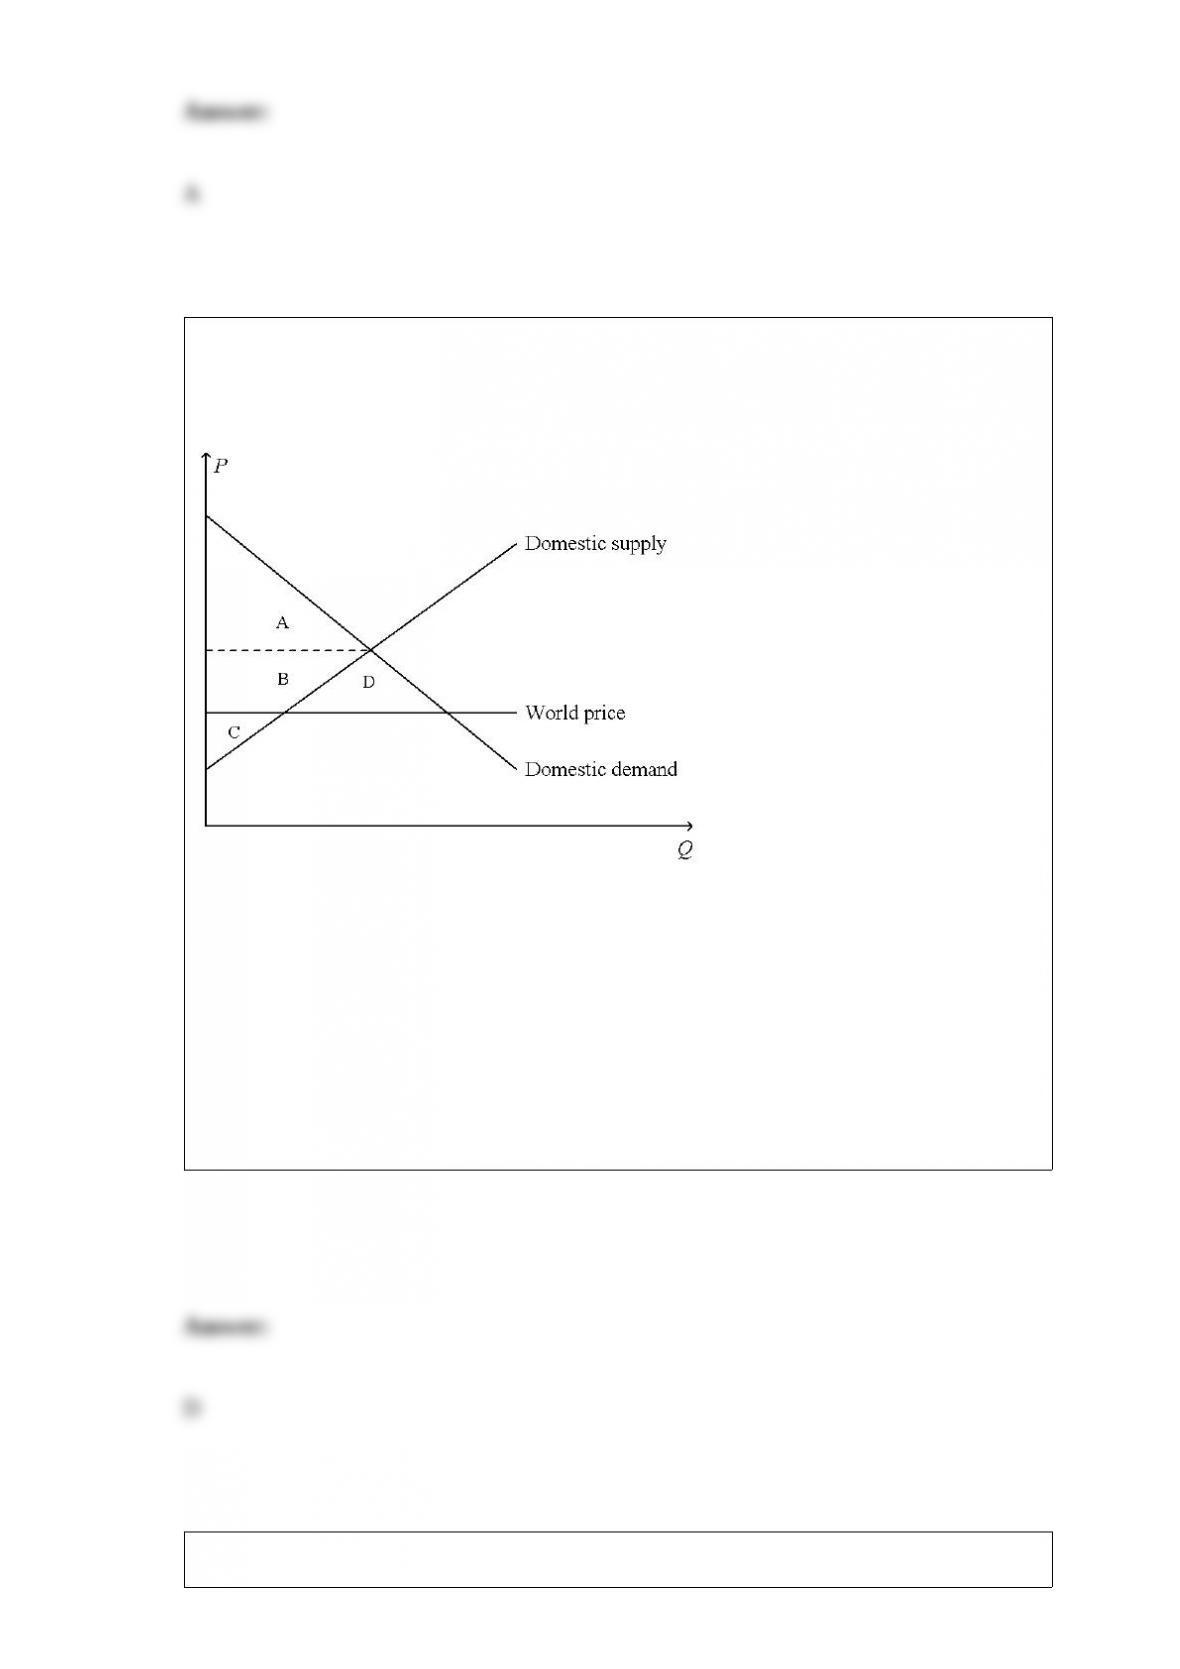
Figure 9-8. On the diagram below, Q represents the quantity of cars and P represents
the price of cars.
Refer to Figure 9-8. In the country for which the figure is drawn, total surplus with
international trade in cars
a. is represented by the area A + B + C.
b. is represented by the area A + B + D.
c. is smaller than producer surplus without international trade in cars.
d. is larger than total surplus without international trade in cars.
If a government started with a budget deficit and moved to a surplus, domestic

investment
a. and the real exchange rate would rise.
b. and the real exchange rate would fall.
c. would rise and the real exchange rate would fall.
d. would fall and the real exchange rate would rise.
An increase in the budget deficit causes net capital outflow to
a. rise, because the supply of loanable funds shifts right.
b. rise, because the demand for loanable funds shifts right.
c. fall, because the supply of loanable funds shifts left.
d. fall, because the demand for loanable funds shifts right.
Figure 9-5
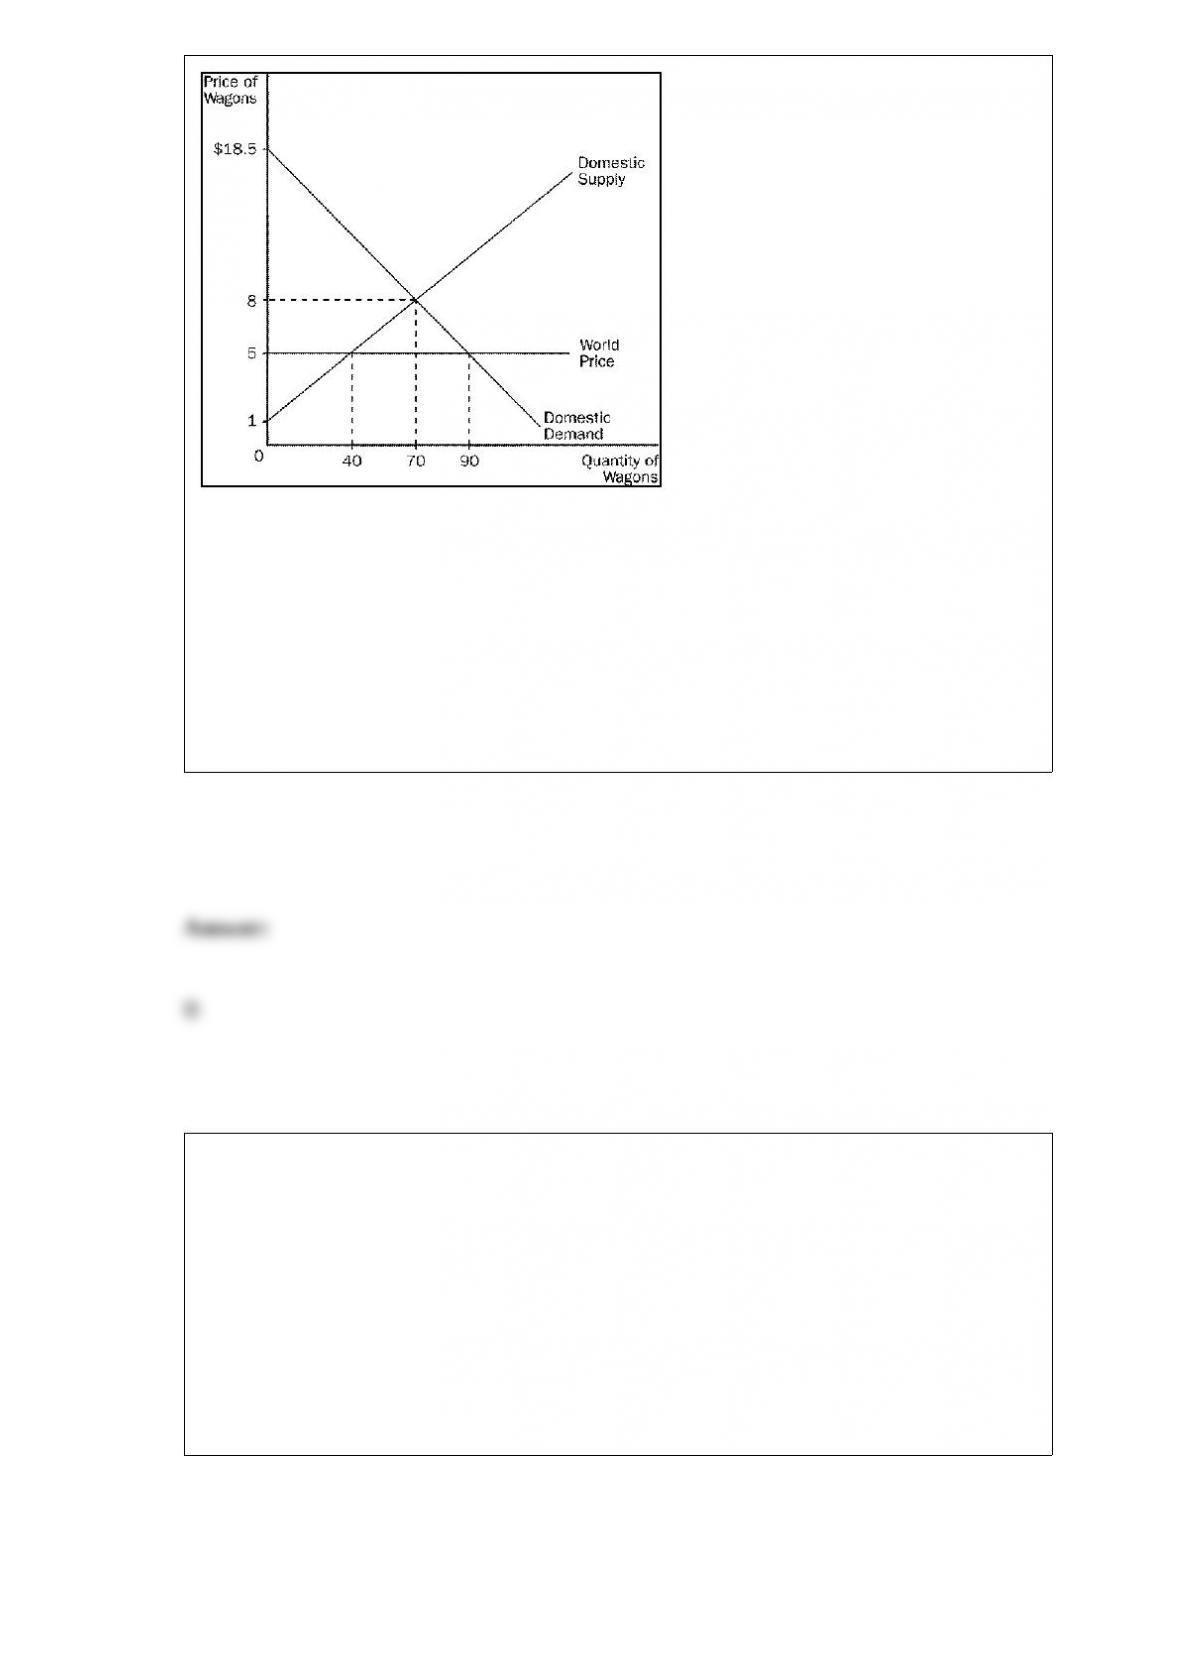
Refer to Figure 9-5. Without trade, producer surplus amounts to
a. $210.
b. $245.
c. $450.
d. $455.
Suppose that reducing inflation 2 percentage points would cost a country 4 percent of
annual output. This country’s sacrifice ratio is
a. 1/2.
b. 2.
c. 6.
d. 8.
In the short run, an increase in the money supply is likely to lead to
a. lower unemployment and lower inflation.
b. lower unemployment and higher inflation.
c. higher unemployment and lower inflation.
d. higher unemployment and higher inflation.
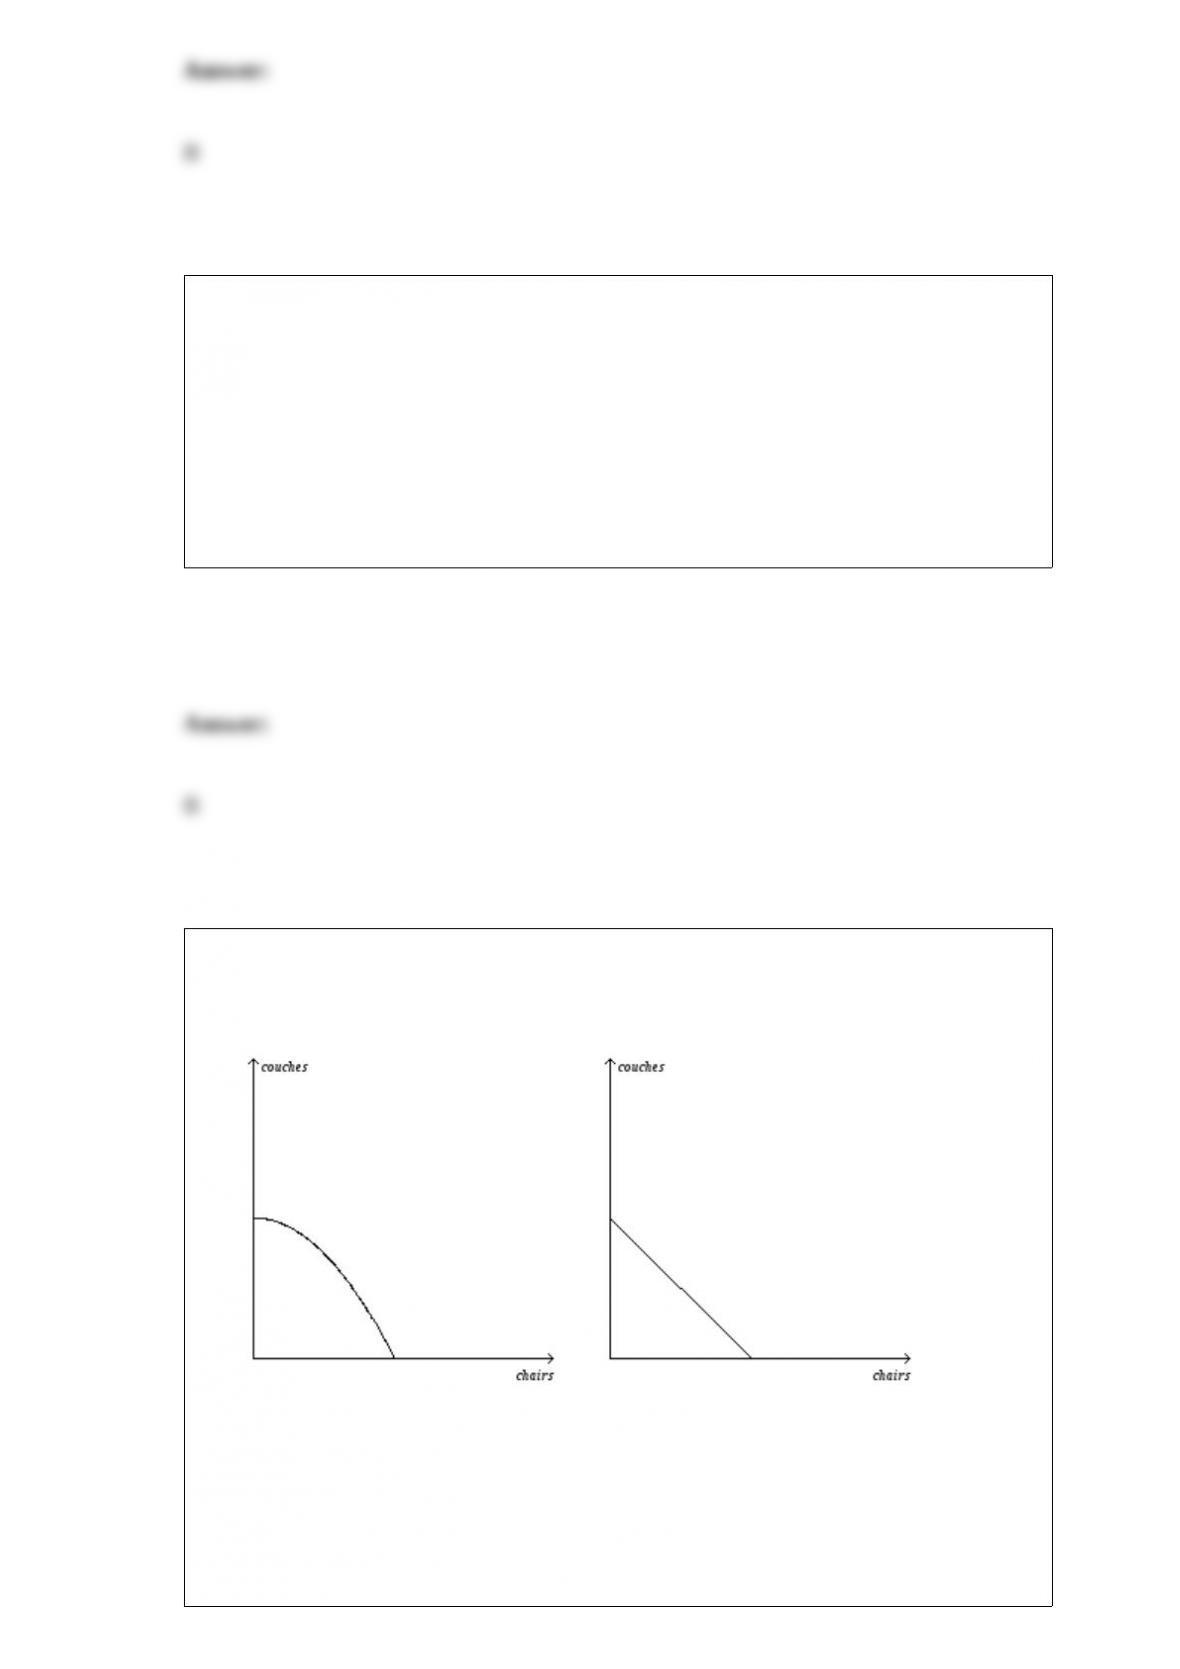
Figure 3-1
Panel (a) Panel (b)
Refer to Figure 3-1. The rate of tradeoff between producing chairs and producing
couches depends on how many chairs and couches are being produced in
a. Panel (a).
b. Panel (b).
c. both Panel (a) and Panel (b).
d. neither Panel (a) nor Panel (b).
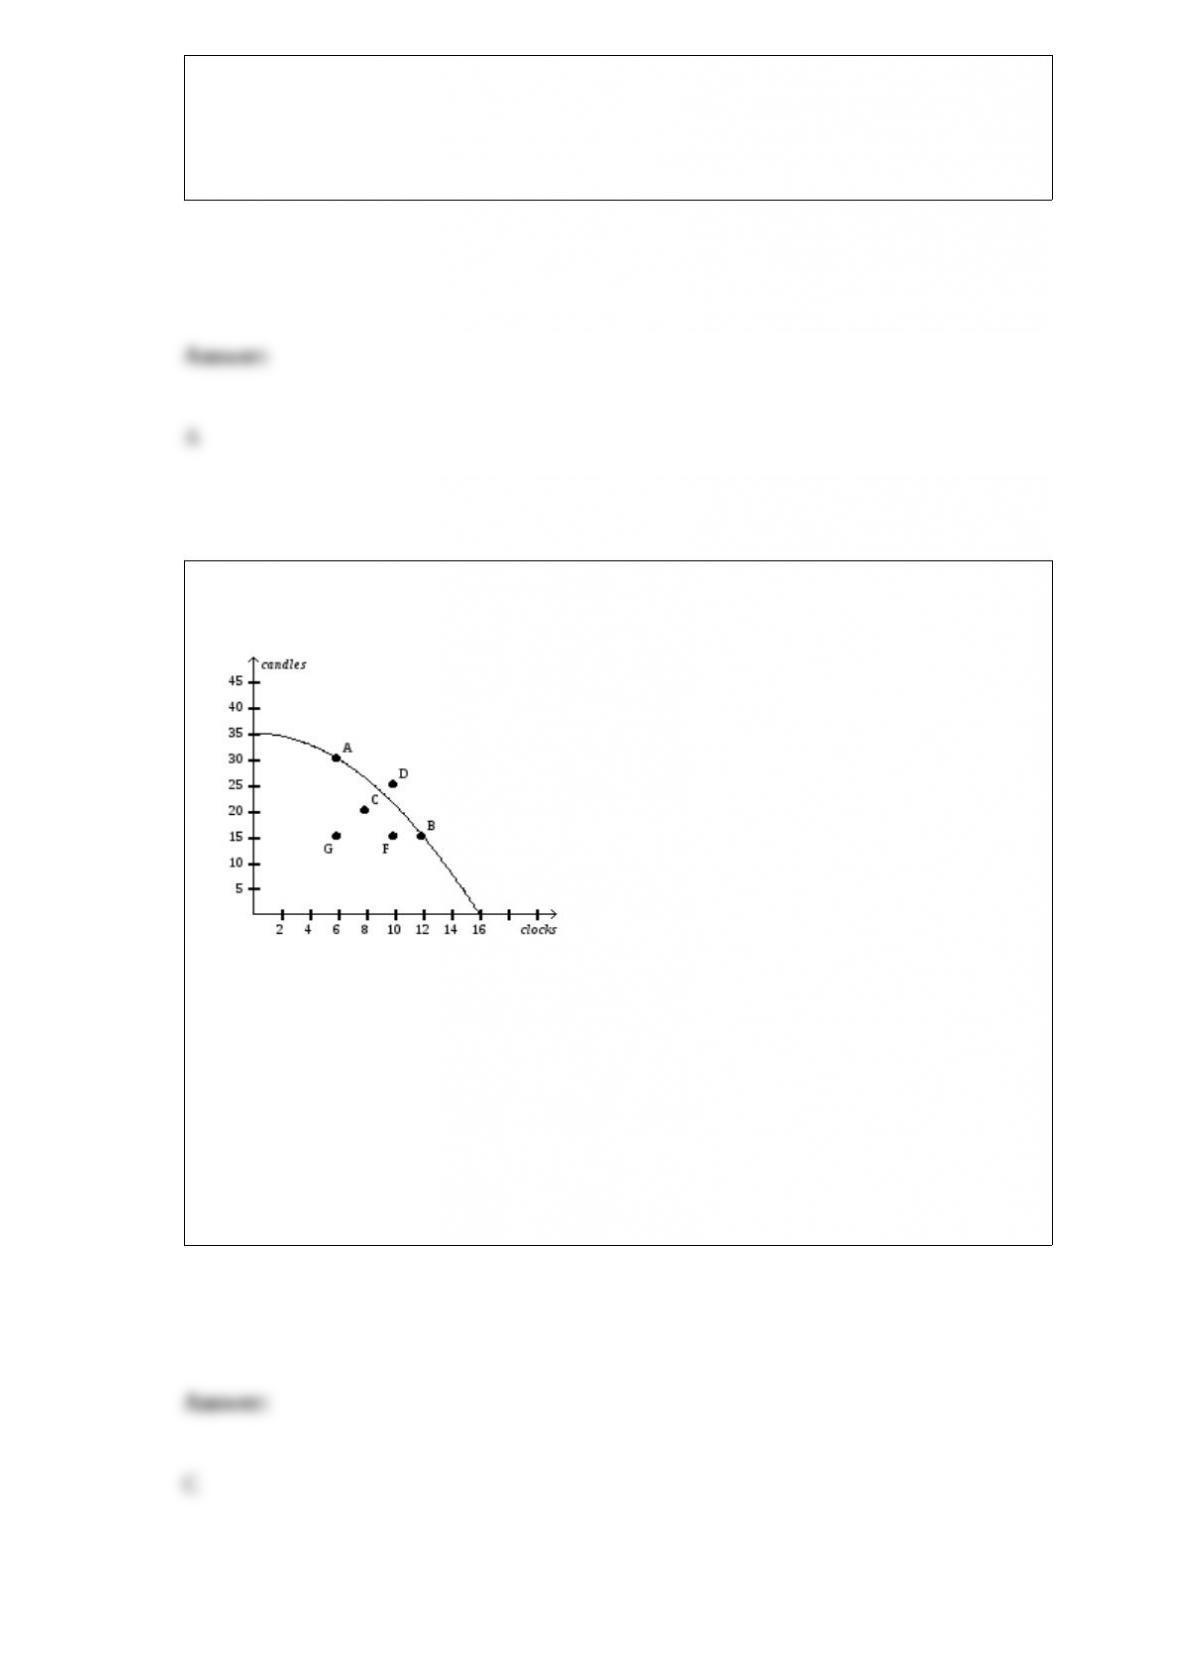
Figure 2-6
Refer to Figure 2-6. Inefficient production is represented by which point(s)?
a. A, B
b. C, D, F, G
c. C, F, G
d. D

If a tax is levied on the buyers of dog food, then
a. buyers will bear the entire burden of the tax.
b. sellers will bear the entire burden of the tax.
c. buyers and sellers will share the burden of the tax.
d. the government will bear the entire burden of the tax.
If a price ceiling of $2 per gallon is imposed on gasoline, and the market equilibrium
price is $1.50, then the price ceiling is a binding constraint on the market.
The current policy on kidney donation effectively sets a price ceiling of zero.

If the money supply increased by 10% and at the same time velocity decreased by 10%,
then according to the quantity equation there would be no change in the price level.
If an economy can produce more of one good without giving up any of another good,
then the economy’s current production point is inefficient.
If the central bank has discretion to make policy, it may create economic fluctuations
that reflect the electoral calendar. This is called the political business cycle.
The elasticities of the supply and demand curves in the market for cigarettes affect how
much a tax distorts that market.

A tax on sellers increases supply.
An increase in the expected price level shifts the short-run aggregate supply curve to
the right.
Positive statements can be evaluated using data alone, but normative statements cannot.

A price floor set above the equilibrium price causes quantity supplied to exceed
quantity demanded.
Cross-price elasticity is used to determine whether goods are inferior or normal goods.
A linear, downward-sloping demand curve has a constant elasticity but a changing
slope.
The money multiplier equals 1/(1 – R), where R represents the reserve ratio.

An increase in the price of ink will shift the supply curve for pens to the left.
If real GDP and the GDP deflator both rise, then it must be that nominal GDP rose.
Hyperinflation is generally defined as inflation that exceeds 50 percent per month.
PZX Corporation has the opportunity to undertake an investment project that will cost
$10,000 today and yield the company $13,310 in 3 years. PZX will forgo the project if
the interest rate is higher than 10 percent.

The cost of an action is measured in terms of foregone opportunities.
Federal Reserve governors are given long terms to insulate them from politics.