The scaling of the axes of a time-series graph:
A) is not a critical element in presenting the intended information.
B) may change the interpretation of the data.
C) generally places the time period on the vertical axis.
D) generally puts values of a variable, such as the unemployment rate, on the vertical
axis.

Scenario: Tom’s Budget Constraint
Tom is trying to decide how to allocate his $50 budget for music downloads and online
movie streaming when the price of a music download is $1 and the price of a movie is
$5.
(Scenario: Tom’s Budget Constraint) Read the scenario Tom’s Budget Constraint. The
combination _____ music downloads and _____ movies lies OUTSIDE Tom’s budget
line. (Tom cannot afford this combination.)
A) 50; 10
B) 50; no
C) no; 5
D) 20; 5
An example of monopolistic competition is the _____ industry.
A) restaurant
B) soft-drink
C) automobile
D) airline
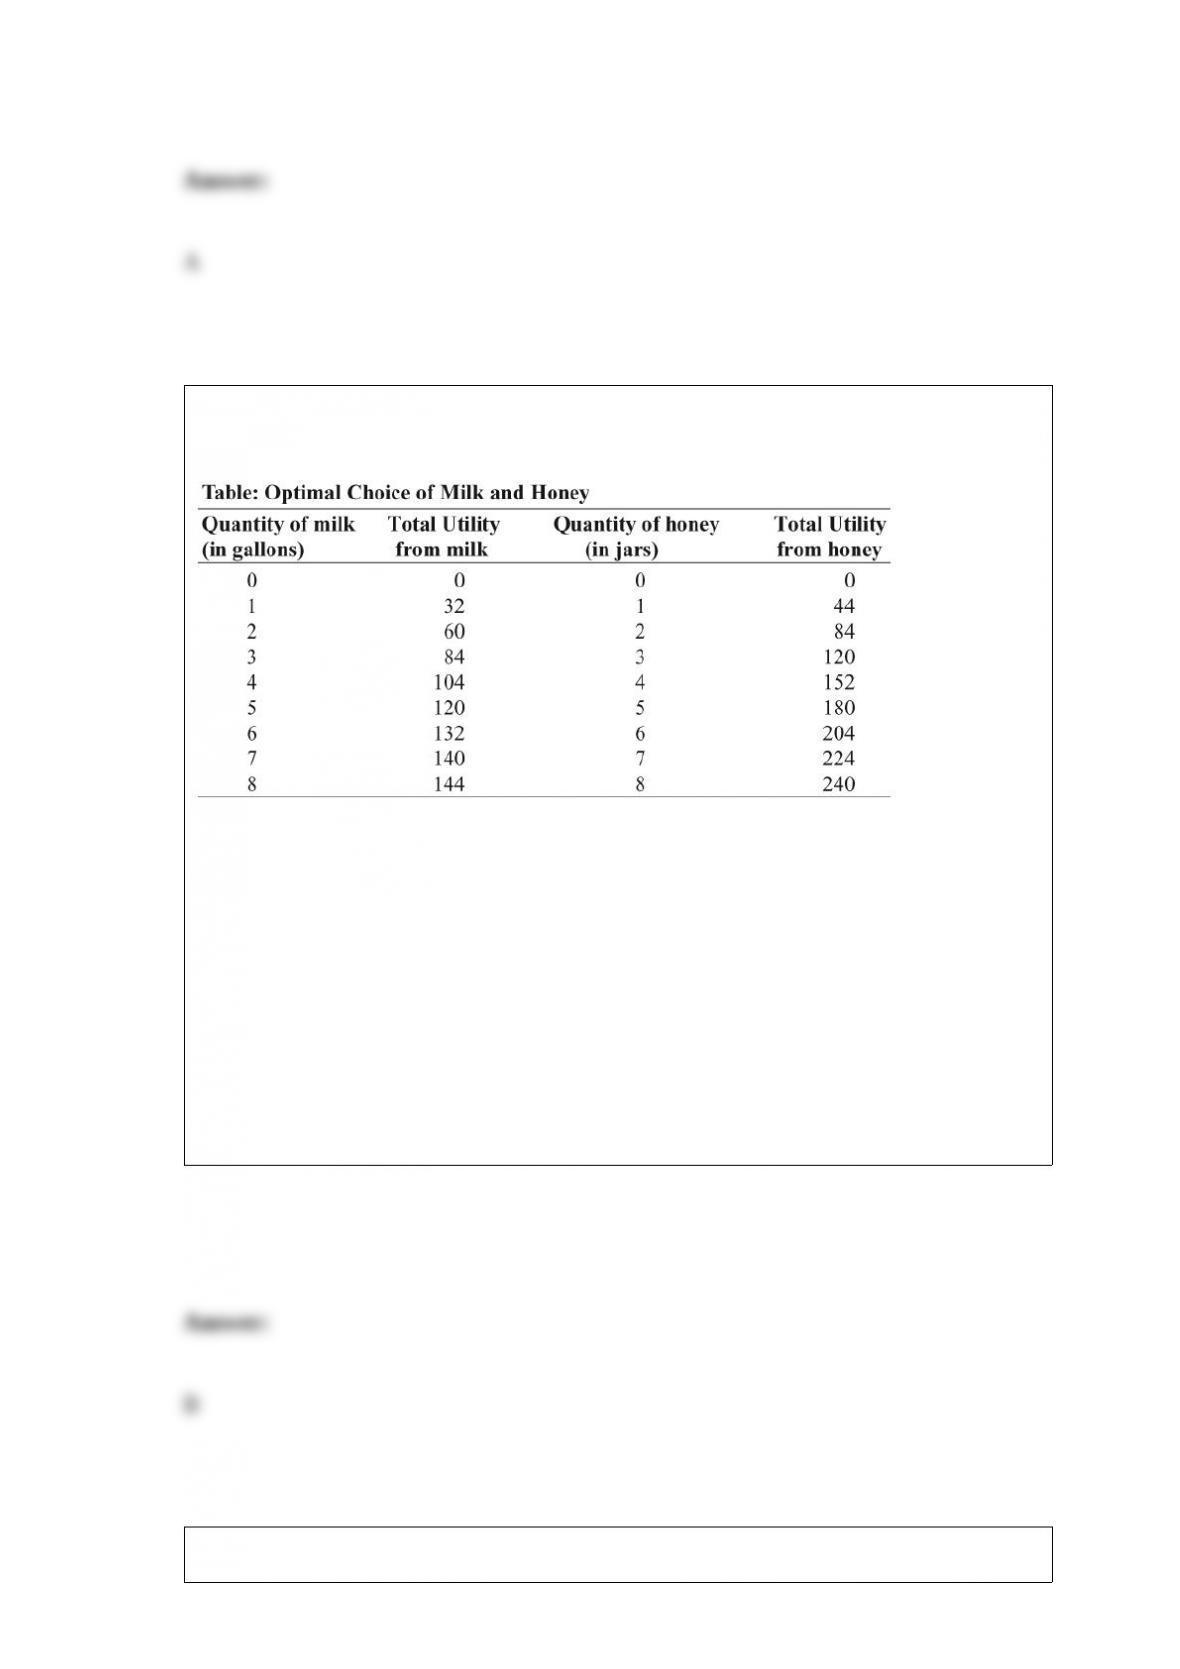
(Table: Optimal Choice of Milk and Honey) Look at the table Optimal Choice of Milk
and Honey. The price of milk is $2 per gallon, and the price of honey is $4 per jar. Hal’s
income is $16. If he buys 3 jars of honey and 2 gallons of milk, his total utility will be:
A) 7,200.
B) 180.
C) 120.
D) 60.
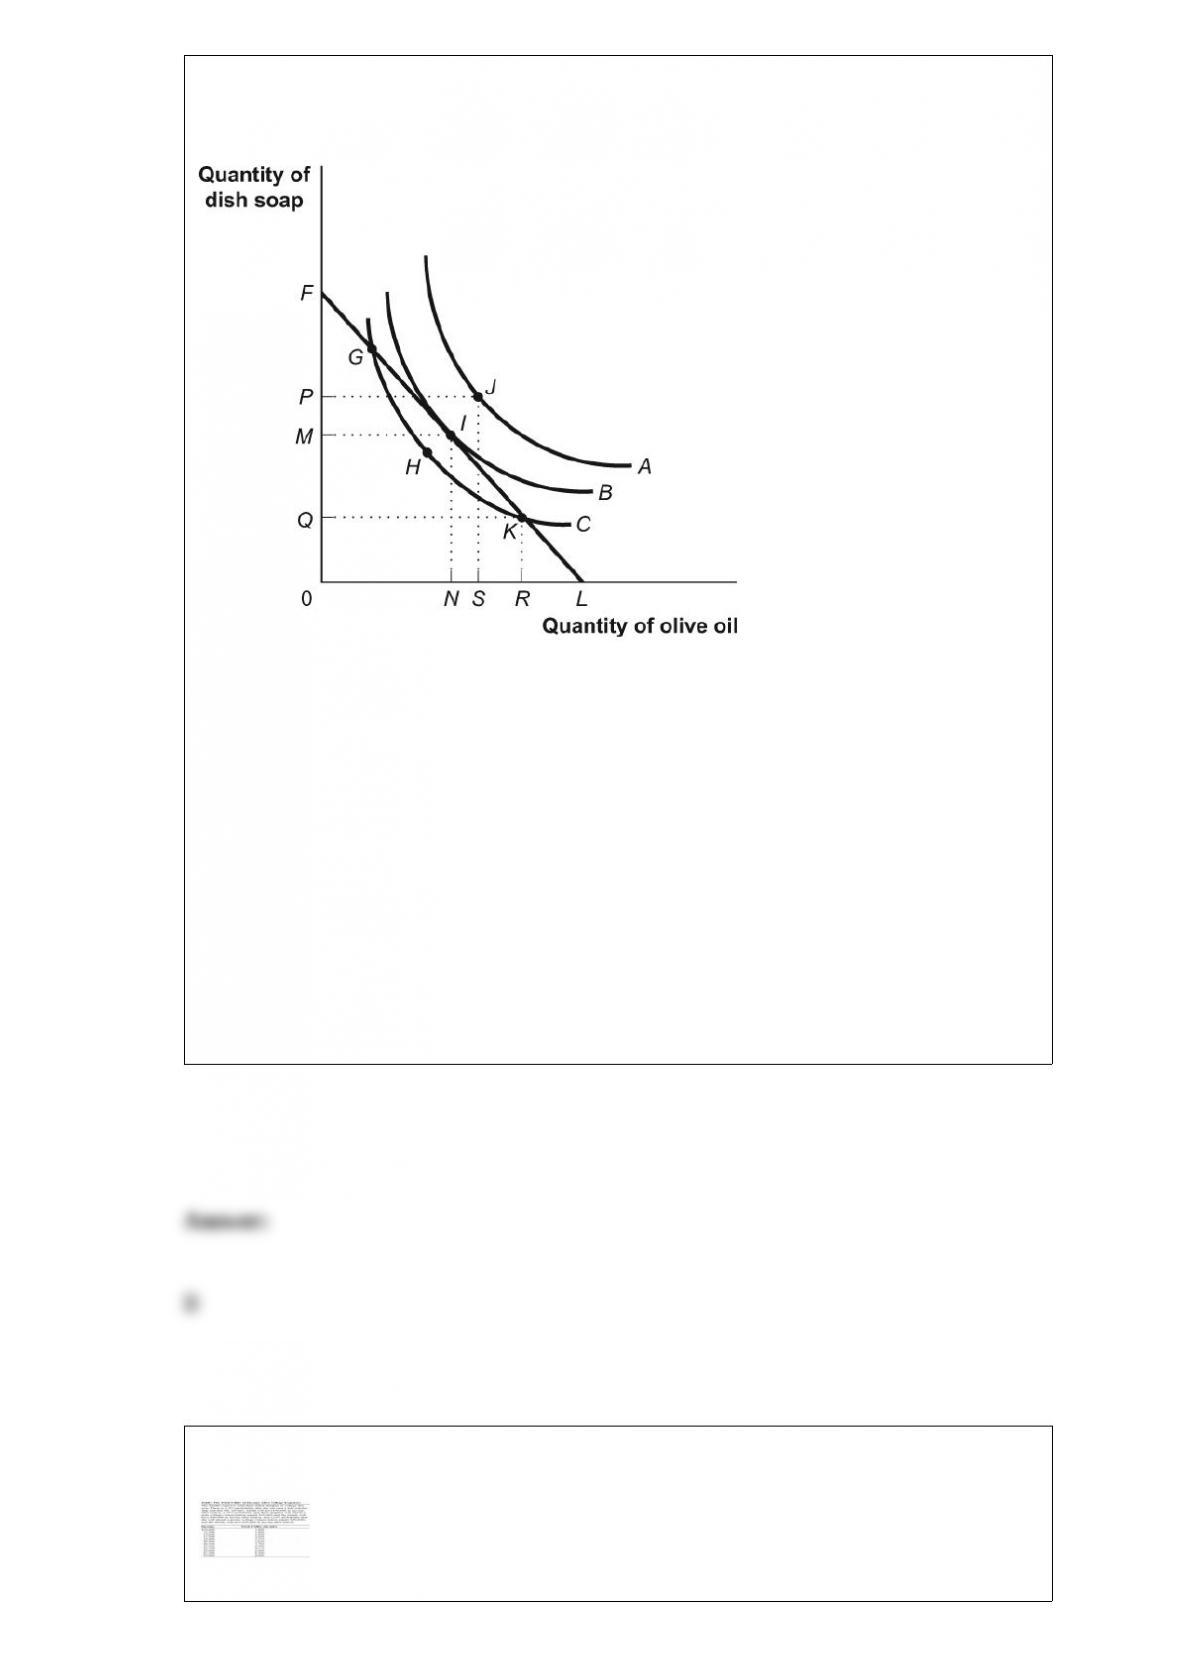
Figure: Consumer Equilibrium II
(Figure: Consumer Equilibrium II) Look at the figure Consumer Equilibrium II. Which
of the following is TRUE?
A) To increase utility beyond that received at point I requires an increase in the price of
olive oil.
B) Point J could be attained with an increase in Ashyra’s income.
C) An increase in the prices of olive oil and dish soap would allow Ashyra to attain
point J.
D) To increase utility beyond that received at point I requires an increase in the price of
dish soap.

(Table: Total Utility of Income After College Expenses) Look at the table Total Utility
of Income After College Expenses. The Smith family’s expected total utility is _____
utils.
A) 4,175
B) 3,700
C) 3,620
D) 3,210
A monopolist with a linear demand curve will:
A) not produce in the inelastic portion of its demand curve.
B) produce regardless of elasticity, since it is a monopolist.
C) not produce in the elastic portion of its demand curve.
D) produce only at the unit price-elastic portion of its demand curve.
Figure: Market Failure
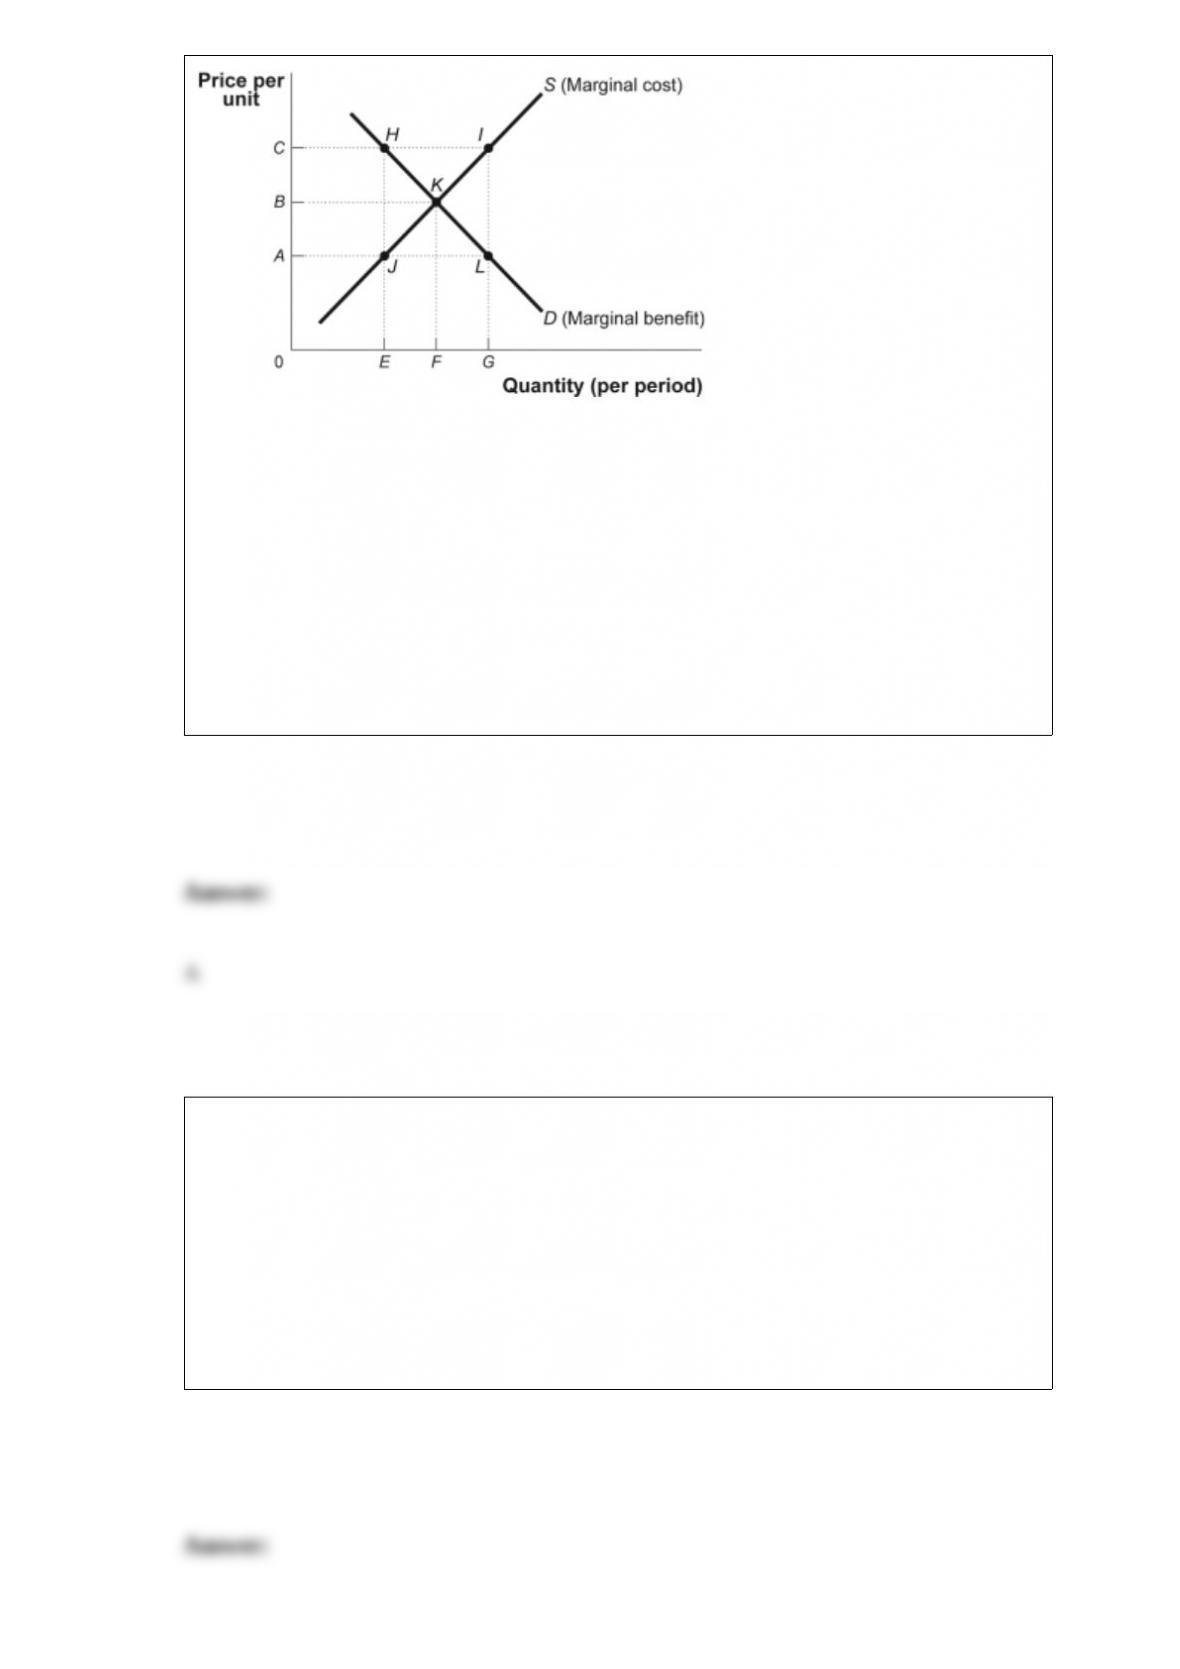
(Figure: Market Failure) In the figure Market Failure, if production in this competitive
market is at quantity F:
A) marginal benefit is equal to marginal cost.
B) marginal benefit is less than marginal cost.
C) marginal benefit is greater than marginal cost.
D) price is equal to marginal cost and greater than marginal benefit.
The _____ curve shows the additional cost of producing each additional unit of output.
A) average cost
B) total cost
C) marginal product
D) marginal cost
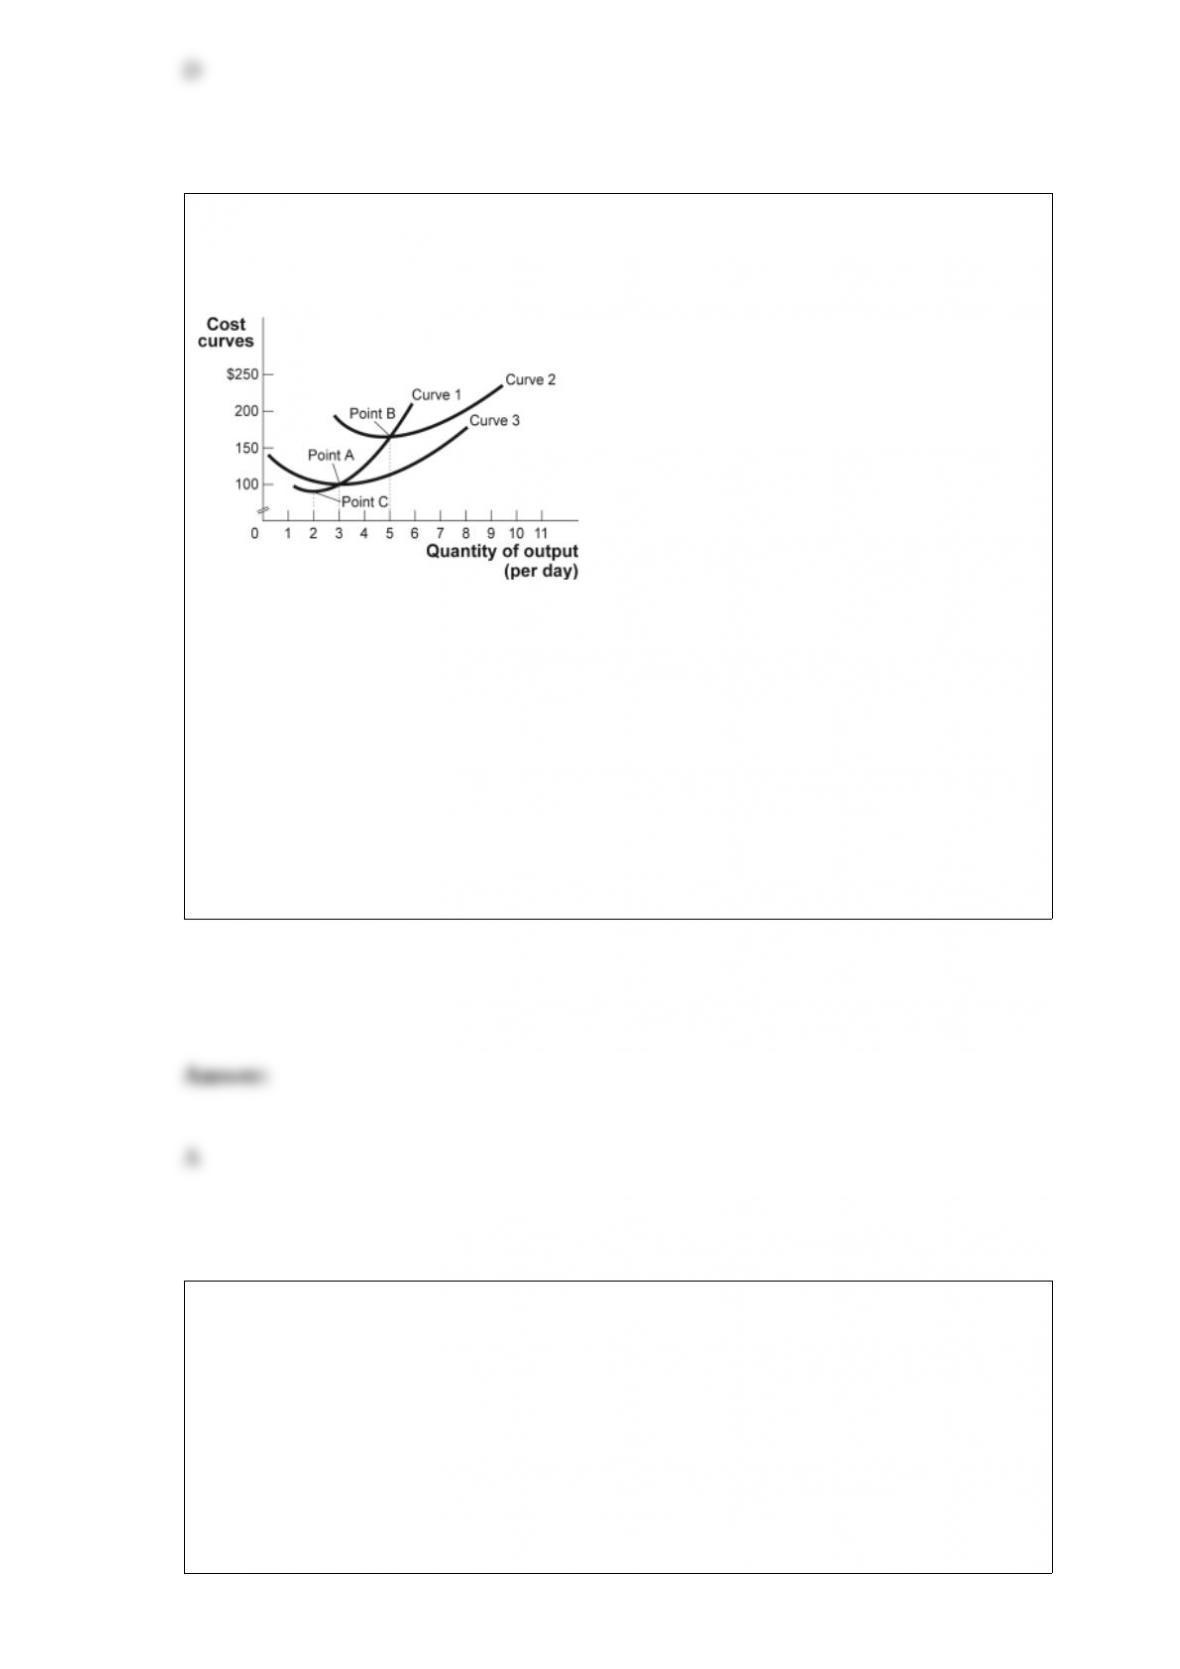
Figure: Short-Run Costs II
(Figure: Short-Run Costs II) Look at the figure Short-Run Costs II. Curve 1 crosses the
average total cost curve at:
A) the minimum value of curve 2.
B) approximately 4.3 units of output.
C) approximately 2.8 units of output.
D) point A.
A decrease in the price of a good will result in:
A) an increase in demand.
B) an increase in supply.
C) an increase in the quantity demanded.
D) an increase in the quantity supplied.
When the price of pencils decreases from $3 to $1, the quantity demanded increases
from 100 to 200 pencils. By the midpoint method, the price elasticity of demand equals:
A) 0.17.
B) 0.5.
C) 0.67.
D) 1.5.

Households buy goods and services in the _____ markets.
A) factor
B) product
C) resource
D) financial
Sonik, a wireless phone company, tested the effect of a price reduction for text
messaging. It lowered prices from $0.08 to $0.04 per message and found that the
number of messages sent tripled. This means:
A) the demand for text messaging is inelastic in this price range.
B) the demand curve for text messaging shifted to the right.
C) the supply curve for text messaging shifted to the left.
D) the demand for text messaging is elastic in this price range.
A regressive tax takes a:
A) fixed percentage of income.
B) lower percentage of income as income rises.

C) higher percentage of income as income rises.
D) lower percentage of income as income falls.
If personal income up to and including $25,000 is not taxed, income of $25,001 to
$50,000 is taxed at 10%, and income over $50,000 is taxed at 25%, a family earning
income equal to $60,000 will pay a marginal tax rate of _____ and an average tax rate
of _____.
A) 12.5%; 25%
B) 10%; 15%
C) 25%; 8.3%
D) 25%; 25%
A price floor is likely to cause deadweight loss because:
A) buyers incur additional search costs looking for the scarce good.
B) the quantity of the good is less than the equilibrium quantity.
C) a black market emerges and the good sells at prices above the price floor.
D) some buyers who want to buy at the controlled price are unable to find a seller
willing to sell at that price.
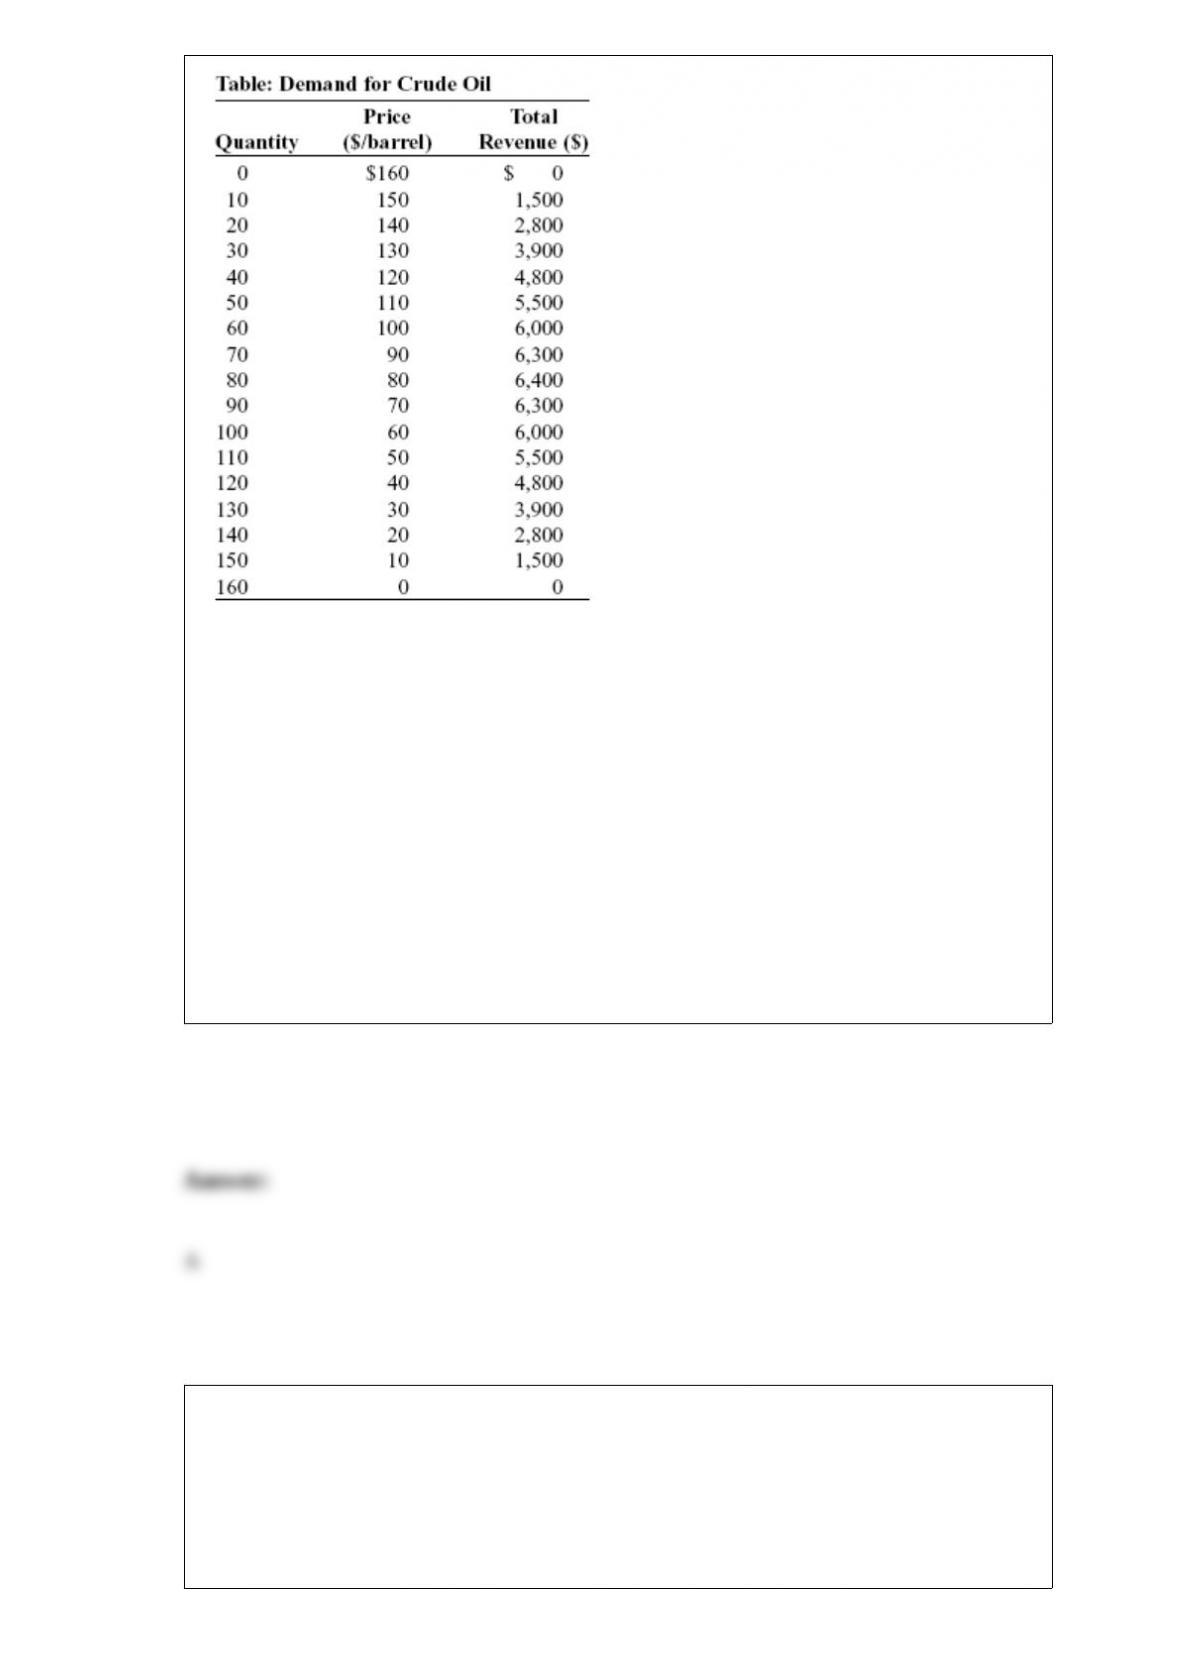
(Table: Demand for Crude Oil) Look at the table Demand for Crude Oil. The marginal
cost of producing crude oil is zero. If the crude oil industry is a monopoly, the price of
crude oil will be _____, the total quantity of crude oil produced by the monopoly will
be _____ barrels, and the monopoly will earn revenue equal to _____.
A) $80; 80; $6,400
B) $80; 80; $0
C) $160; 0; $0
D) $60; 100; $6,000
Mario sees popcorn and pretzels as perfect substitutes. He is always willing to
substitute 3 cups of popcorn for 1 cup of pretzels. If Mario consumes only pretzels, then
we know that the relative price of popcorn in terms of pretzels is:
A) less than 0.33.
B) between 0.33 and 3.
C) 3.
D) greater than 3.
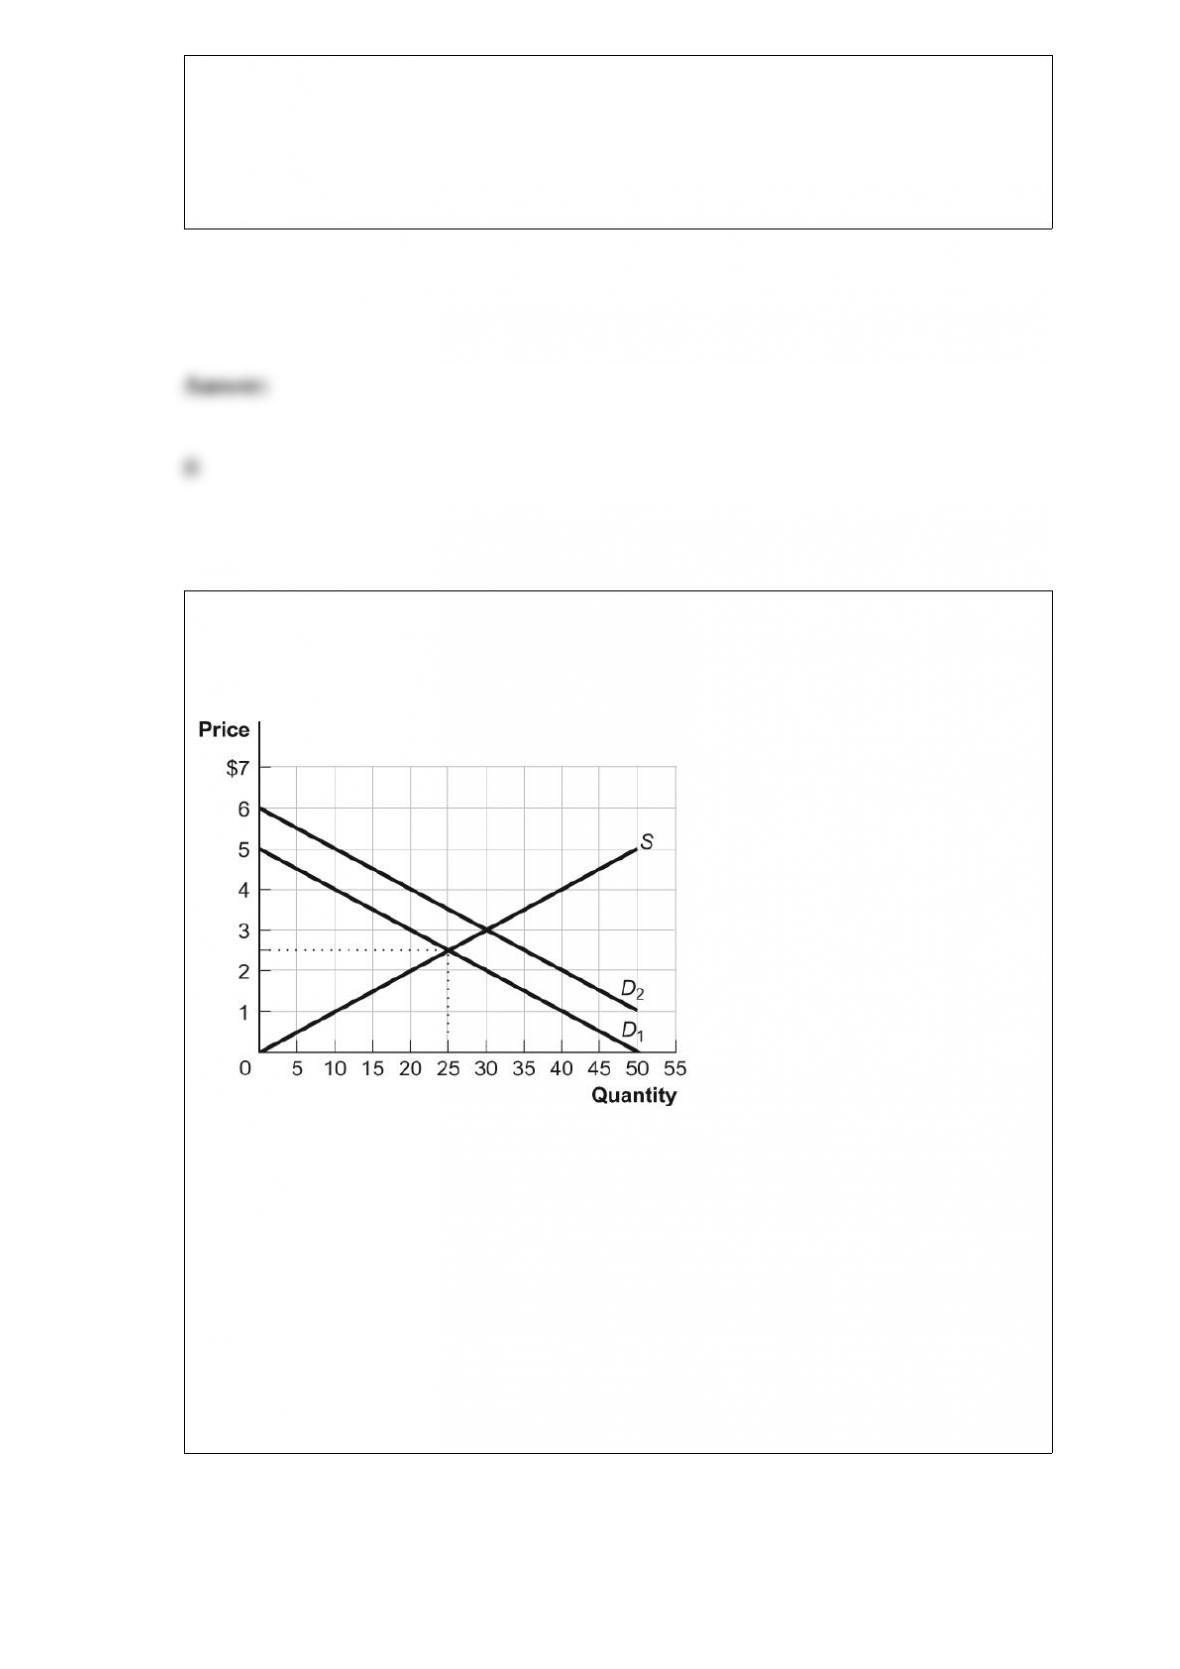
Figure: The Gains from Trade
(Figure: The Gains from Trade) Look at the figure The Gains from Trade. When
demand increases from D1 to D2, equilibrium total surplus:
A) decreases by $10.00.
B) increases by $12.75.
C) decreases by $15.00.
D) increases by $27.50.

(Table: Employment and Output) In the table Employment and Output, if the price of a
bushel of wheat is $10, then the value of the marginal product of the fifth worker is:
A) $11.
B) $110.
C) $90.
D) $750.
Which of the following best exemplifies the law of demand?
A) As income taxes rise, fewer new cars are purchased.
B) As the price of corn rises, more acres of corn are planted.
C) As the price of a car rental rises, fewer cars are rented.
D) As the population rises, more electricity is consumed.

One characteristic of a perfectly competitive market is that there are _____ sellers of
the good or service.
A) one or two
B) a few
C) usually fewer than 10
D) many
The production function provides information about:
A) a firm’s profit level.
B) the transformation of inputs into output.
C) the location of the firm’s production.
D) a firm’s market structure.
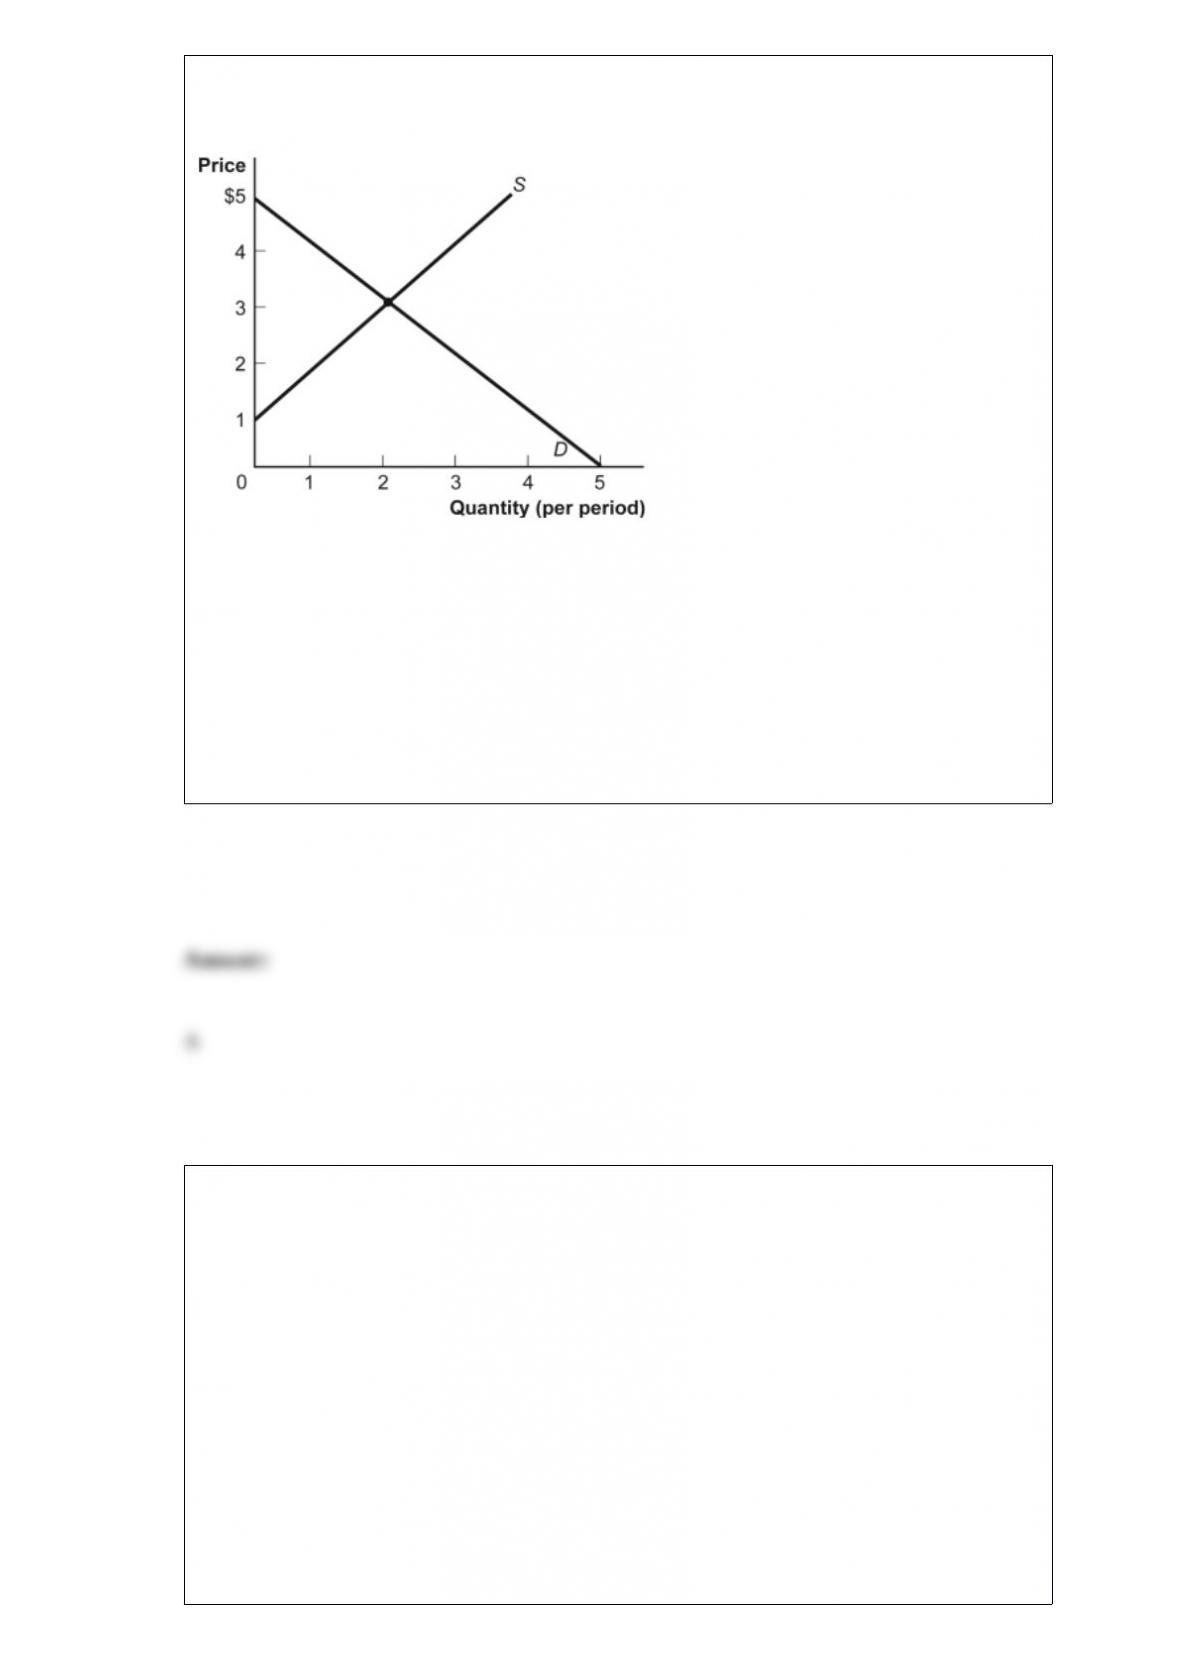
Figure: Demand and Supply
(Figure: Demand and Supply) Look at
the figure Demand and Supply. The slope of the curve labeled D is:
A) “1.
B) 0.
C) 1.
D) 3.
Scenario: Used Car Market
In the used car market, cars of poor quality are called lemons, while cars of good
quality are plums. Suppose the probability of obtaining a lemon is 60% and the
probability of obtaining a plum is 40%. Also assume a plum is worth $15,000 and a
lemon is worth $3,000.
(Scenario: Used Car Market) Look at the scenario Used Car Market. Adverse selection
in this used car market occurs because of:
A) asymmetric information.
B) risk-loving behavior.
C) moral hazard.
D) diversification.
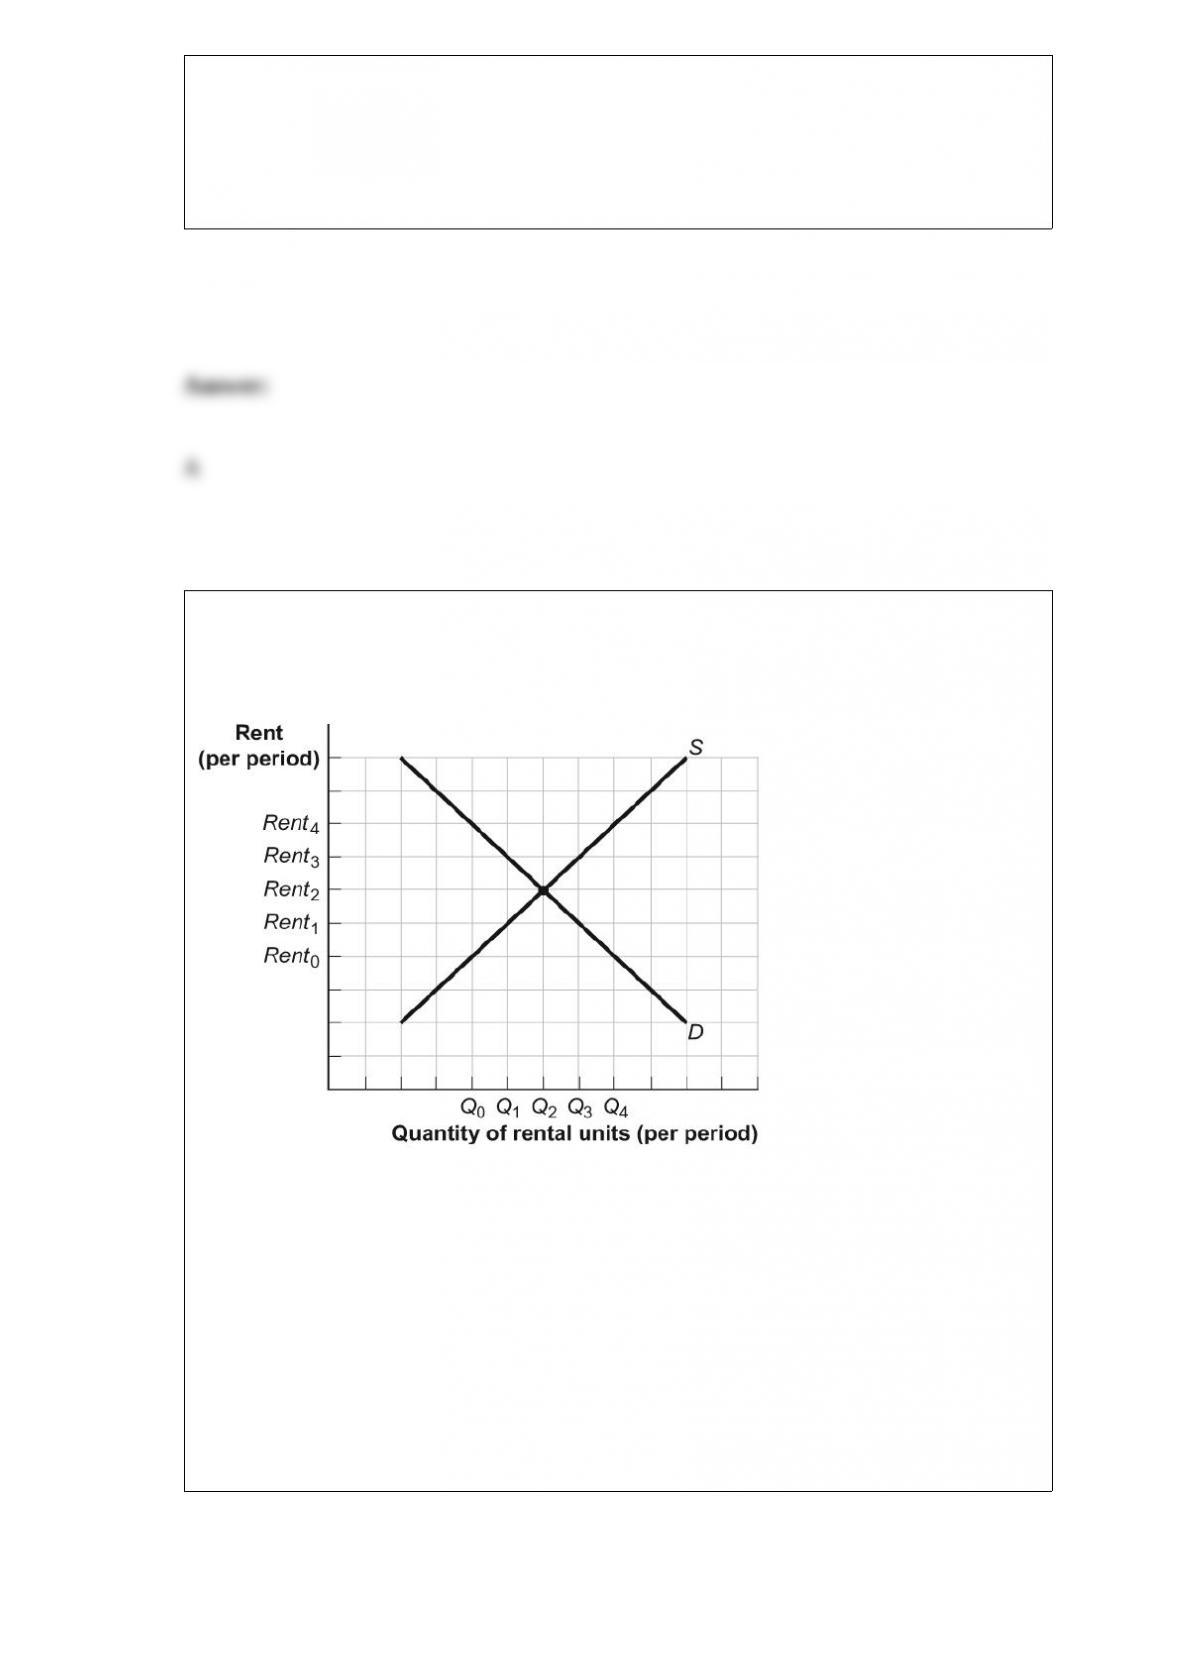
Figure: Rent Controls
(Figure: Rent Controls) Look at the figure Rent Controls. If rent controls are set at
Rent1:
A) rental apartments may be of inefficiently low quality.
B) there will be an efficient allocation of rentals.
C) some landlords may break the law by renting below the mandated price.
D) new apartments will be constructed.

Control of a scarce resource or input, economies of scale, technological superiority, and
government-set rules and regulations are forms of:
A) market structure.
B) pricing behavior.
C) barriers to entry.
D) public policy.
Suppose the government imposes a $9 per month tax on cell phone service. If the
demand curve for cell phone service is perfectly elastic and the supply curve is
upward-sloping, the monthly price for cell phone service will:
A) increase by $4.50.
B) increase by more than $9.
C) increase by $9.
D) not change.