Jane decides to spend four hours working overtime rather than going to a family
gathering. She earns $12.50 per hour for overtime work. Her opportunity cost of
working is
a. the $50 she earns working.
b. the $50 minus the enjoyment she would have received from going to the family
gathering.
c. the enjoyment she would have received had she gone to the family gathering
d. nothing, since she wanted to work more than she wanted to attend the family
gathering
The point where both x and y are zero is known as the
a. origin.
b. null.
c. zero coordinate.
d. center.
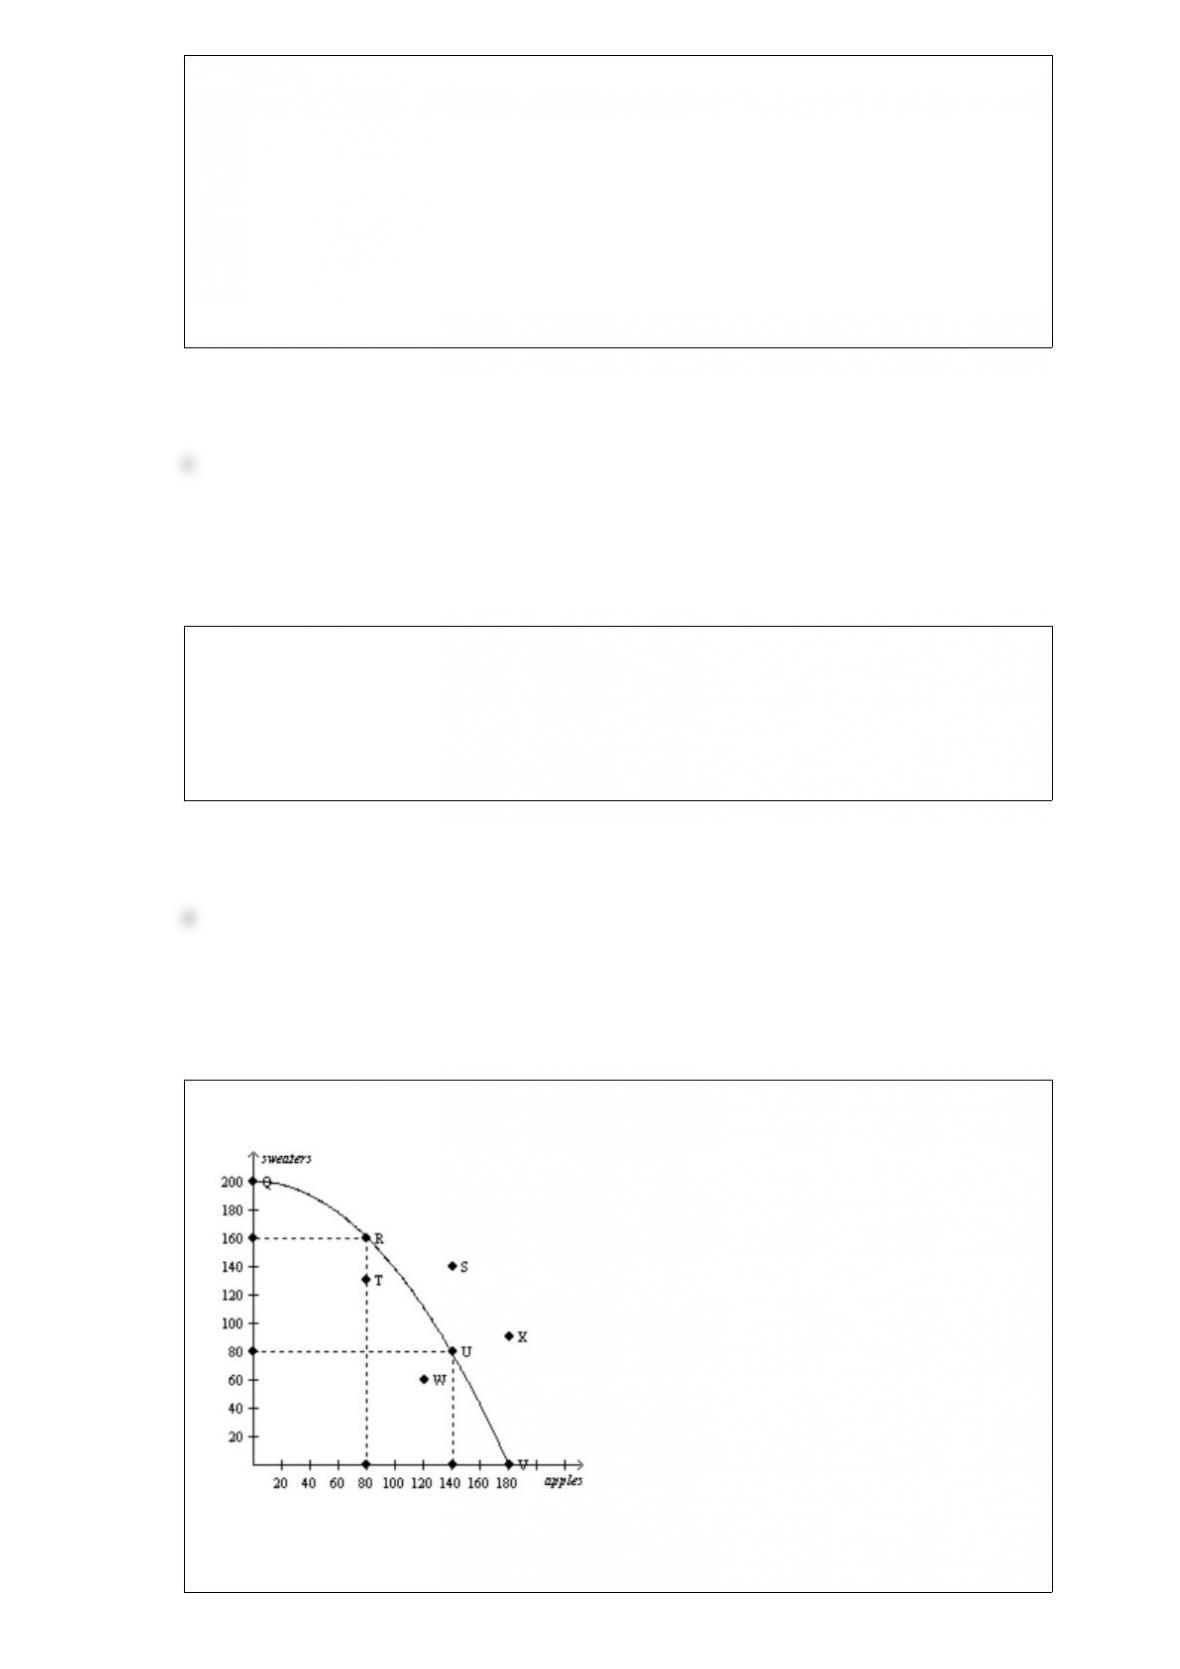
Figure 214
Consider the production possibilities curve for a country that can produce sweaters,
apples (in bushels), or a combination of the two

Refer to Figure 214. If this society is producing at point T,
a. there is unemployment.
b. production is efficient.
c. growth can only be achieved through an advancement in technology.
d. the opportunity cost of producing one more sweater is approximately 40 bushels of
apples.
Table 310
Assume that Japan and Korea can switch between producing cars and producing
airplanes at a constant rate.
Hours Needed to Make 1Quantity Produced in 2400 Hours
CarAirplaneCarAirplane
Japan301508016
Korea 501504816
Refer to Table 310. We could use the information in the table to draw a production
possibilities frontier for Japan and a second production possibilities frontier for Korea.
If we were to do this, measuring airplanes along the horizontal axis, then
a. the slope of Japan’s production possibilities frontier would be 5 and the slope of
Korea’s production possibilities frontier would be 3.
b. the slope of Japan’s production possibilities frontier would be 0.2 and the slope of
Korea’s production possibilities frontier would be 0.33.
c. the slope of Japan’s production possibilities frontier would be 0.2 and the slope of
Korea’s production possibilities frontier would be 0.33.
d. the slope of Japan’s production possibilities frontier would be 5 and the slope of
Korea’s production possibilities frontier would be 3.
Figure 313
Peru’s Production Possibilities Frontier
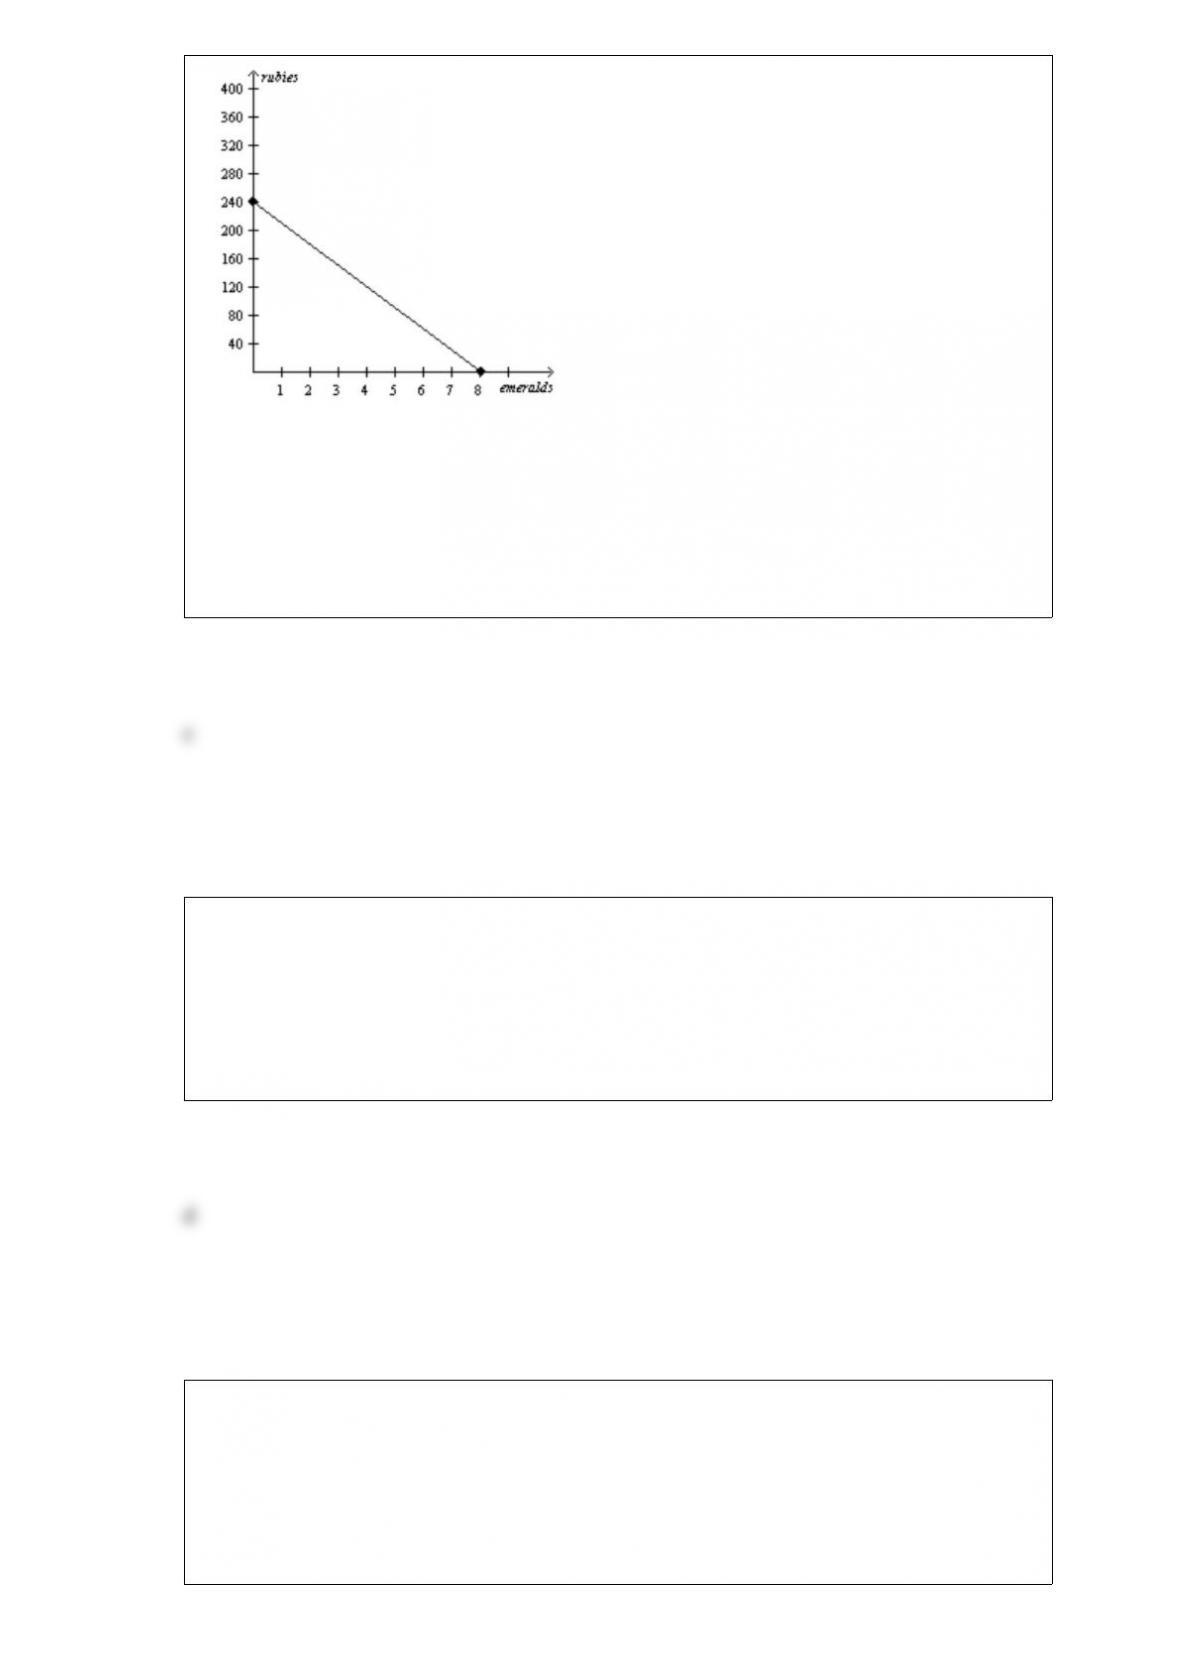
Refer to Figure 313. Suppose Peru decides to increase its production of rubies by 30.
What is the opportunity cost of this decision?
a. 1/8 emerald
b. 1/3 emerald
c. 1 emerald
d. 3 emeralds
When a country that exported a particular good abandons a freetrade policy and adopts
a notrade policy,
a. producer surplus increases and total surplus increases in the market for that good.
b. producer surplus increases and total surplus decreases in the market for that good.
c. producer surplus decreases and total surplus increases in the market for that good.
d. producer surplus decreases and total surplus decreases in the market for that good.
In considering how to allocate its scarce resources among its various members, a
household considers
a. each member’s abilities.
b. each member’s efforts.
c. each member’s desires.
d. All of the above are correct.
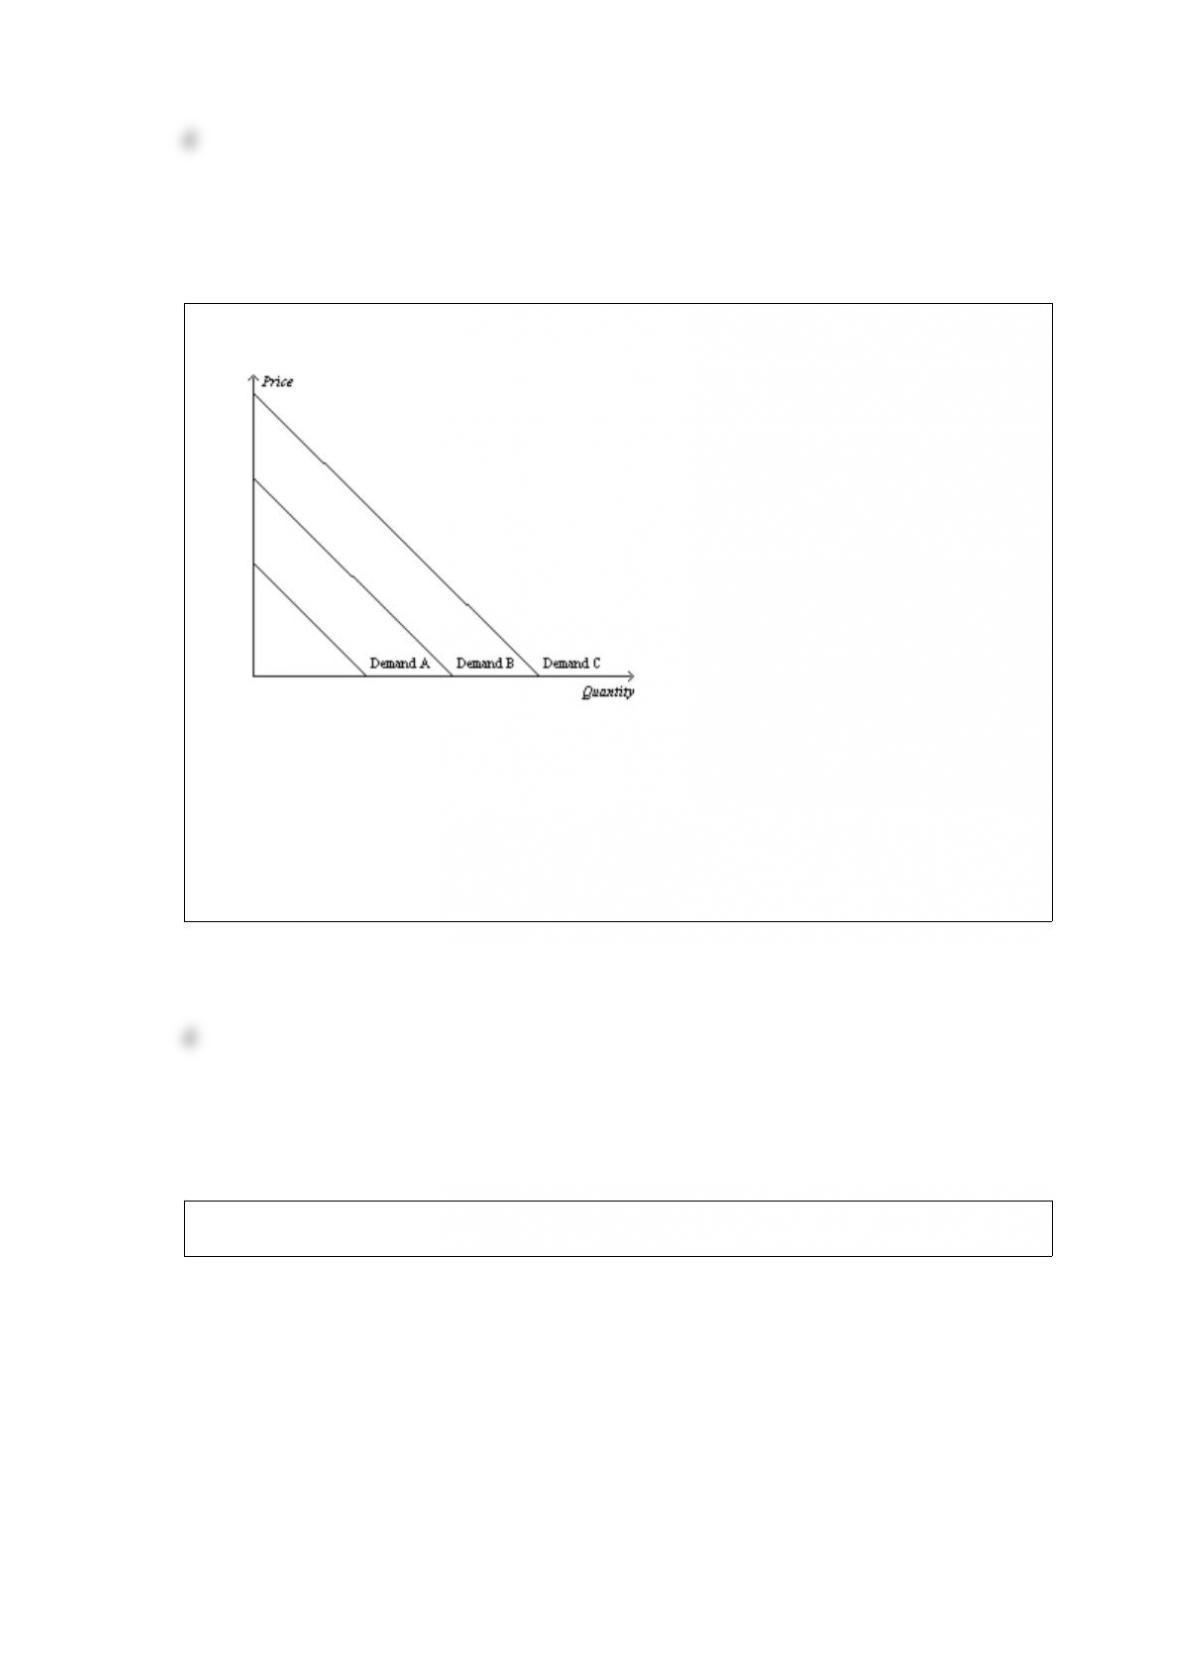
Figure 45
Refer to Figure 45. Which of the following would cause the demand curve to shift
from Demand C to Demand A in the market for tennis balls in the United States?
a. an increase in the price of tennis balls
b. a decrease in the price of tennis racquets
c. an expectation by buyers that their incomes will increase in the very near future
d. a decrease in the number of people in the United States under age 70
Figure 53

Refer to Figure 53. Which demand curve is unit elastic?
a. A
b. B
c. D
d. None of the above.
If the price elasticity of demand for a good is 1, then a 3 percent decrease in price
results in a
a. 0.1 percent increase in the quantity demanded.
b. 1 percent increase in the quantity demanded.
c. 3 percent increase in the quantity demanded.
d. 4 percent increase in the quantity demanded.
Figure 715
Refer to Figure 715. Area A represents
a. producer surplus to new producers entering the market as the result of an increase in
price from P1 to P2.
b. the increase in consumer surplus that results from an upwardsloping supply curve.
c. the increase in total surplus when sellers are willing and able to increase supply from
Q1 to Q2.
d. the increase in producer surplus to those producers already in the market when the
price increases from P1 to P2.
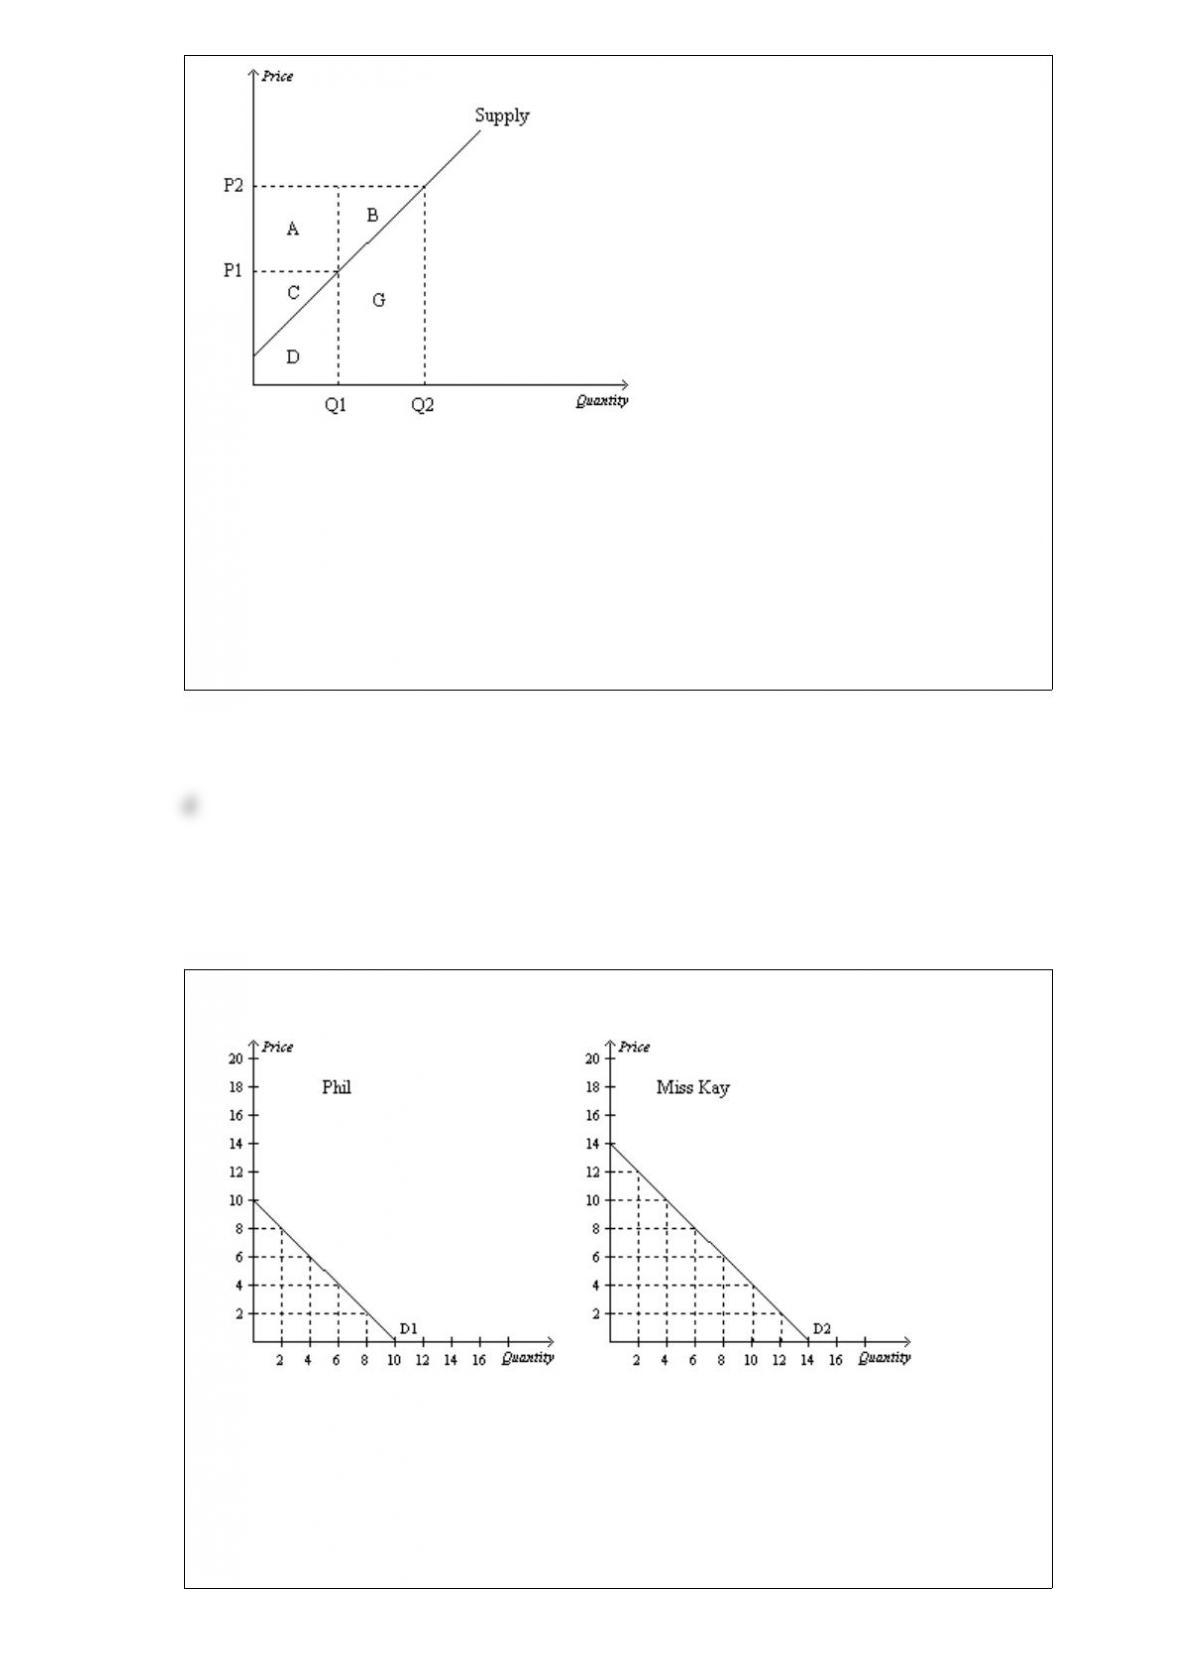
Figure 42
Refer to Figure 42. Suppose Phil and Miss Kay are the only consumers in the market.
If the price is $10, then the market quantity demanded is
a. 0 units.
b. 2 units.
c. 4 units.
d. 6 units.
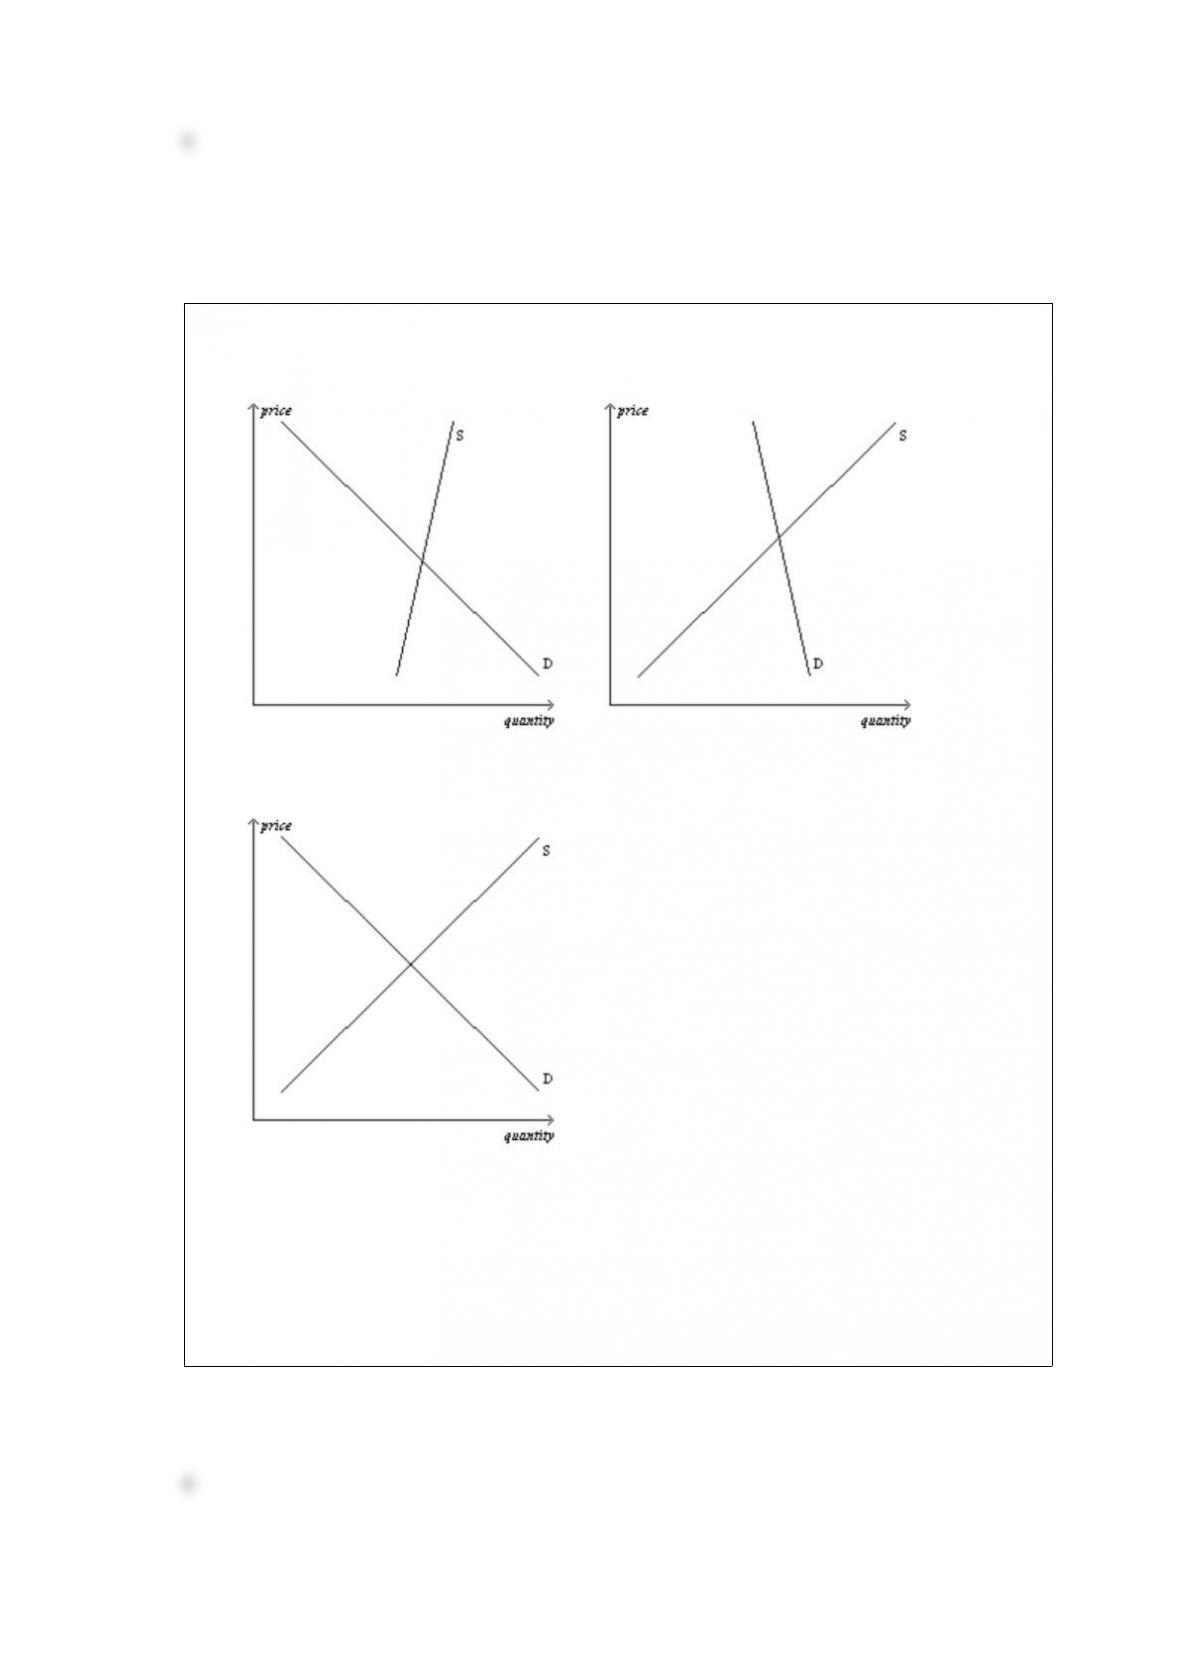
Figure 630
Panel (a)Panel (b)
Panel (c)
Refer to Figure 630. In which market will the tax burden be most equally divided
between buyers and sellers?
a. the market shown in panel (a).
b. the market shown in panel (b).
c. the market shown in panel (c).
d. All of the above are correct.

Suppose a tax is imposed on each new hearing aid that is sold. The supply curve is a
typical upwardsloping straight line, and the demand curve is a typical downwardsloping
straight line. As a result of the tax, the equilibrium quantity of hearing aids decreases
from 10,000 to 9,000, and the deadweight loss of the tax is $60,000. We can conclude
that the tax on each hearing aid is
a. $60.
b. $120.
c. $160.
d. $200.
An increase in the number of college scholarships issued by private foundations would
a. increase the supply of education.
b. decrease the supply of education.
c. increase the demand for education.
d. decrease the demand for education.
When the nation of Brownland first permitted trade with other nations, domestic
producers of wheat experienced an increase in producer surplus of $4 million and total
surplus in Brownland’s wheat market increased by $1 million. We can conclude that
a. Brownland became an exporter of wheat.
b. consumer surplus in Brownland increased by $3 million.
c. the opening of trade caused the domestic supply curve for wheat in Brownland to
shift to the left.
d. this example is inconsistent with the economic theory of international trade.
An example of a perfectly competitive market would be the
a. cable TV market.
b. soybean market.
c. breakfast cereal market.
d. shampoo market.
Producer surplus is the
a. area under the supply curve to the left of the amount sold.
b. amount a seller is paid minus the cost of production.
c. area between the supply and demand curves, above the equilibrium price.
d. cost to sellers of participating in a market.
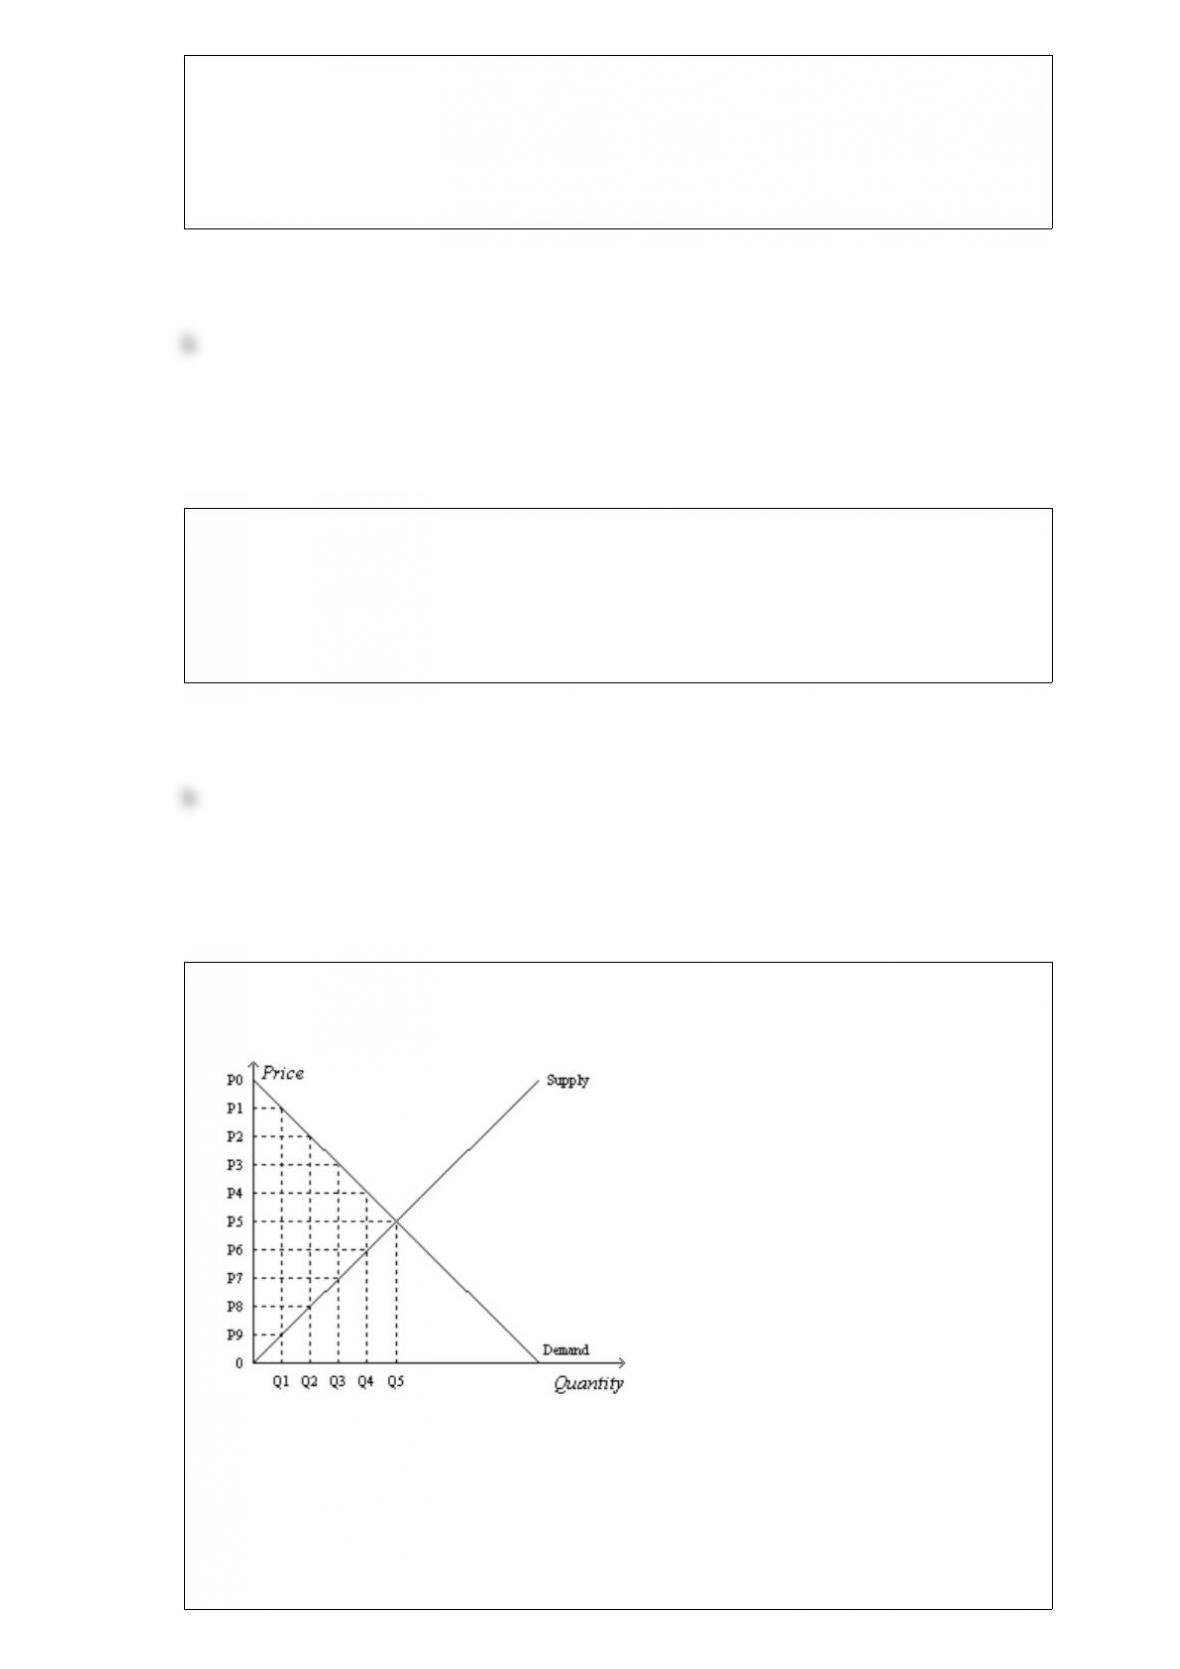
Figure 810
Refer to Figure 810. Suppose the government imposes a tax that reduces the quantity
sold in the market after the tax to Q2. The price that buyers pay is
a. P0.
b. P2.
c. P5.
d. P8.
A drought in California destroys many red grapes. As a result of the drought, the
consumer surplus in the market for red grapes
a. increases, and the consumer surplus in the market for red wine increases.
b. increases, and the consumer surplus in the market for red wine decreases.
c. decreases, and the consumer surplus in the market for red wine increases.
d. decreases, and the consumer surplus in the market for red wine decreases.
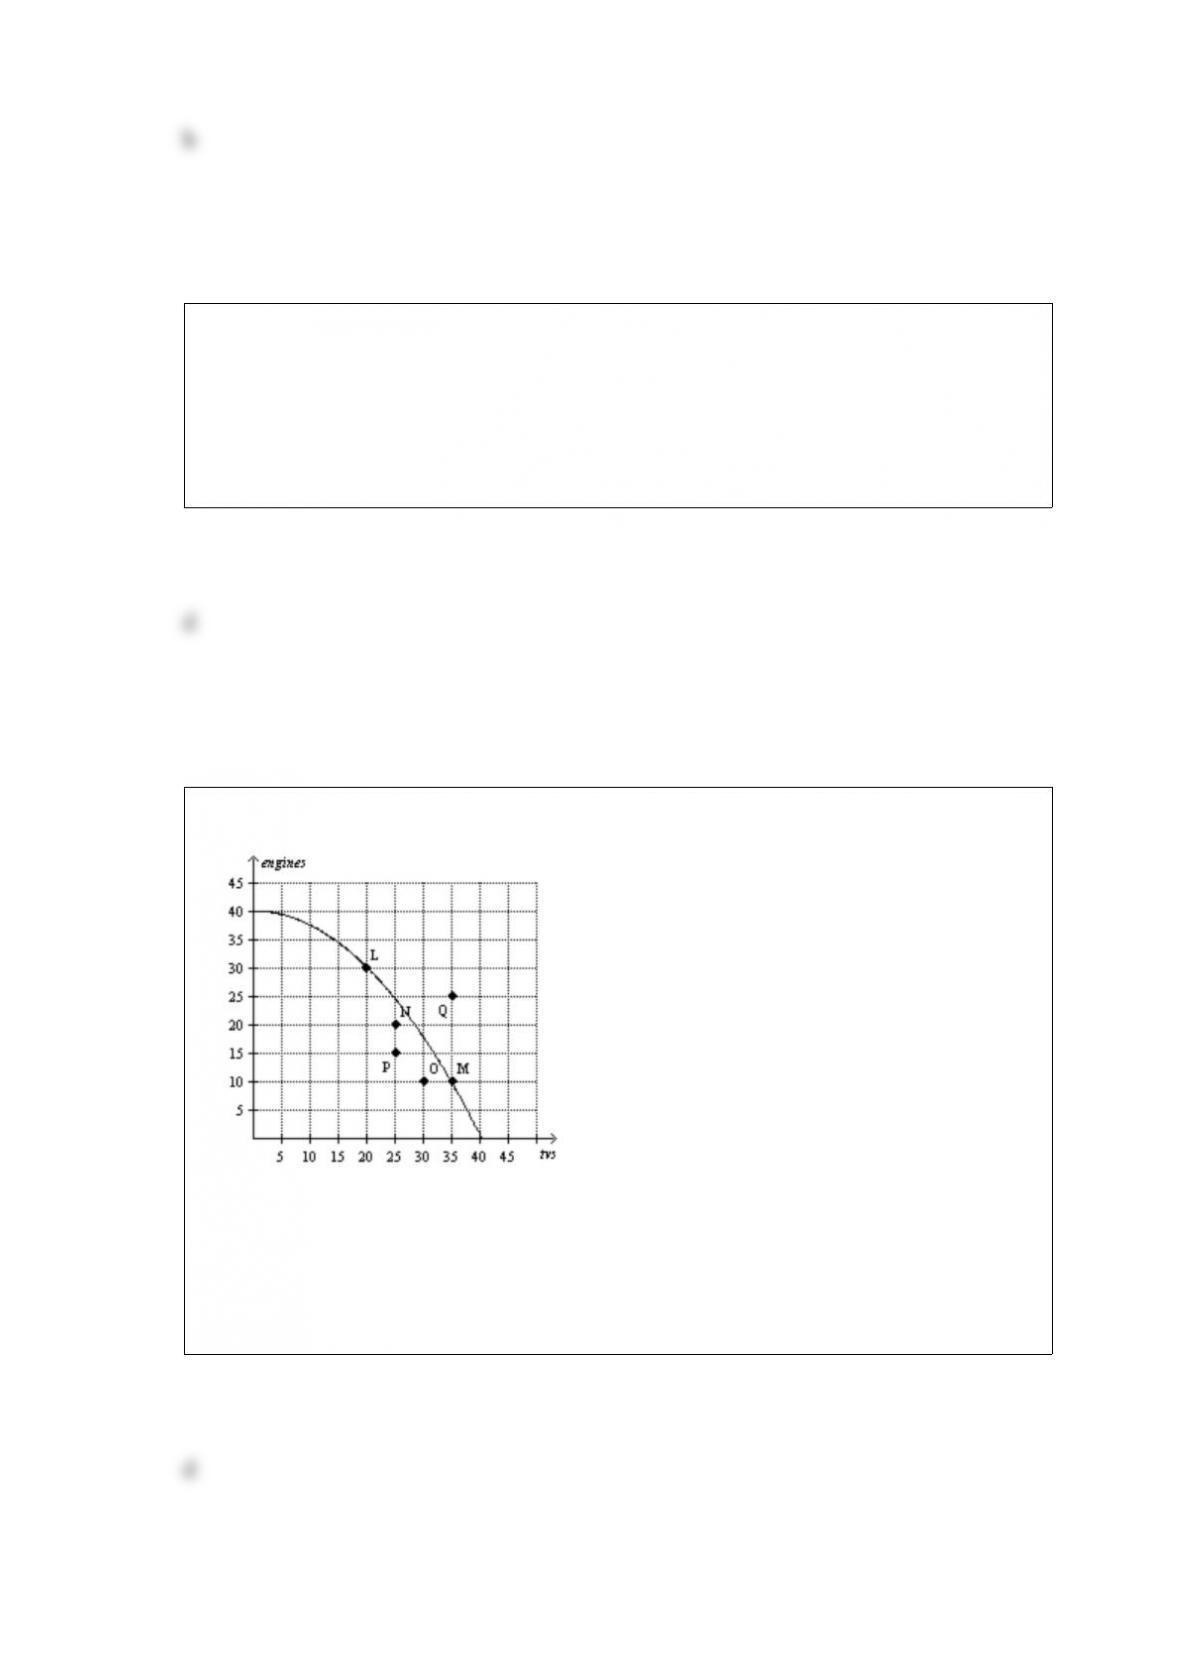
Figure 27
Refer to Figure 27. This economy cannot produce at which point(s)?
a. L, M
b. N, O, P, Q
c. N, O, P
d. Q

When a tax is placed on the sellers of cell phones, the size of the cell phone market
a. and the price paid by buyers both increase.
b. increases, but the price paid by buyers decreases.
c. decreases, but the price paid by buyers increases.
d. and the price paid by buyers both decrease.
To fully understand how taxes affect economic wellbeing, we must compare the
a. benefit to buyers with the loss to sellers.
b. price paid by buyers to the price received by sellers.
c. profits earned by firms to the losses incurred by consumers.
d. decrease in total surplus to the increase in revenue raised by the government.
Which of the following is likely to have the most price inelastic demand?
a. chocolate
b. Godiva chocolate
c. Hershey’s chocolate
d. All three would have the same elasticity of demand because they are all related.
Table 323
Assume that the farmer and the rancher can switch between producing pork and
producing tomatoes at a constant rate.
Labor Hours Needed to Make 1 Pound of Pounds Produced in 24 Hours
PorkTomatoesPorkTomatoes
Farmer6348
Rancher4466
Refer to Table 323. The opportunity cost of 1 pound of tomatoes for the rancher is
a. 1 pound of pork.
b. 1 hour of labor.
c. 1.5 pounds of pork.
d. 1.5 hours of labor.
The mayor of Workerville proposes a local payroll tax to fund a new water park for the
city. The mayor proposes to collect half the tax from workers and half the tax from
firms. Workers will bear
a. an equal share of the tax in comparison to firms.
b. a greater share of the tax in comparison to firms.
c. a smaller share of the tax in comparison to firms.
d. All of the above are possible.
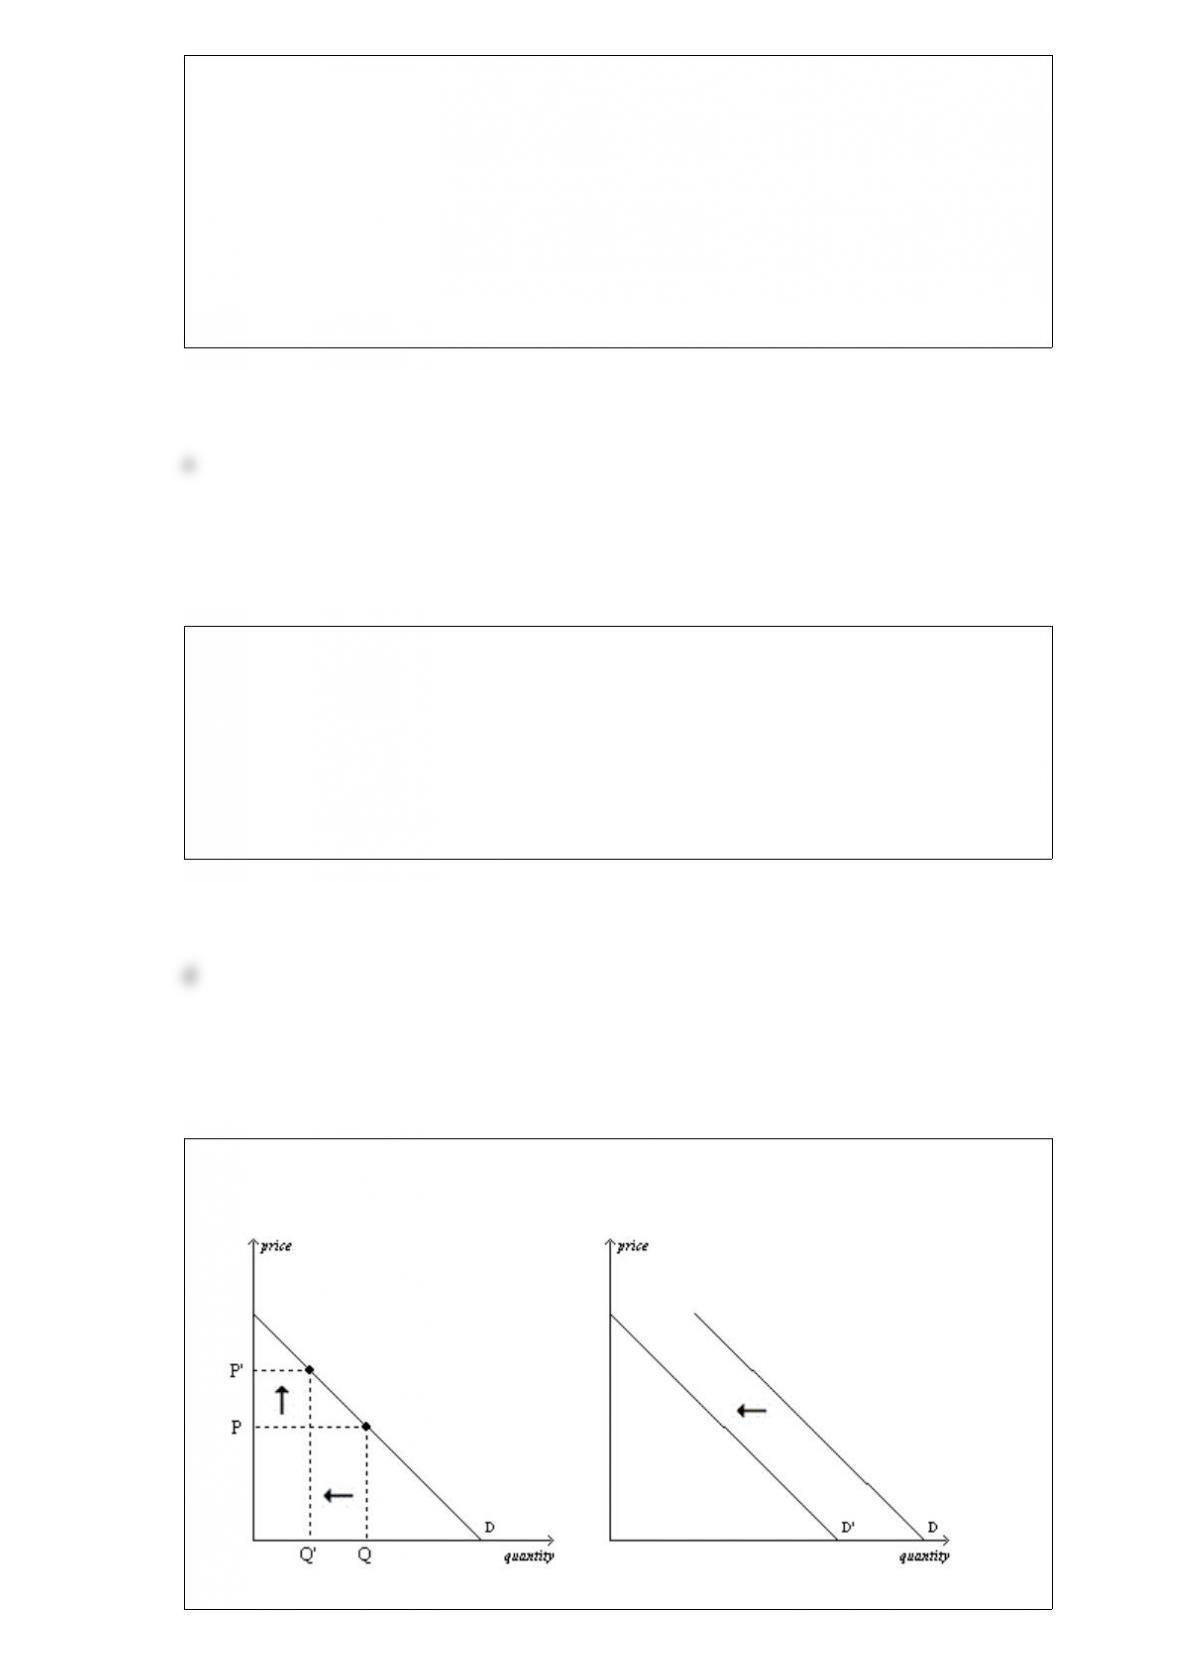
Figure 49
Panel (a)Panel (b)

Refer to Figure 49. The graphs show the demand for cigarettes. In Panel (a), the
arrows are consistent with which of the following events?
a. The price of marijuana, a complement to cigarettes, increased.
b. Mandatory health warnings were placed on cigarette packages.
c. Several foreign countries banned U.S. cigarettes in their countries.
d. A tax was placed on cigarettes.
The midpoint method for calculating elasticities is convenient in that it allows us to
a. ignore the percentage change in quantity demanded and instead focus entirely on the
percentage change in price.
b. calculate the same value for the elasticity, regardless of whether the price increases or
decreases.
c. assume that sellers’ total revenue stays constant when the price changes.
d. restrict all elasticity values to between 0 and 1.
Table 62
PriceQuantity
DemandedQuantity
Supplied
$03750
$530050
$10225100
$15150150
$2075200
$250250
Refer to Table 62. A price ceiling set at $20 will
a. be binding and will result in a shortage of 75 units.
b. be binding and will result in a shortage of 200 units.
c. be binding and will result in a shortage of 125 units.
d. not be binding.

If the demand for a product increases, then we would expect equilibrium price
a. to increase and equilibrium quantity to decrease.
b. to decrease and equilibrium quantity to increase.
c. and equilibrium quantity both to increase.
d. and equilibrium quantity both to decrease.
Olivia was accepted by Northwestern and by another university. She is trying to decide
where to go. Which of the following should influence her decision?
a. how much she spent applying to Northwestern, and the difference between living
expenses at Northwestern and the other university
b. how much she spent applying to Northwestern, but not the difference between living
expenses at Northwestern and the other university
c. the difference between living expenses at Northwestern and her second choice, but
not how much she spent applying to Northwestern
d. neither how much she spent applying to Northwestern nor the difference between
living expenses at Northwestern and her second choice