
The Soviet Union consistently increased the amount of capital available to its workers,
but found that increases in capital resulted in progressively smaller and smaller
increases in GDP per worker. This phenomenon is referred to as
A) a rising standard of living.
B) diminishing returns to capital.
C) new growth theory.
D) a shift of the per-worker production function.
Suppose the economy is at full employment and firms become more pessimistic about
the future profitability of new investment. Which of the following will happen in the
short run?
A) Output will rise.
B) Prices will rise.
C) Unemployment will rise.
D) The aggregate demand curve will shift to the right.
Contractionary fiscal policy to prevent real GDP from rising above potential real GDP
would cause the inflation rate to be ________ and real GDP to be ________.
A) higher; higher
B) higher; lower

C) lower; higher
D) lower; lower
In the United States in 2012, the percentage of firms that employed between 3 and 199
workers and did not offer health insurance as a fringe benefit to the workers was about
A) 2%.
B) 39%.
C) 61%.
D) 98%.
The unemployment rate is an important economic statistic that can tell us about the
health of the economy. If the unemployment rate turns out to be high or higher than
anticipated, we would expect
A) it is more likely that an incumbent president will be re-elected.
B) that stock prices are more likely to fall.
C) that jobs are less difficult to find.
D) that investors will be more optimistic about the economy.
Which of the following would be the best measure of the cost of living?
A) real GDP
B) real GDP per person
C) GDP deflator
D) consumer price index
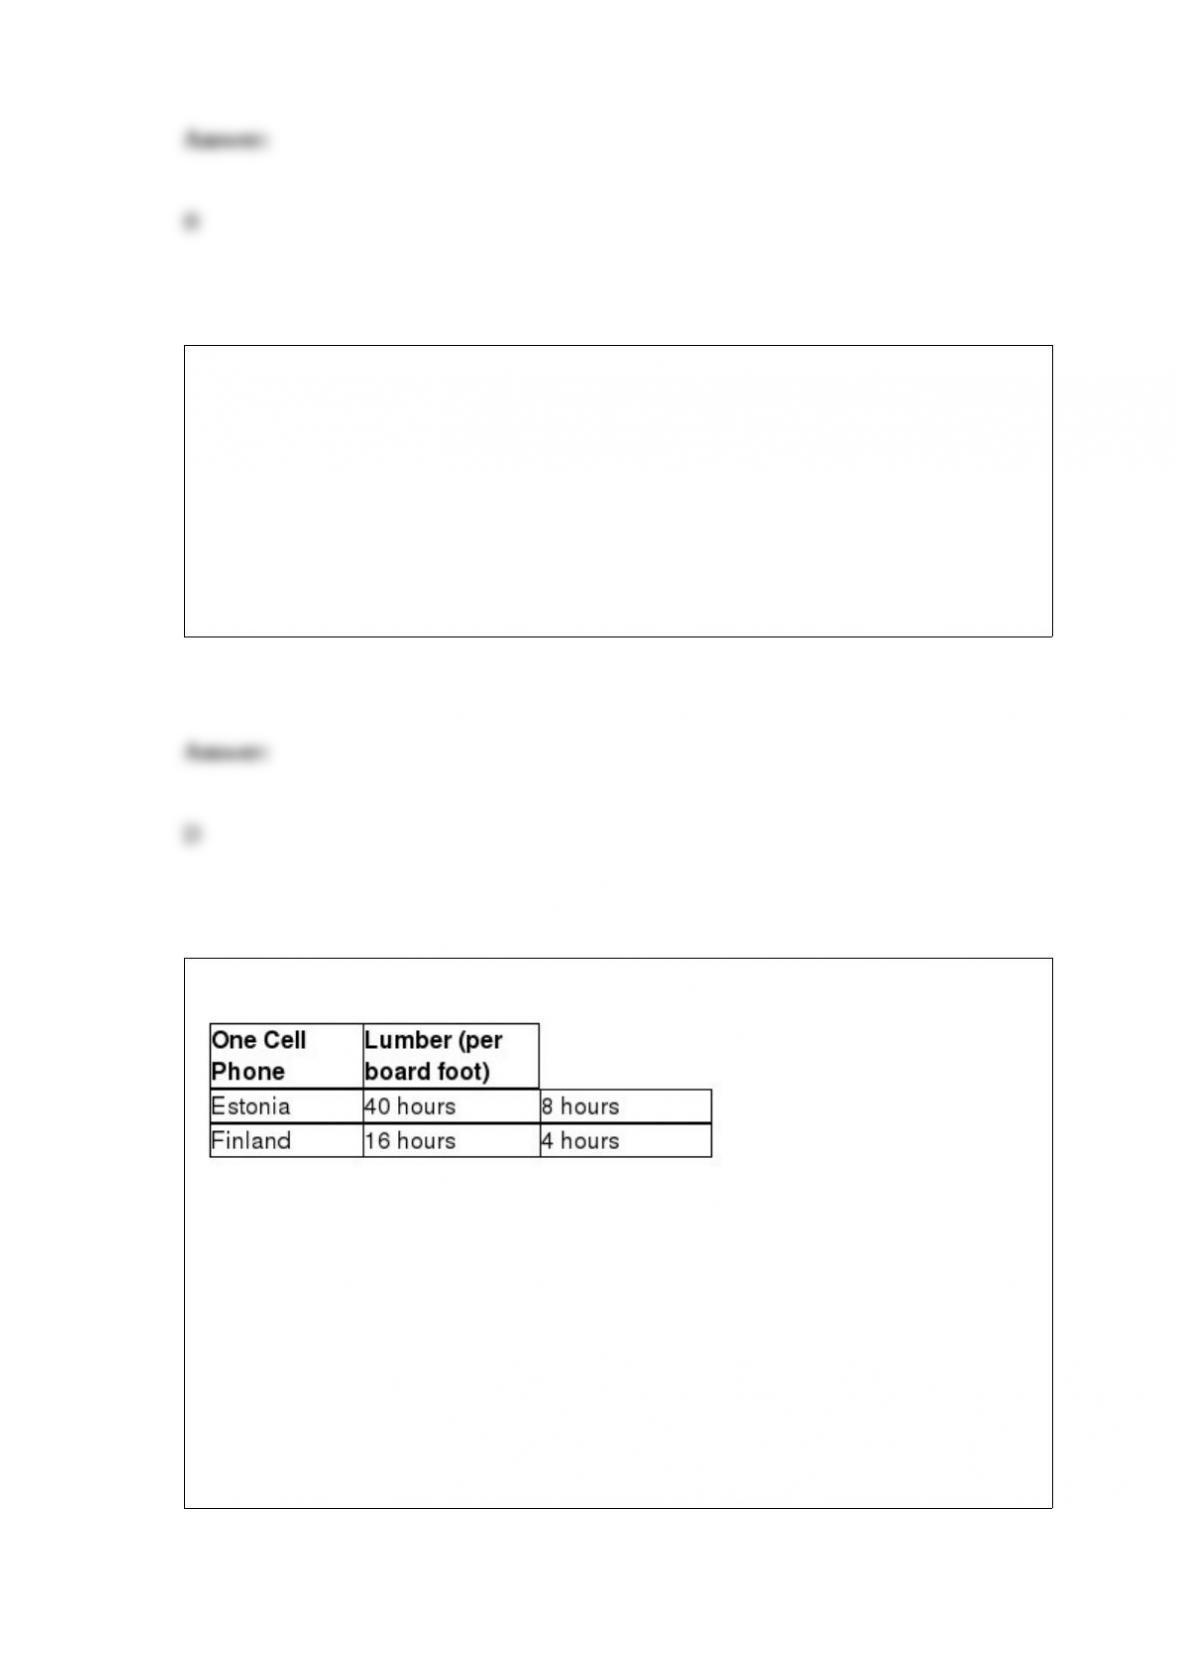
Table 2-16
Table 2-16 shows the number of labor hours required to produce a cell phone and a
board foot of lumber in Estonia and Finland. What is Estonia’s opportunity cost of
producing one cell phone?
A) 0.2 board feet of lumber
B) 5 board feet of lumber
C) 8 board feet of lumber
D) 32 board feet of lumber
What factors are most important for determining exchange rate fluctuations in the long
run?
A) relative price levels across countries
B) relative rates of productivity growth across countries
C) preferences for domestic and foreign goods across countries
D) All of the above are correct.
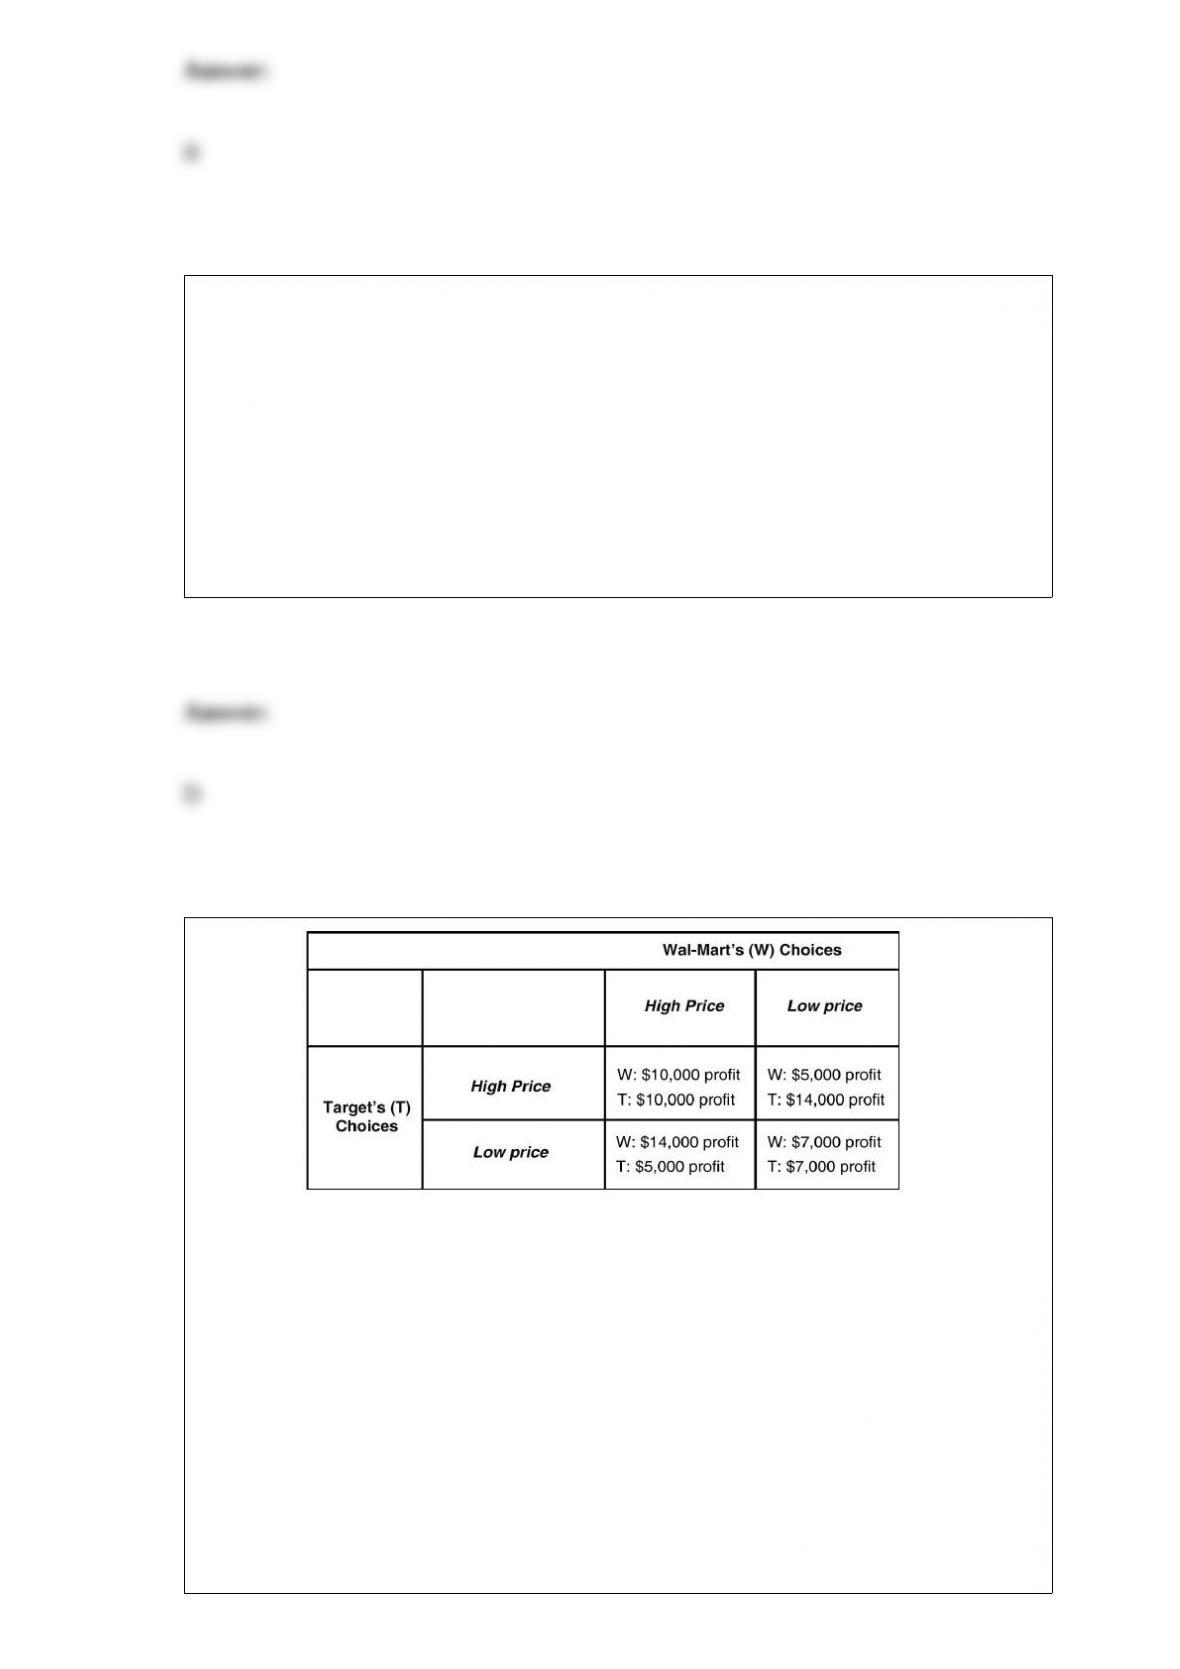
Table 14-2 Table 14-2
shows the payoff matrix for Wal-Mart and Target from every combination of pricing
strategies for the popular PlayStation 3. At the start of the game each firm charges a low
price and each earns a profit of $7,000.
Suppose pricing PlayStations is a repeated game in which Wal-Mart and Target will be
selling the game system in competition over a long period of time. In this case, what is
the most likely outcome?
A) a noncooperative equilibrium in which each firm charges the high price
B) a cooperative equilibrium in which each firm charges the high price
C) a noncooperative equilibrium in which each firm charges the low price

D) a cooperative equilibrium in which each firm charges the low price
Which of the following statements is false?
A) Marginal cost will equal average total cost when marginal cost is at its lowest point.
B) When marginal cost is less than average total cost, average total cost will fall.
C) When marginal cost is greater than average total cost, average total cost will rise.
D) Marginal cost will equal average total cost when average total cost is at its lowest
point.
A decrease in aggregate demand in the economy will have what effect on
macroeconomic equilibrium in the long run?
A) The price level will fall, and the level of GDP will be unaffected.
B) The price level will fall, and the level of GDP will fall.
C) The price level will rise, and the level of GDP will fall.
D) The price level will rise, and the level of GDP will be unaffected.

________ is called an implicit cost, while ________ is called an explicit cost.
A) An accounting cost; an economic cost
B) A nonmonetary opportunity cost; a cost that involves spending money
C) A production cost; a sales cost
D) An actual cost; a hypothetical cost
Most doctors and hospitals operate as private businesses in all of the following
countries except
A) Canada.
B) Japan.
C) the United Kingdom.
D) the United States.
Figure 16-6
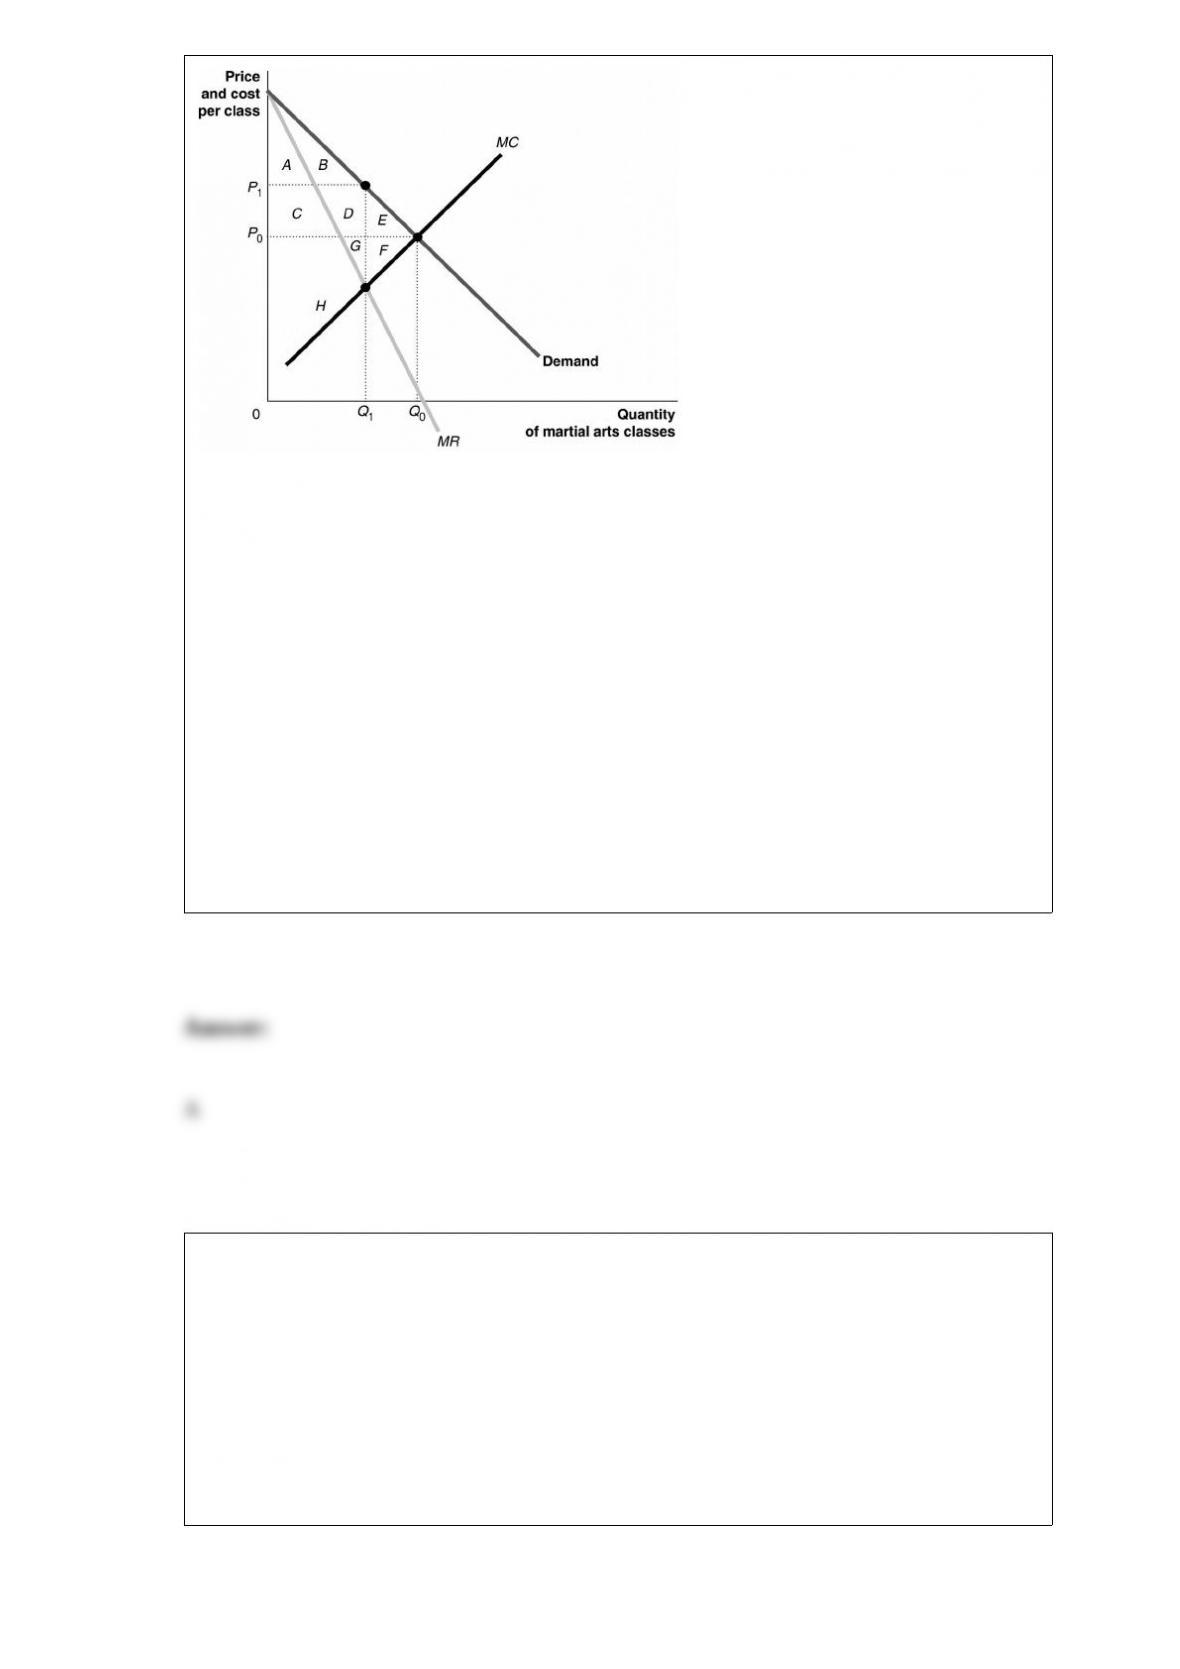
Watanabe Sensei operates the only
martial arts school in Hartfield. For simplicity, assume that consumers have identical
demand curves and that Sensei knows what this demand curve is. Figure 16-6 shows
this demand curve. Sensei’s friend, Marcel, suggests that he charge a one-time
membership fee to use the martial arts school, in addition to a per-class charge. Suppose
Sensei charges the monopoly price for each class and also imposes a one-time
membership fee. What is the maximum amount of revenue from the membership fee he
can collect from all his customers?
A) an amount equal to the area A + B
B) an amount equal to the area E + F
C) an amount equal to the area H + G
D) an amount equal to the area A + C + H
Stagflation occurs when
A) inflation rises and GDP rises.
B) inflation falls and GDP rises.
C) inflation rises and GDP falls.
D) inflation falls and GDP falls.
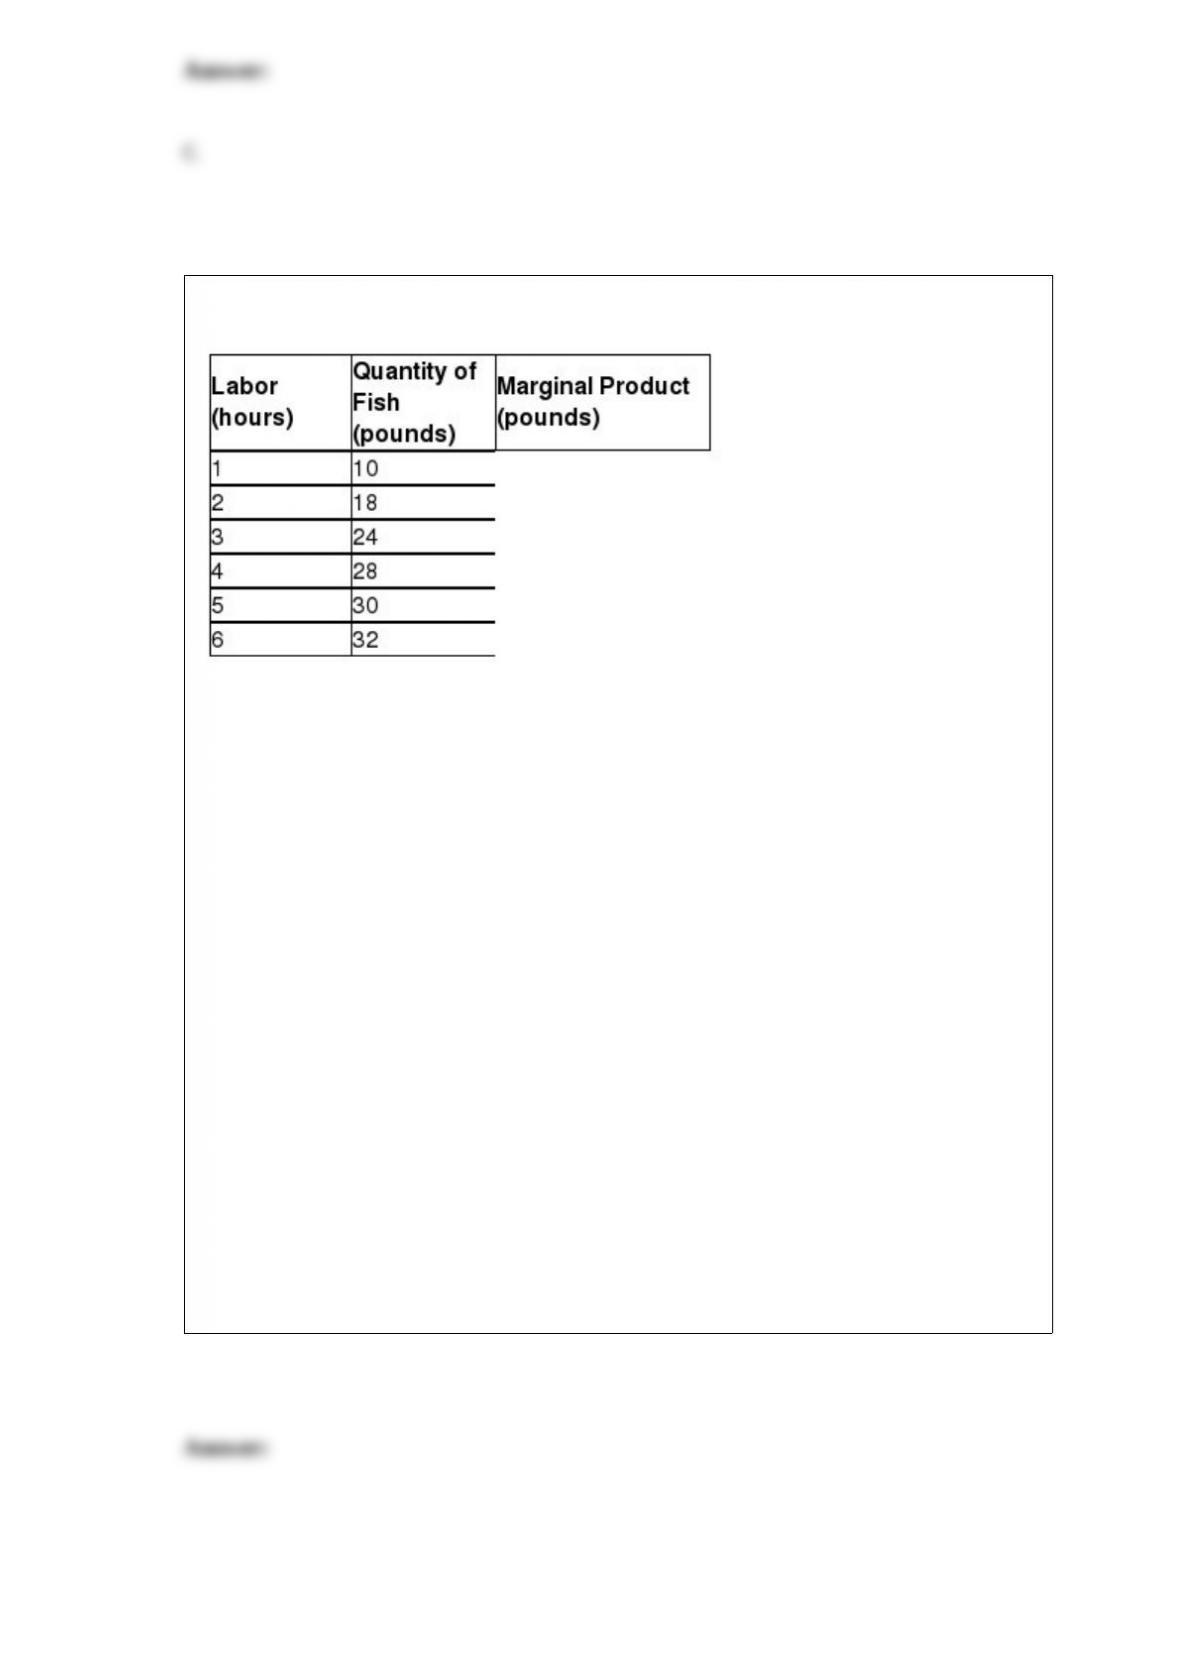
Table 11-4
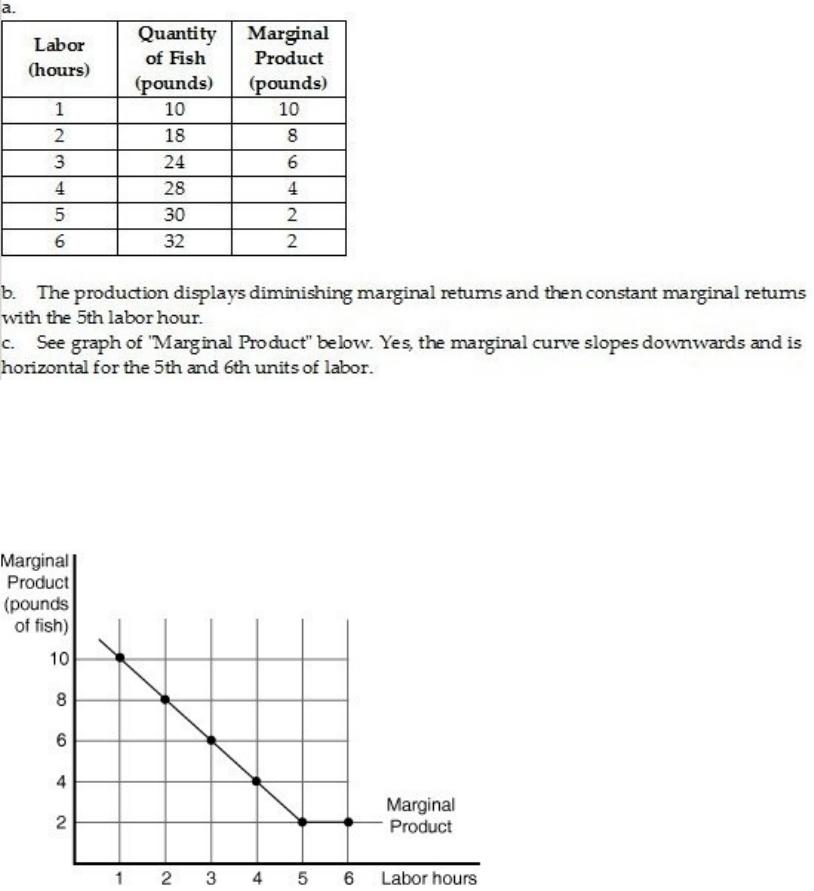
The table above shows the following relationship between hours spent fishing and the
quantity of fish caught for Juan, a commercial fisherman.
a. Complete the Marginal Product column in Table 11-4.
b. Characterize the production function, i.e. does the production function display
increasing marginal returns, diminishing marginal returns, etc.
c. Using the data above, graph Juan’s marginal product curve. Be sure to label the
horizontal and vertical axes. Is your graph consistent with your answer to part (b)?
Explain.
d. Juan uses the following inputs for fishing € a small wooden boat (B), a fishing pole
(P) and of course, his labor (L). Treating the boat and the fishing pole as fixed inputs
and using the data above, graph Juan’s Total Product of Labor curve. Be sure to label
the horizontal and vertical axes.
e. (Extra Credit) The opportunity cost of Juan’s time is $8 per hour. If Juan receives $2
per pound for his fish, what is the optimal number of hours he should spend fishing?
Explain how you arrived at your answer. Hint: Recall marginal benefit and marginal
cost analysis.
Scenario 8-1 CANOES-R-US makes canoes. It buys the shell of the canoe from
another firm for $300 and uses its labor and intermediate goods to make the canoe. It
sells the finished canoe to a retail canoe store for $800. The retail canoe store then sells
the canoe to a consumer for $1,200.
The value added of CANOES-R-US for each canoe equals
A) $1,200.
B) $800.
C) $500.
D) $400.
Price elasticity of demand measures
A) how responsive suppliers are to price changes.
B) how responsive sales are to changes in the price of a related good.
C) how responsive quantity demanded is to a change in price.
D) how responsive sales are to a change in buyers’ incomes.
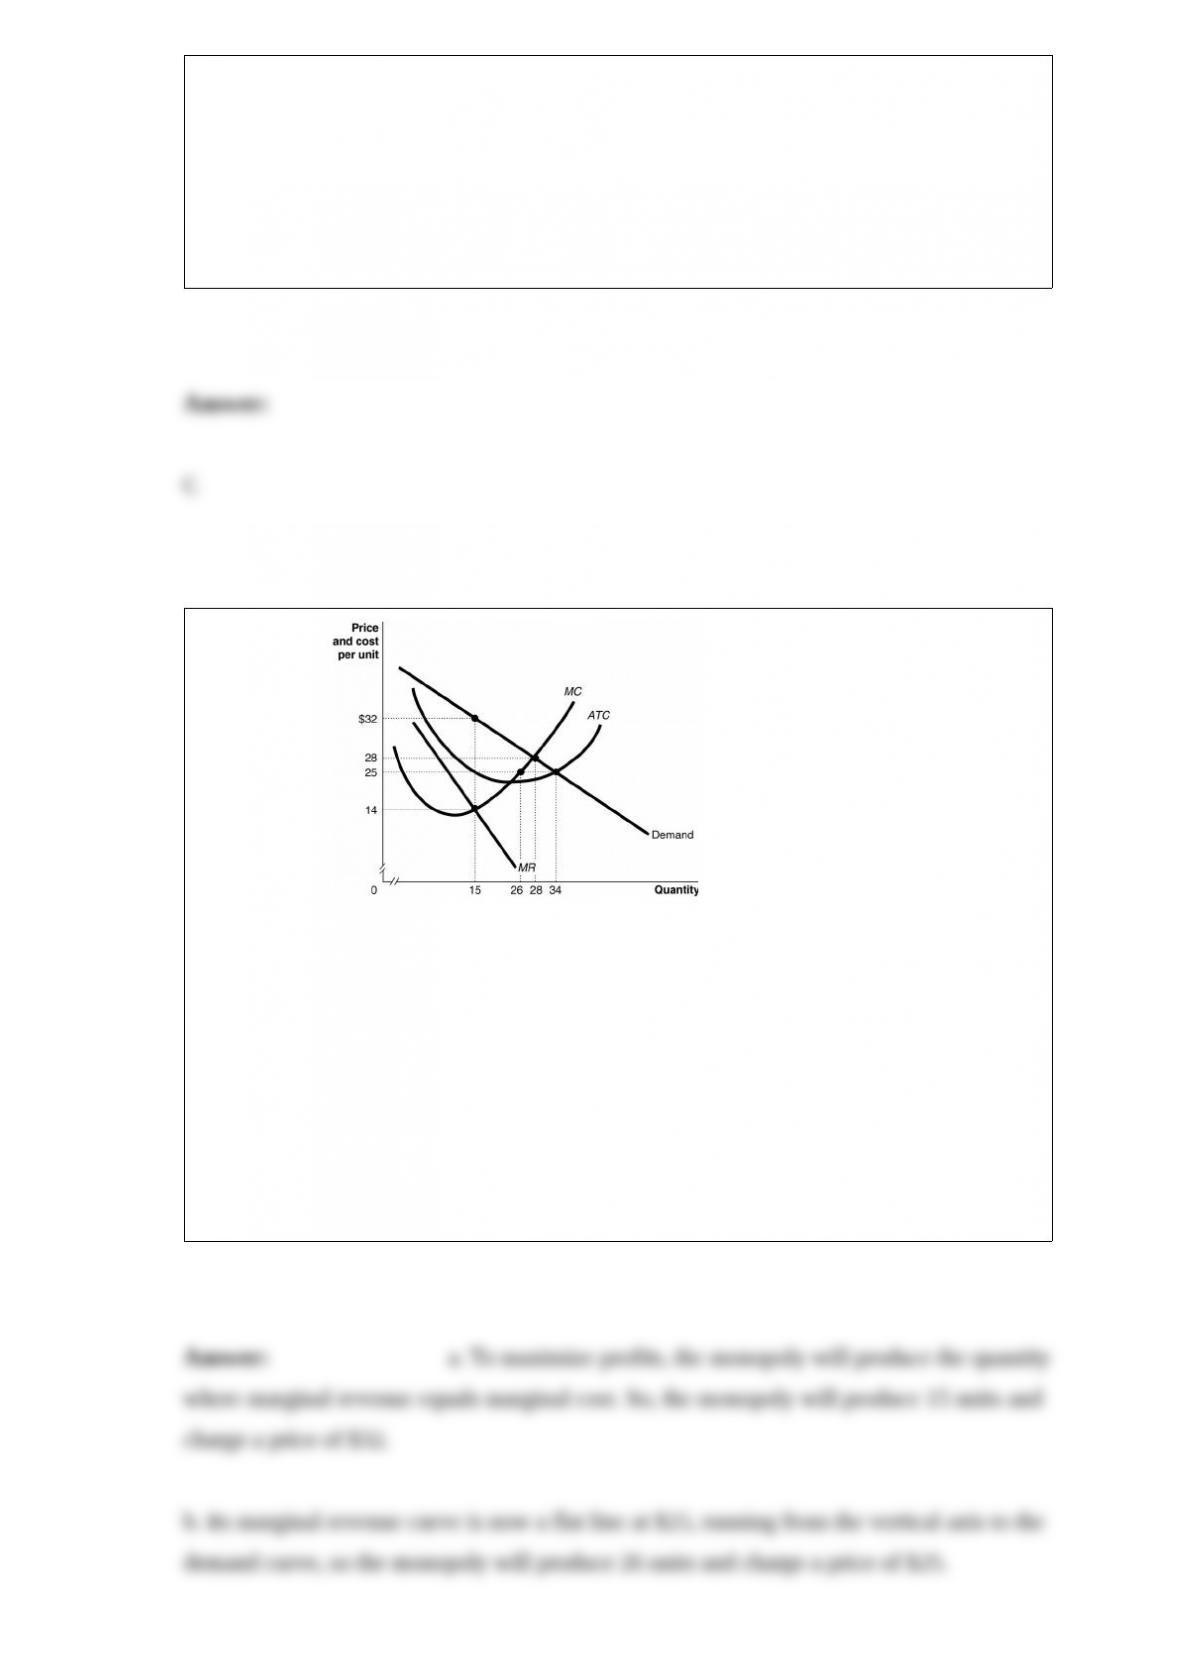
Figure 15-17
Answer the following questions.
a. What quantity will this monopoly produce and what price will it charge?
b. Suppose the government decides to regulate this monopoly and imposes a price
ceiling of $25. Now what quantity will the monopoly produce and what price will it
charge?
c. Will every consumer who is willing to pay the ceiling price of $25 be able to buy the
product? Briefly explain.