If over the next year the inflation rate in the euro area is higher than the inflation rate in
Japan, then the euro should depreciate relative to the Japanese yen.
a. True
b. False
In the United States in 2012, consumption represented approximately
a. 60 percent of GDP.
b. 70 percent of GDP.
c. 80 percent of GDP.
d. 90 percent of GDP.
Suppose the interest rate is 7 percent. Consider four payment options: Option A: $500
today.
Option B: $550 one year from today. Option C: $575 two years from today. Option D:
$600 three years from today. Which of the payments has the highestpresent value
today?
a. Option A
b. Option B

c. Option C
d. Option D
Which of the following statements generates the greatest amount of disagreement
among economists?
a. Increases in the money supply shift aggregate demand to the right.
b. In the long run, increases in the money supply increase prices, but not output.
c. Recessions are associated with decreases in consumption, investment, and
employment.
d. Government should use fiscal policy to try to stabilize the economy.
In the United States, nominal interest rates were
a. high in the 1970s and 1990s.
b. low in the 1970s and 1990s.
c. high in the 1970s and low in the 1990s.
d. low in the 1970s and high in the 1990s.
The demand for labor by a certain firm fluctuates as the demand for that firm’s product
fluctuates.
a. True
b. False
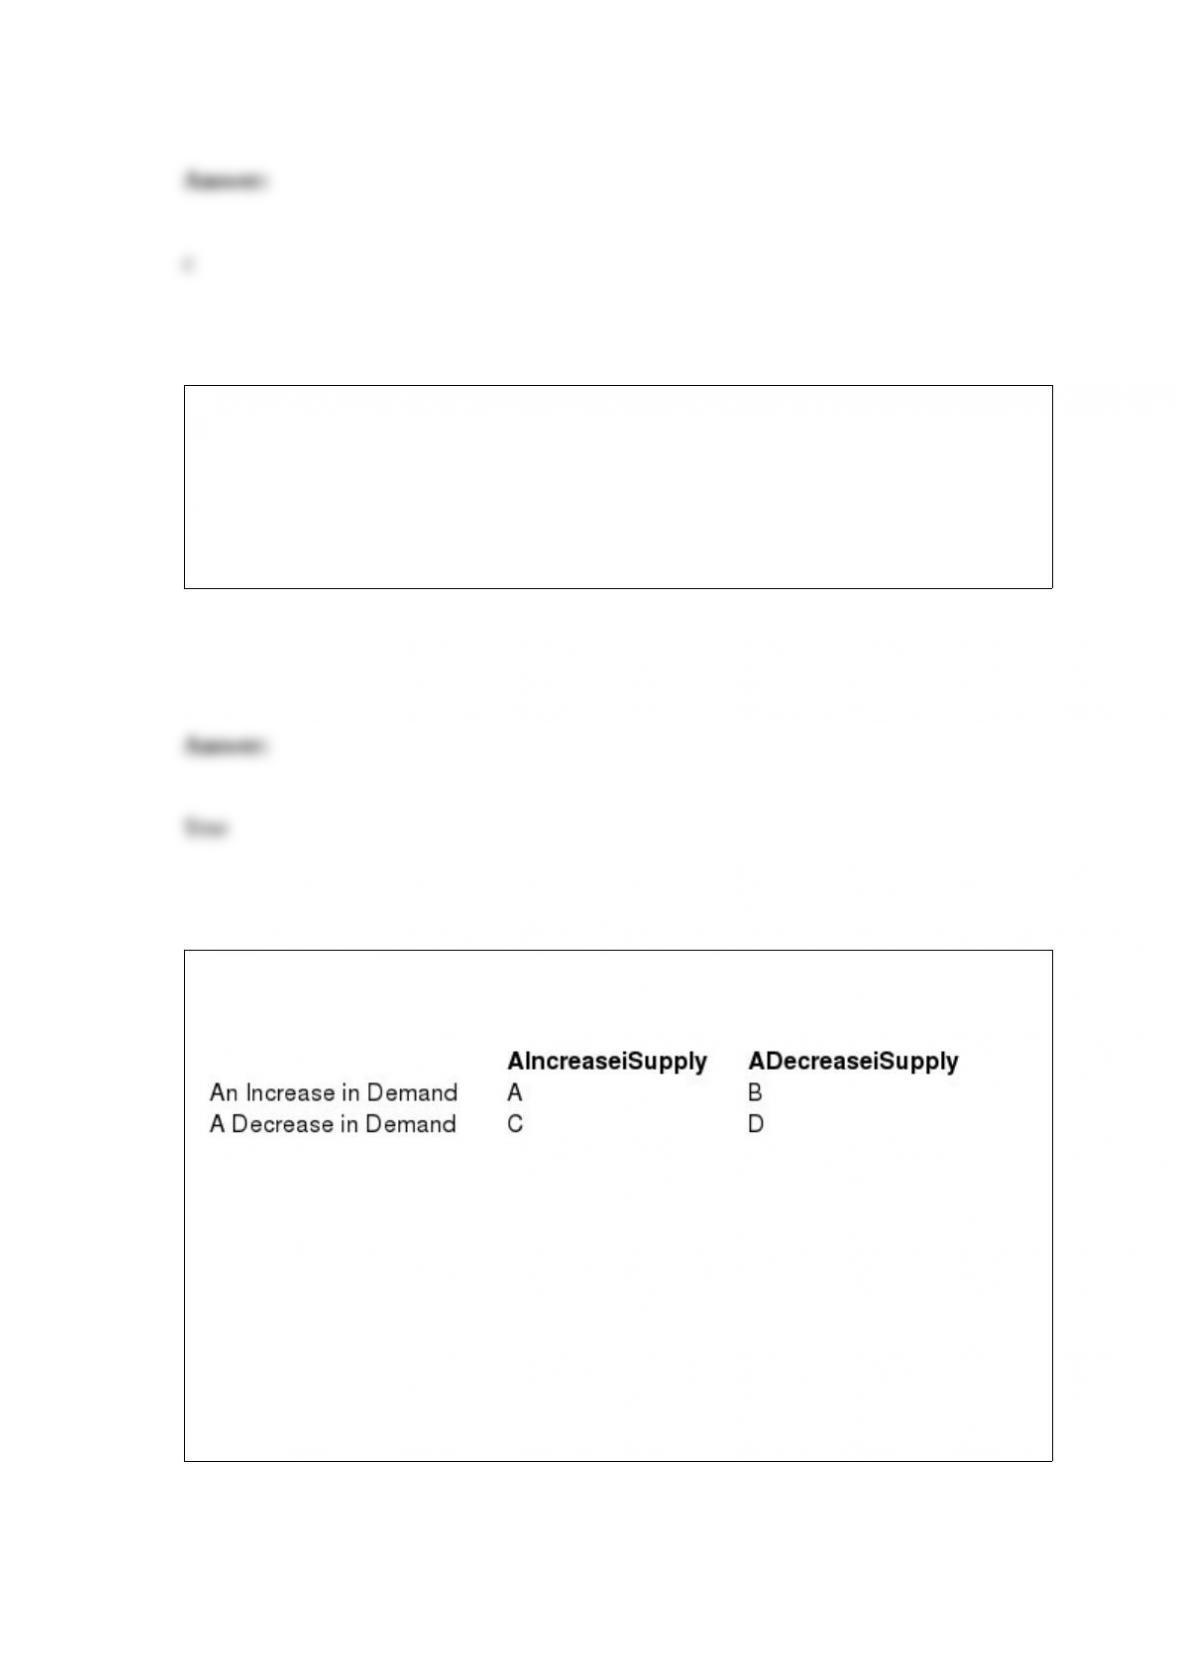
Table 4-9
RefertoTable4-9.Which combination would produce a decrease in equilibrium quantity
and an indeterminate change in equilibrium price?
a. A
b. B
c. C
d. D

Scenario 24-1
The price tag on a tennis ball in 1975 read $0.10, and the price tag on a tennis ball in
2005 read $1.00. The CPI in 1975 was 52.3, and the CPI in 2005 was 191.3.
RefertoScenario24-1.In 1975 dollars, a 1975 tennis ball cost $0.10 and a 2005 tennis
ball cost
a. $0.27, so tennis balls were cheaper in 1975.
b. $0.27, so tennis balls were cheaper in 2005.
c. $3.66, so tennis balls were cheaper in 1975.
d. $3.66, so tennis balls were cheaper in 2005.
Which of the following is a way to compute GDP?
a. total income earned.
b. total expenditures on final goods.
c. add up the market values of all final goods and services.
d. All of the above are correct.
Figure27-5. The figure shows a utility function for Dexter.
RefertoFigure27-5. In what way(s) does the graph differ from the usual case?
a. The utility function shown here is upward-sloping, whereas in the usual case the
utility function is downward- sloping.
b. The utility function shown here is bowed downward (convex), whereas in the usual
case the utility function is bowed upward (concave).
c. On the graph shown here, wealth is measured along the horizontal axis, whereas in
the usual case saving is measured along the horizontal axis.
d. On the graph shown here, utility is measured along the vertical axis, whereas in the
usual case satisfaction is measured along the vertical axis.
A firm has three different investment options, each costing $10 million. Option A will
generate $12 million in revenue at the end of one year. Option B will generate $15
million in revenue at the end of two years. Option C will generate $18 million in
revenue at the end of three years. Which option should the firm choose?
a. Option A
b. Option B
c. Option C
d. The answer depends on the rate of interest, which is not specified here.
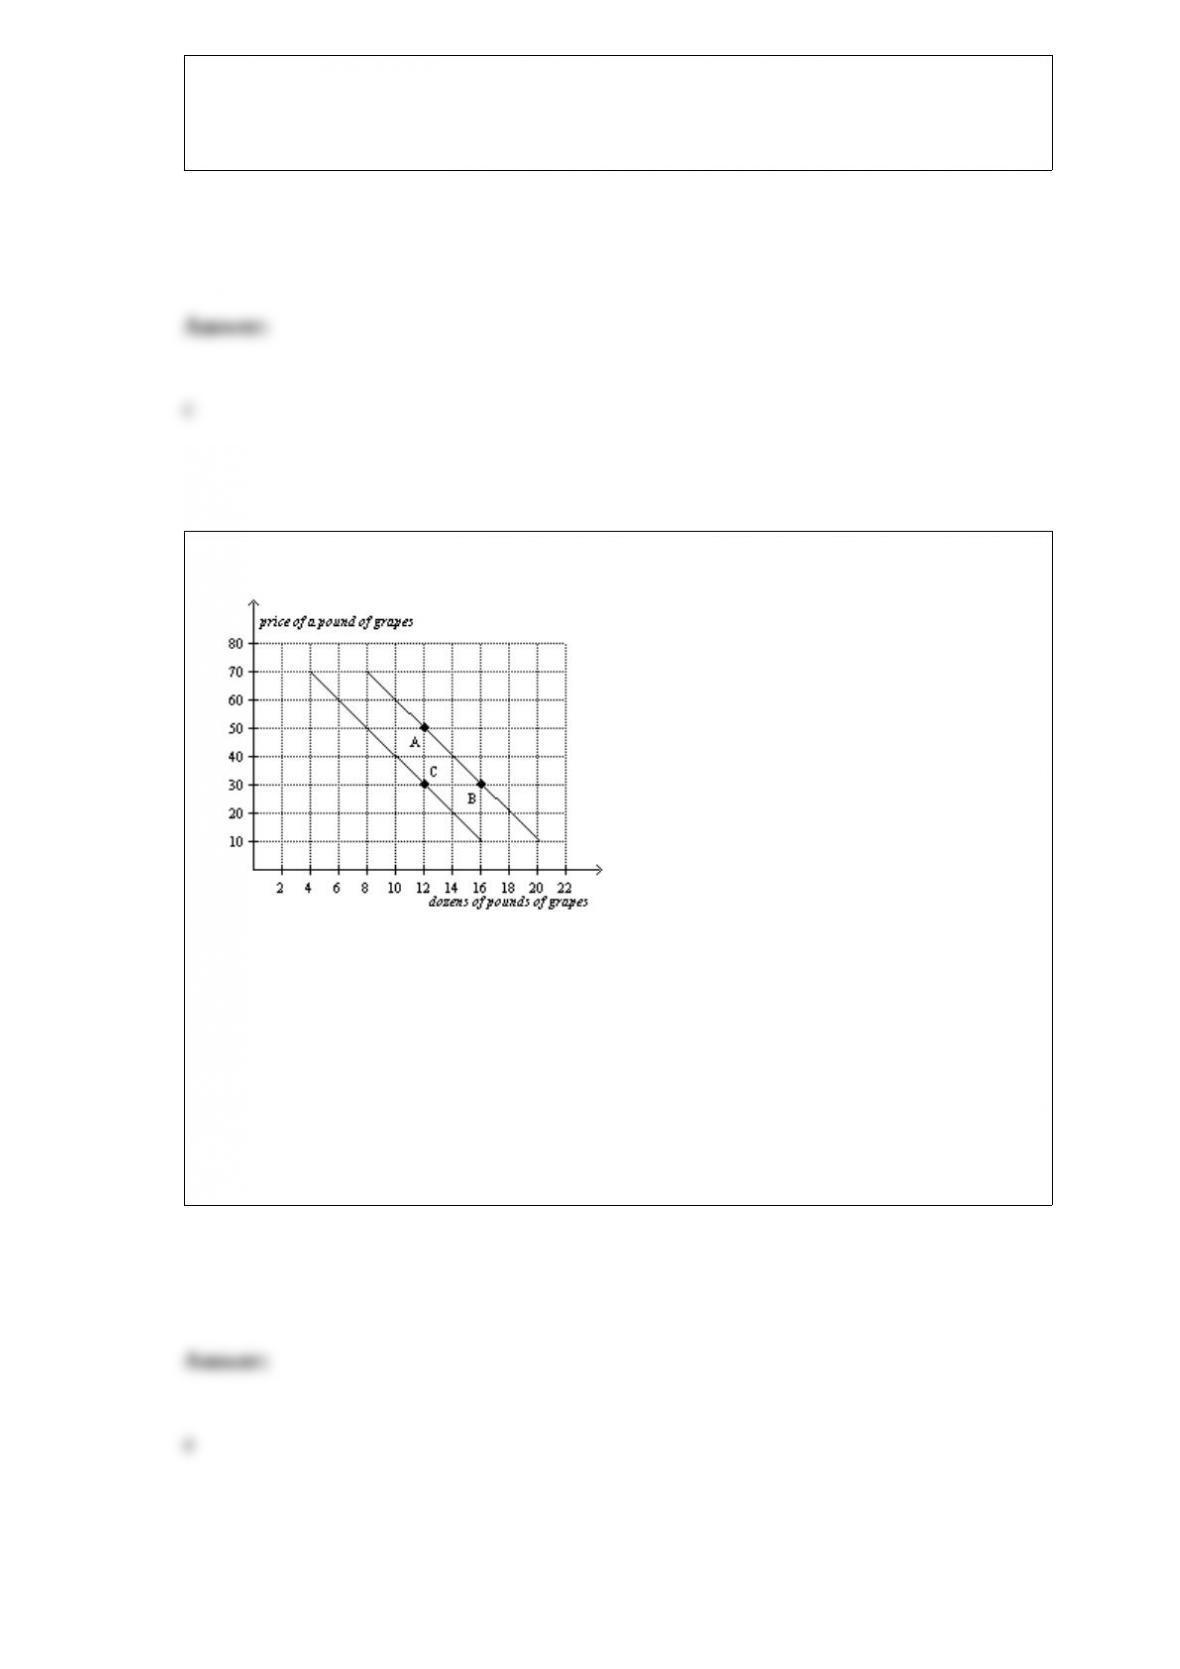
Figure 3-15
Refer to Figure3-15. Suppose Perry is willing to trade 4 poems to Jordan for each
novel that Jordan writes and sends to Perry. Which of the following combinations of
novels and poems could Jordan then consume, assuming Jordan specializes in novel
production and Perry specializes in poem production?
a. 1 novel and 14 poems
b. 2 novels and 8 poems
c. 3 novels and 6 poems
d. 4 novels and 2 poems
In determining living standards, productivity plays a key role
a. for individuals, but not for nations.
b. for nations, but not for individuals.
c. for both nations and individuals.
d. for neither nations nor individuals.

When the price level falls, the number of dollars needed to buy a representative basket
of goods
a. increases, so the value of money rises.
b. increases, so the value of money falls.
c. decreases, so the value of money rises.
d. decreases, so the value of money falls.
Cole is refinishing an antique china cabinet and has already spent $180 on the
restoration. He expects to be able to sell the cabinet for $360. Cole discovers that he
needs to do an additional $200 worth of work to make the cabinet worth $360 to
potential buyers. He could also sell the cabinet now, without completing the additional
work, for $100. What should Cole do?
a. He should sell the cabinet now for $100.
b. He should keep the cabinet since it wouldn”t be rational to spend $380 restoring a
cabinet and then sell it for only $360.
c. He should complete the additional work and sell the cabinet for $360.
d. It does not matter which action he takes since the outcome will be the same either
way.

A judge requires Harry to make a payment to Sally. The judge says that Harry can pay
her either $10,000 today or $11,000 two years from today. Of the following interest
rates, which is the lowestone at which Harry would be better off paying $11,000 two
years from today?
a. 2 percent
b. 3 percent
c. 4 percent
d. 5 percent
In a fractional-reserve banking system, a decrease in reserve requirements
a. increases both the money multiplier and the money supply.
b. decreases both the money multiplier and the money supply.
c. increases the money multiplier, but decreases the money supply.
d. decreases the money multiplier, but increases the money supply.

An increase in capital will increase real GDP per person
a. more in a poor country than a rich country. The increase in real GDP per person will
be larger if the addition to capital is from domestic rather than foreign investment.
b. more in a poor country than a rich country. The increase in real GDP per person will
be the same whether the addition to capital is from domestic or foreign investment.
c. less in a poor country than a rich country. The increase in real GDP per person will be
larger if the addition to capital is from domestic rather than foreign investment.
d. less in a poor country than a rich country. The increase in real GDP per person will
be the same whether the addition to capital is from domestic or foreign investment.
If something happens to alter the quantity supplied at any given price, then
a. we move along the supply curve.
b. the supply curve shifts.
c. the supply curve becomes steeper.
d. the supply curve becomes flatter.
The inflation rate is calculated
a. by determining the change in the price index from the preceding period.
b. by adding up the price increases of all goods and services.
c. by computing a simple average of the price increases for all goods and services.
d. by determining the percentage increase in the price index from the preceding period.
Consider the following rule for monetary policy: r = 2 percent + π + 1/2(y – y*)/y* +
1/2(π – π*), where is the nominal federal funds rate, yis real GDP, y* is an estimate of
the natural rate of output, π is the inflation rate, and π* is the inflation target. Other
things the same, if the inflation rate rises by 1 percentage point this rule says the Fed
should increase the nominal federal funds rate by
a. 1/2 percentage point
b. 1 percentage point
c. 1 and 1/2 percentage points
d. 3 and 1/2 percentage points
Which of the following best illustrates the concept of a store of value?
a. You are a precious-metals dealer, and you are always aware of how many ounces of
platinum trade for an ounce of gold.
b. You sell items on eBay, and your prices are stated in terms of dollars.
c. You keep 6 ounces of gold in your safe-deposit box at the bank for emergencies.
d. None of the above is correct.
Figure 2-17
RefertoFigure2-17. The slope of the curve between points A and B is
a. -5
b. -1/5
c. 1/5
d. 5
Friedman and Phelps believed that the natural rate of unemployment was constant.
a. True
b. False
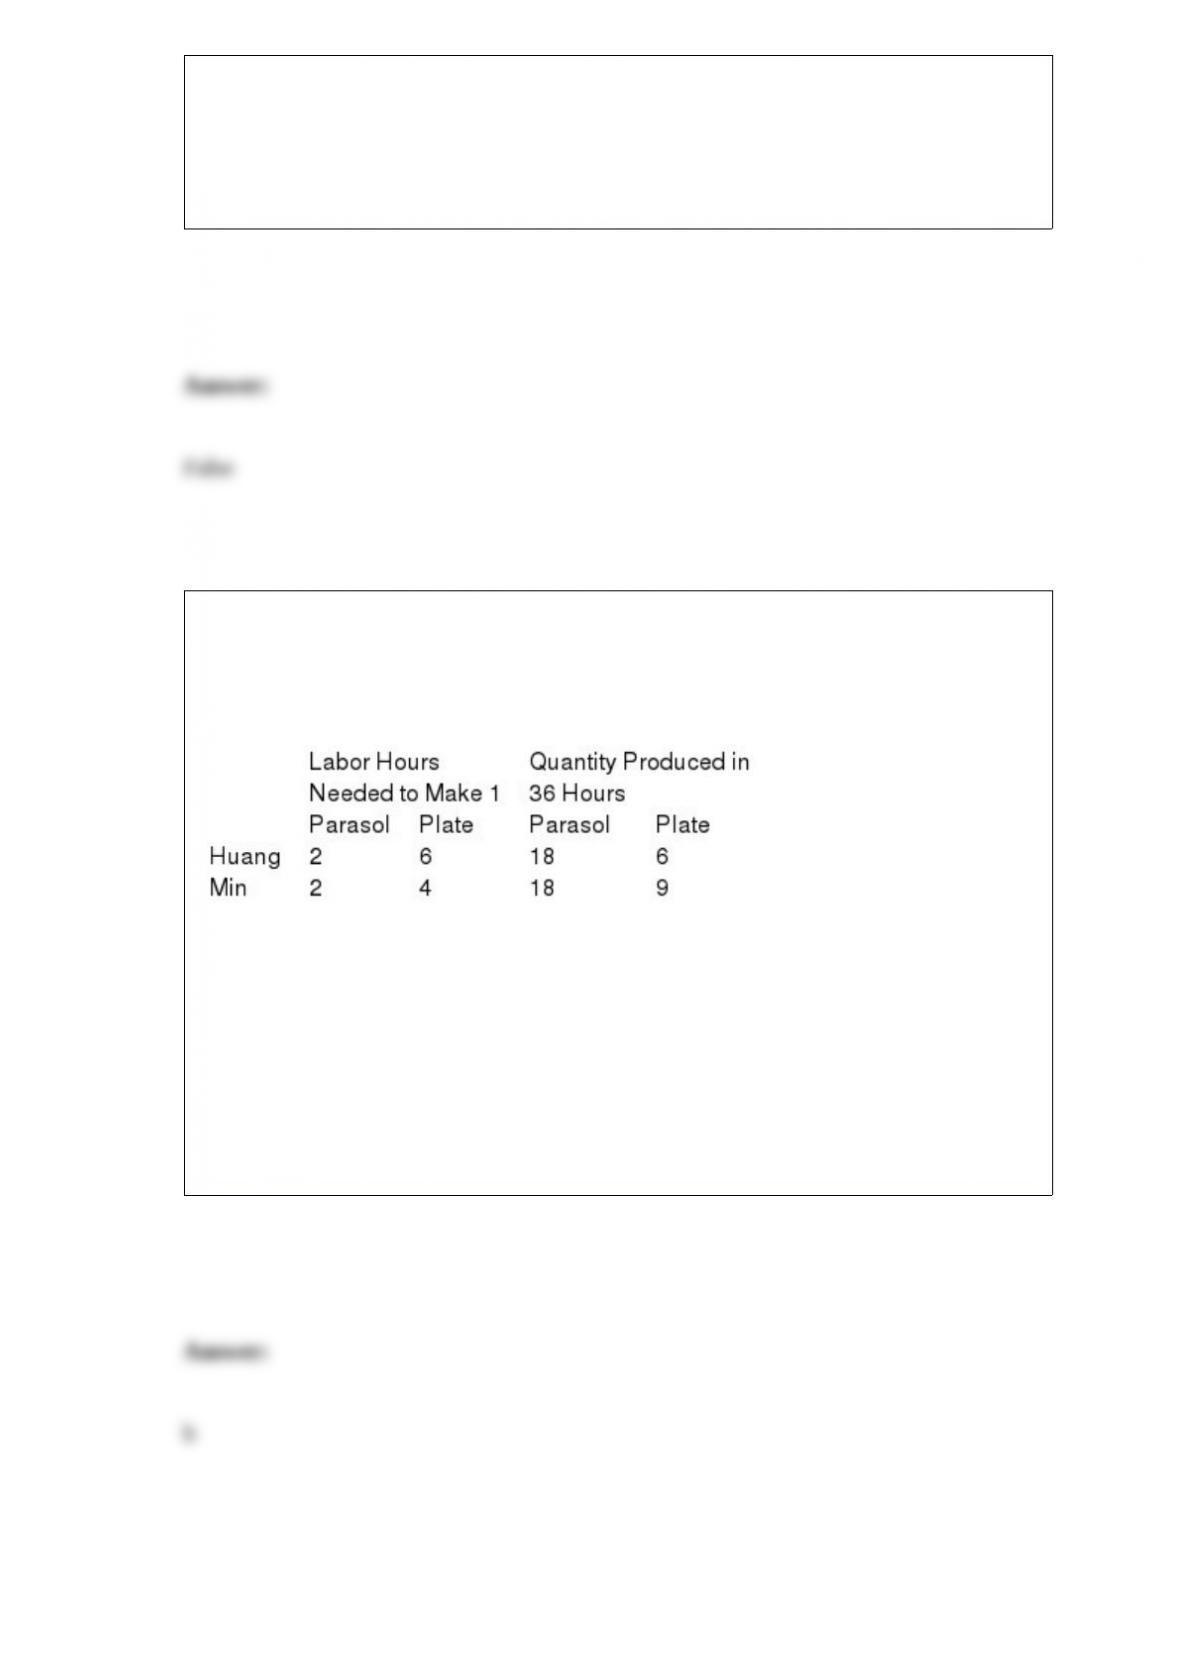
Table 3-27
Assume that Huang and Min can switch between producing parasols and producing
porcelain plates at a constant rate.
RefertoTable3-27. The opportunity cost of 1 parasol for Min is
a. 1/3 plate.
b. 1/2 plate.
c. 2 plates.
d. 3 plates.

Suppose you win the lottery and one of your payment options is to receive $20,000
today, $20,000 one year from now, and $20,000 two years from now. If the interest rate
is 5%, what is the present value of this option?
a. $51,830.26
b. $54,464.96
c. $57,188.21
d. $58,237.71
Which of the following accounts for about two-thirds of the decline in output during a
recession?
a. the decline in government purchases.
b. the decline in total consumption spending.
c. the decline in investment spending.
d. the decline in net exports.
In the open-economy macroeconomic model, the supply of dollars in the market for
foreign-currency exchange is upward sloping.
a. True
b. False
In the small closed economy of San Lorena, the currency is the denar. Statistics for last
year show that private saving was 60 billion denars, taxes were 80 billion denars,
government purchases of goods and services were 70 billion denars, there were no
transfer payments by the government, and GDP was 400 billion denars. What were
consumption and investment in San Lorena?
a. 270 billion denars, 50 billion denars
b. 250 billion denars, 60 billion denars
c. 260 billion denars, 70 billion denars
d. None of the above is correct.
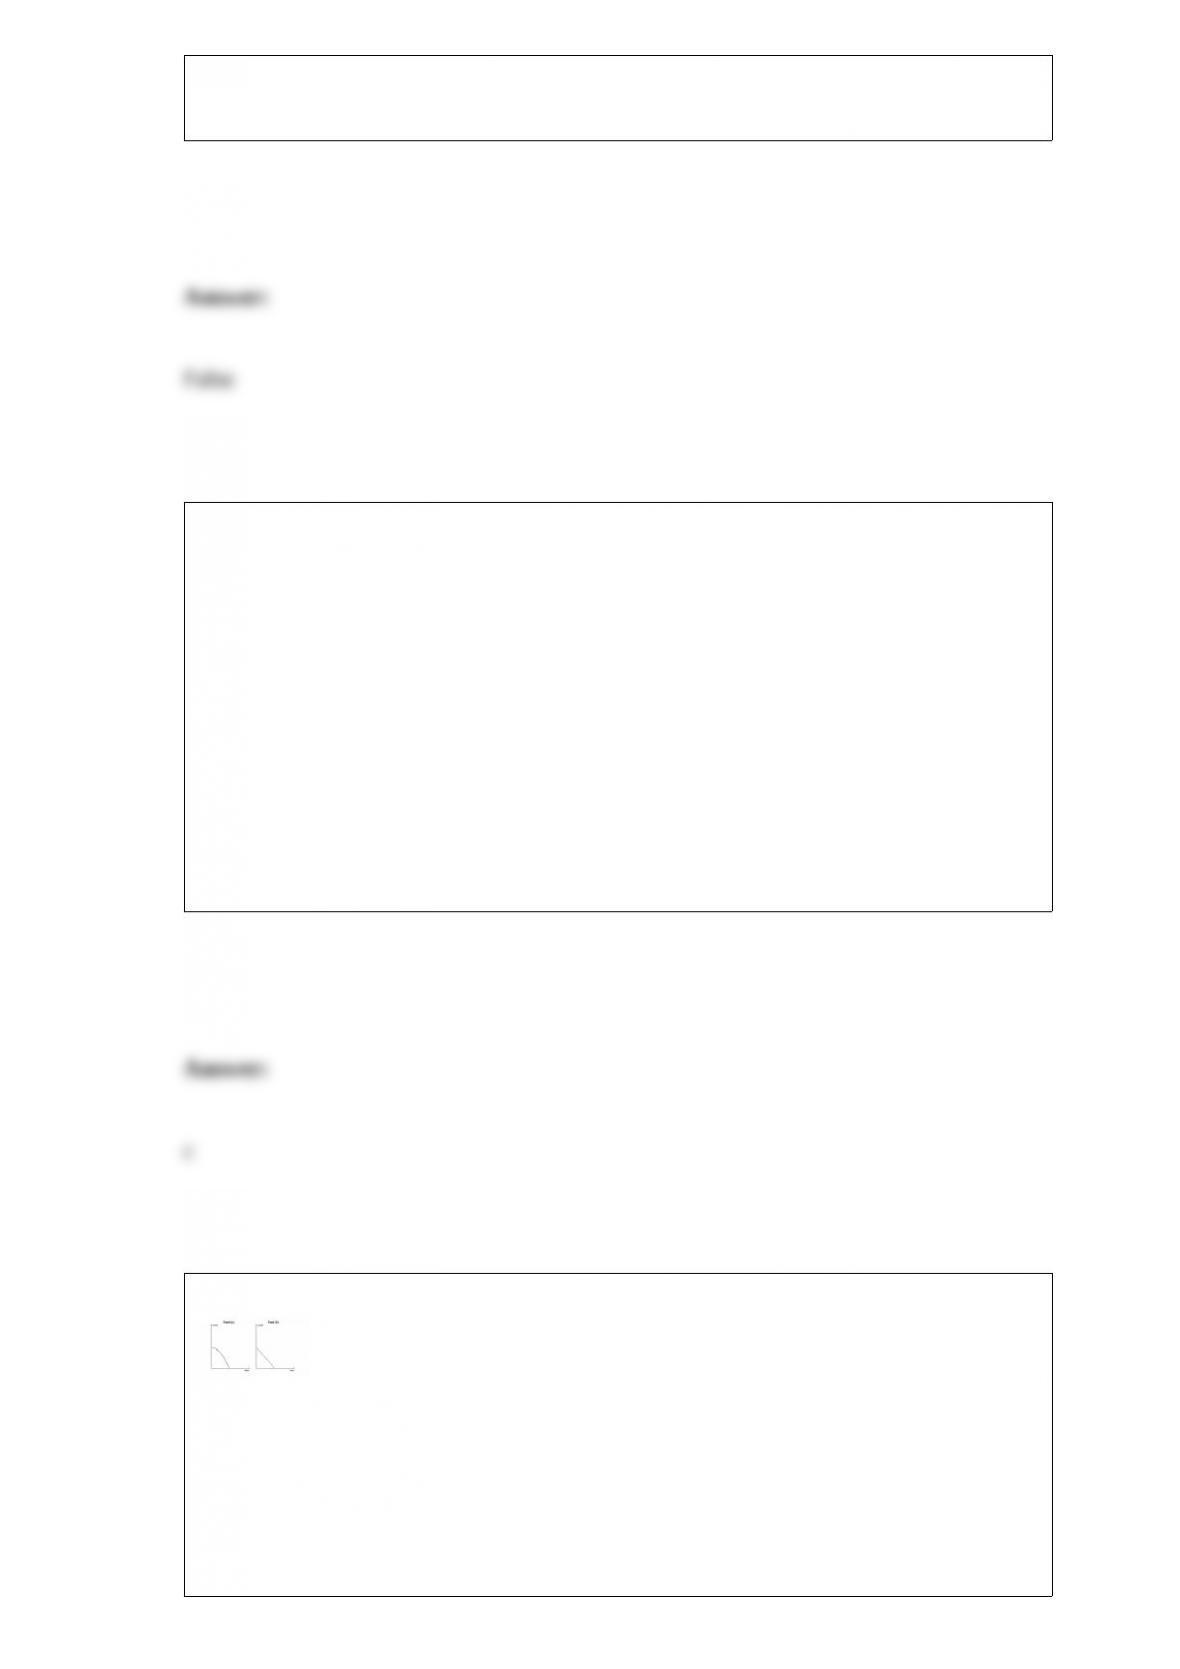
Figure 3-1
Refer to Figure3-1. The rate of tradeoff between producing chairs and producing
couches depends on how many chairs and couches are being produced in
a. Panel (a).
b. Panel (b).
c. both Panel (a) and Panel (b).
d. neither Panel (a) nor Panel (b).
Proponents of a balanced government budget acknowledge that running a budget deficit
is justifiable in time of war.
a. True
b. False
Public policy can reduce the economy’s natural rate of unemployment.
a. True
b. False
Table 3-9
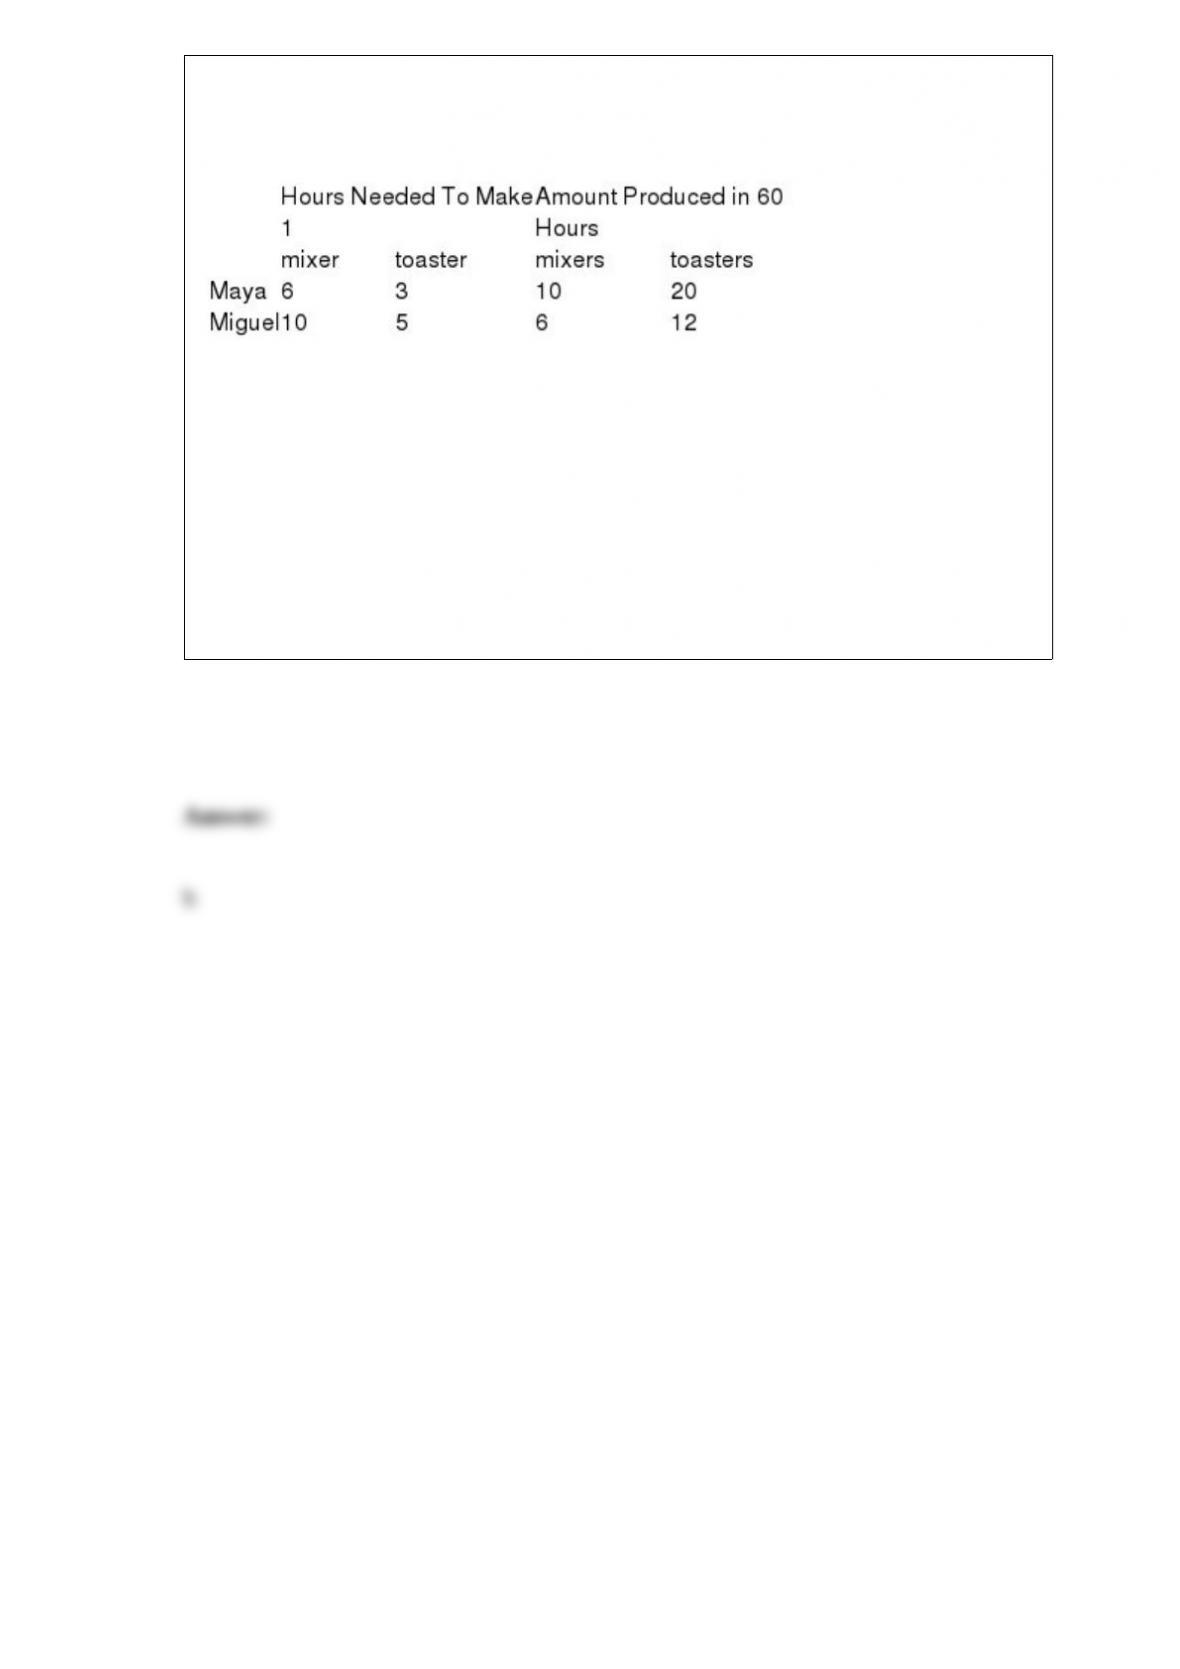
Assume that Maya and Miguel can switch between producing mixers and producing
toasters at a constant rate.
Refer to Table3-9. Which of the following combinations of mixers and toasters could
Maya produce in 60 hours?
a. 5 mixers and 12 toasters.
b. 6 mixers and 4 toasters.
c. 7 mixers and 7 toasters.
d. 8 mixers and 5 toasters.