
Figure 3-8
The graph in this figure illustrates an initial competitive equilibrium in the market for
sugar at the intersection of D1 and S2 (point B). If there is an decrease in the price of
fertilizer used on sugar cane and there is a decrease in tastes for sugar-sweetened soft
drinks, how will the equilibrium point change?
A) The equilibrium point will move from B to A.
B) The equilibrium point will move from B to C.
C) There will be no change in the equilibrium point.
D) The equilibrium point will move from B to E.
Which of the following is an example of an efficiency-equity trade-off faced by
economic agents?
A) According to an article by in the American Journal of Public Health by Edward
Kaplan and Michael Merson of Yale University School of Medicine, the federal
government’s current method of allocating HIV-prevention resources is not
cost-effective. Instead of allocating resources to states in proportion to reported AIDS
cases, resources should flow first to those activities that prevent more infections per
dollar and then to less and less effective combinations of programs and populations
until funds are exhausted, even if it means that some populations would be left without
any prevention services.
B) Concerned about the falling birth rate, the French government has pledged more

money for families with three children, in an effort to encourage working women to
have more babies.
C) Some U.S. colleges are actively recruiting foreign students for their
technology-based programs.
D) All New York City art museums are considering adopting a free-admission policy
for local residents one weekend per month.
A firm will break even when
A) P = ATC.
B) P > ATC.
C) P < AVC.
D) P = AVC.
Pakistan has developed a comparative advantage in the production of clothing. The
source of its comparative advantage in these products is
A) a favorable climate.
B) technology.
C) abundant supplies of natural resources.
D) a large supply of unskilled workers.

Assume the market for organically-grown produce is perfectly competitive. All else
equal, as farmers find it less profitable to produce and sell organic produce in this
market
A) the demand curve will shift to the left and the equilibrium price will decrease.
B) the supply curve will shift to the left and the equilibrium price will increase.
C) the supply curve will shift to the right, the demand curve will shift to the left, and the
equilibrium price will decrease.
D) the supply curve will shift to the left, the demand curve will shift to the left, and the
equilibrium price will increase.
Most economic growth in the world occurred between 1,000,000 B.C. and 1300 A.D.
Which of the following is used to explain why a consumer’s willingness to buy
Microsoft Office increases as the number of other people who use Microsoft Office
increases?
A) network externalities
B) market failure
C) diminishing marginal utility
D) the income effect of a price change
In an open economy, expansionary monetary policy will cause
A) consumption, investment, and net exports to rise.
B) consumption and investment to rise, but net exports will fall.
C) consumption to rise, but investment and net exports will fall.
D) consumption to fall, but investment and net exports will rise.
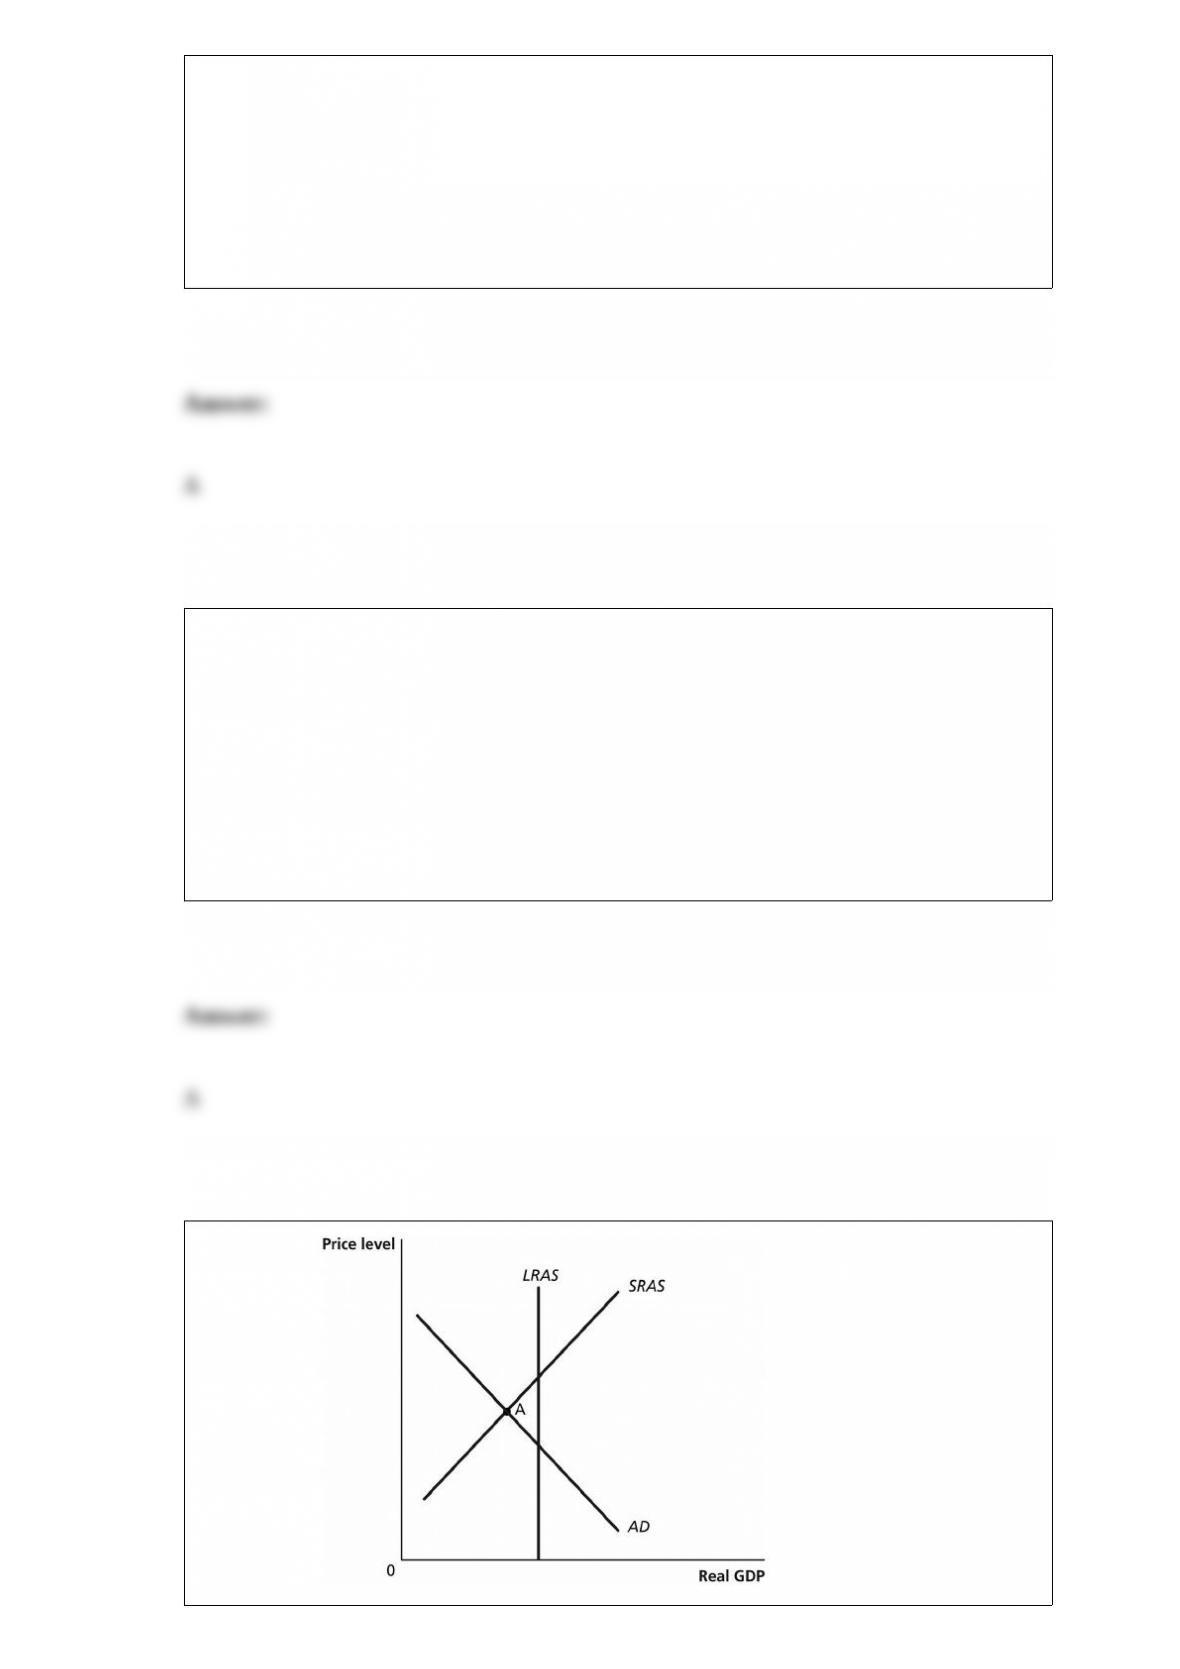
Figure 16-2
In the graph above, if the economy is at point A, an appropriate fiscal policy by the
Congress and the president would be to
A) lower the discount rate of interest.
B) execute an open market sale of government securities.
C) increase government transfer payments.
D) increase marginal income tax rates.
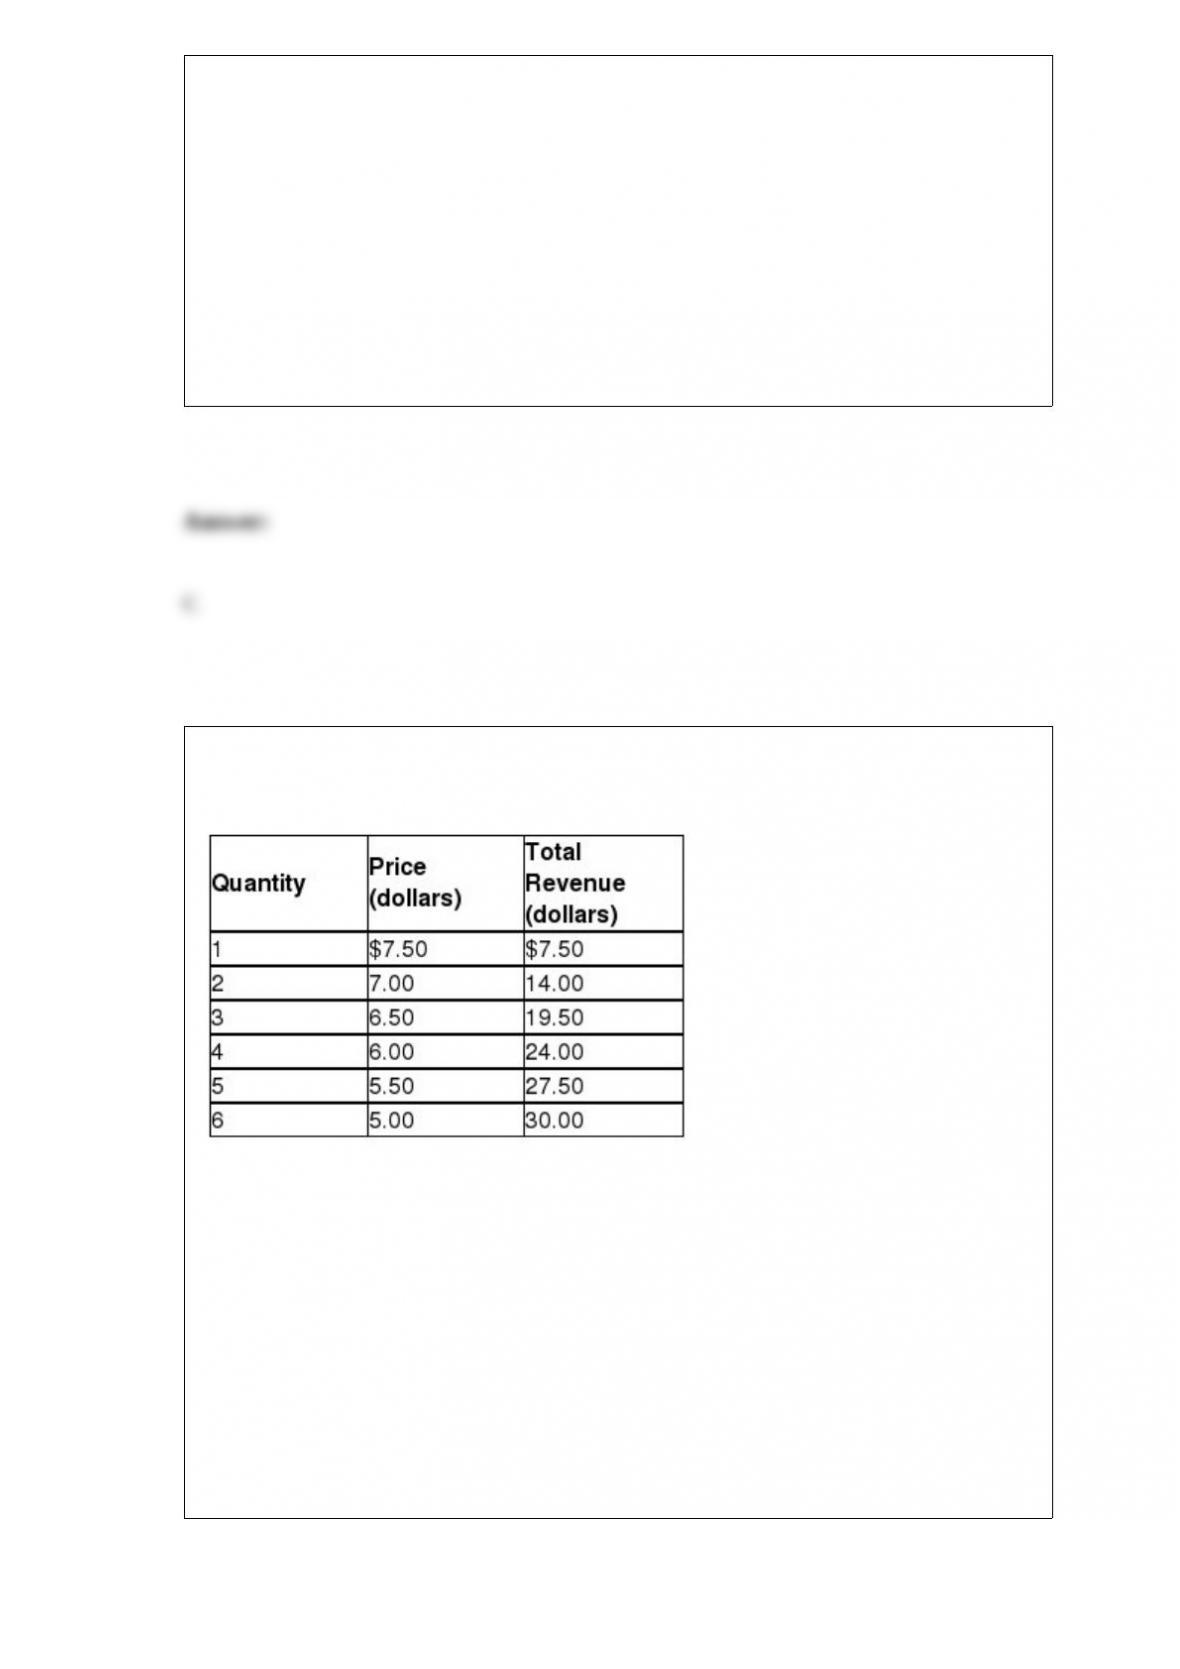
Table 13-1
The Table shows
A) an elastic segment of the demand curve.
B) an inelastic segment of the demand curve.
C) a demand curve with an elastic segment of the demand curve from $7.50 to $6.50
followed by an inelastic segment.
D) a demand curve with an inelastic segment of the demand curve from $7.50 to $6.50
followed by an elastic segment.
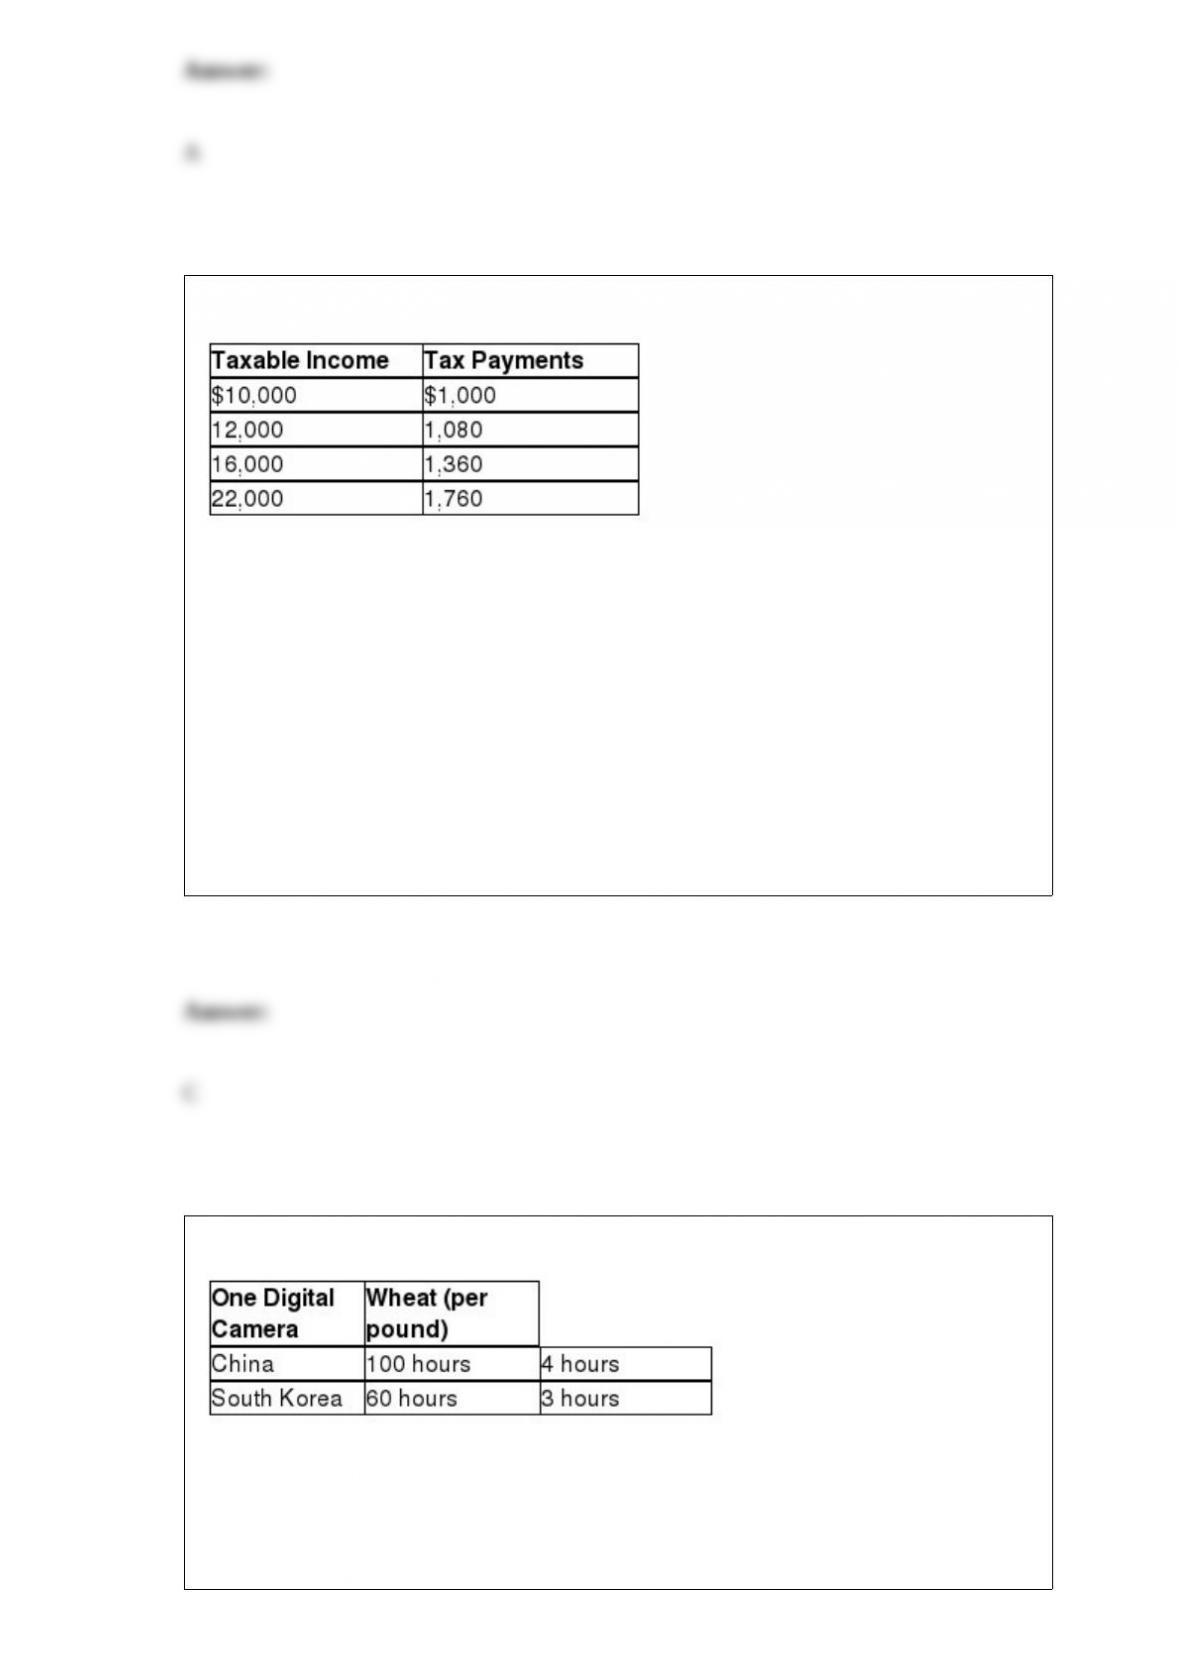
Table 18-8
Table 18-8 shows the amount of taxes paid on various levels of income.
The tax system is
A) progressive throughout all levels of income.
B) proportional throughout all levels of income.
C) regressive throughout all levels of income.
D) progressive between $10,000 and $12,000 of income and regressive between
$12,000 and $22,000.
Table 2-11
Table 2-11 shows the number of labor hours required to produce a digital camera and a
pound of wheat in China and South Korea.
South Korea has a comparative advantage in the production of

A) wheat.
B) digital cameras.
C) both products.
D) neither product.
Which of the following is an example of a worker experiencing cyclical
unemployment?
A) a worker who changes jobs to move closer her family
B) an assembly line worker who loses his job because of automation
C) a freightliner employee that got laid off because of the recession of 2007-2009
D) a lifeguard who was hired during the summer season is laid off after summer is over
E) a worker who quits his job because he does not get along with his boss
Suppose a price floor on sparkling wine is proposed by the Health Minister of the
country of Vinyardia. What will be the likely effect on the market for sparkling wine in
Vinyardia?
A) Quantity demanded will decrease, quantity supplied will increase, and a surplus will
result.
B) Quantity demanded will increase, quantity supplied will decrease, and a surplus will
result.

C) Quantity demanded will decrease, quantity supplied will increase, and a shortage
will result.
D) Quantity demanded will increase, quantity supplied will decrease, and a shortage
will result.
Suppose real GDP is $13 trillion, potential real GDP is $13.5 trillion, and Congress and
the president plan to use fiscal policy to restore the economy to potential real GDP.
Assuming a constant price level, Congress and the president would need to decrease
taxes by
A) $500 billion.
B) less than $500 billion.
C) more than $500 billion.
D) None of the above are correct. Congress should raise taxes in this case.
Table 9-4
Rob Crusoe and Bill Friday spent their week-long vacation on a desert island where
they had to find and make their own food. Rob and Bill spent one day each fishing and
picking berries. The table lists the pounds of output Rob and Bill produced. Use the
table above to select the statement that accurately interprets the data in the table.

A) Bill has a greater opportunity cost than Rob for picking berries.
B) Bill’s opportunity cost for catching fish is less than Rob’s.
C) Rob has a greater opportunity cost than Bill for picking berries.
D) Bill’s opportunity cost for picking berries and catching fish are both greater than
Rob’s.
The marginal productivity theory of income distribution states that
A) as more and more units of labor are added to a fixed quantity of capital, eventually
labor’s contribution to a firm’s income will decrease.
B) income distribution is determined by the marginal productivity of the factors of
production that individuals own.
C) factors of production in short supply command higher prices than those available in
abundant quantities.
D) capital owners receive the bulk of a nation’s income because capital-intensive
production generates productivity gains.
The demand for capital is similar to the demand for labor in that
A) the marginal product of labor is derived from the marginal product of capital.
B) the marginal revenue product curve for labor is the same as the marginal revenue
product curve for capital.

C) both are derived demands.
D) both are inelastic at high prices and elastic at low prices.
In a subgame perfect equilibrium,
A) the first mover has an advantage over other players.
B) the last mover has an advantage over other players.
C) each player’s strategy constitutes a Nash equilibrium at every subgame of the
original game.
D) each player has the same response as the others at every subgame of the tree.