What characteristic of a competitive market has made the “long run pretty short” in the
market for iPhone applications?
A) few firms in the market
B) identical products
C) ease of entry
D) blocked entry
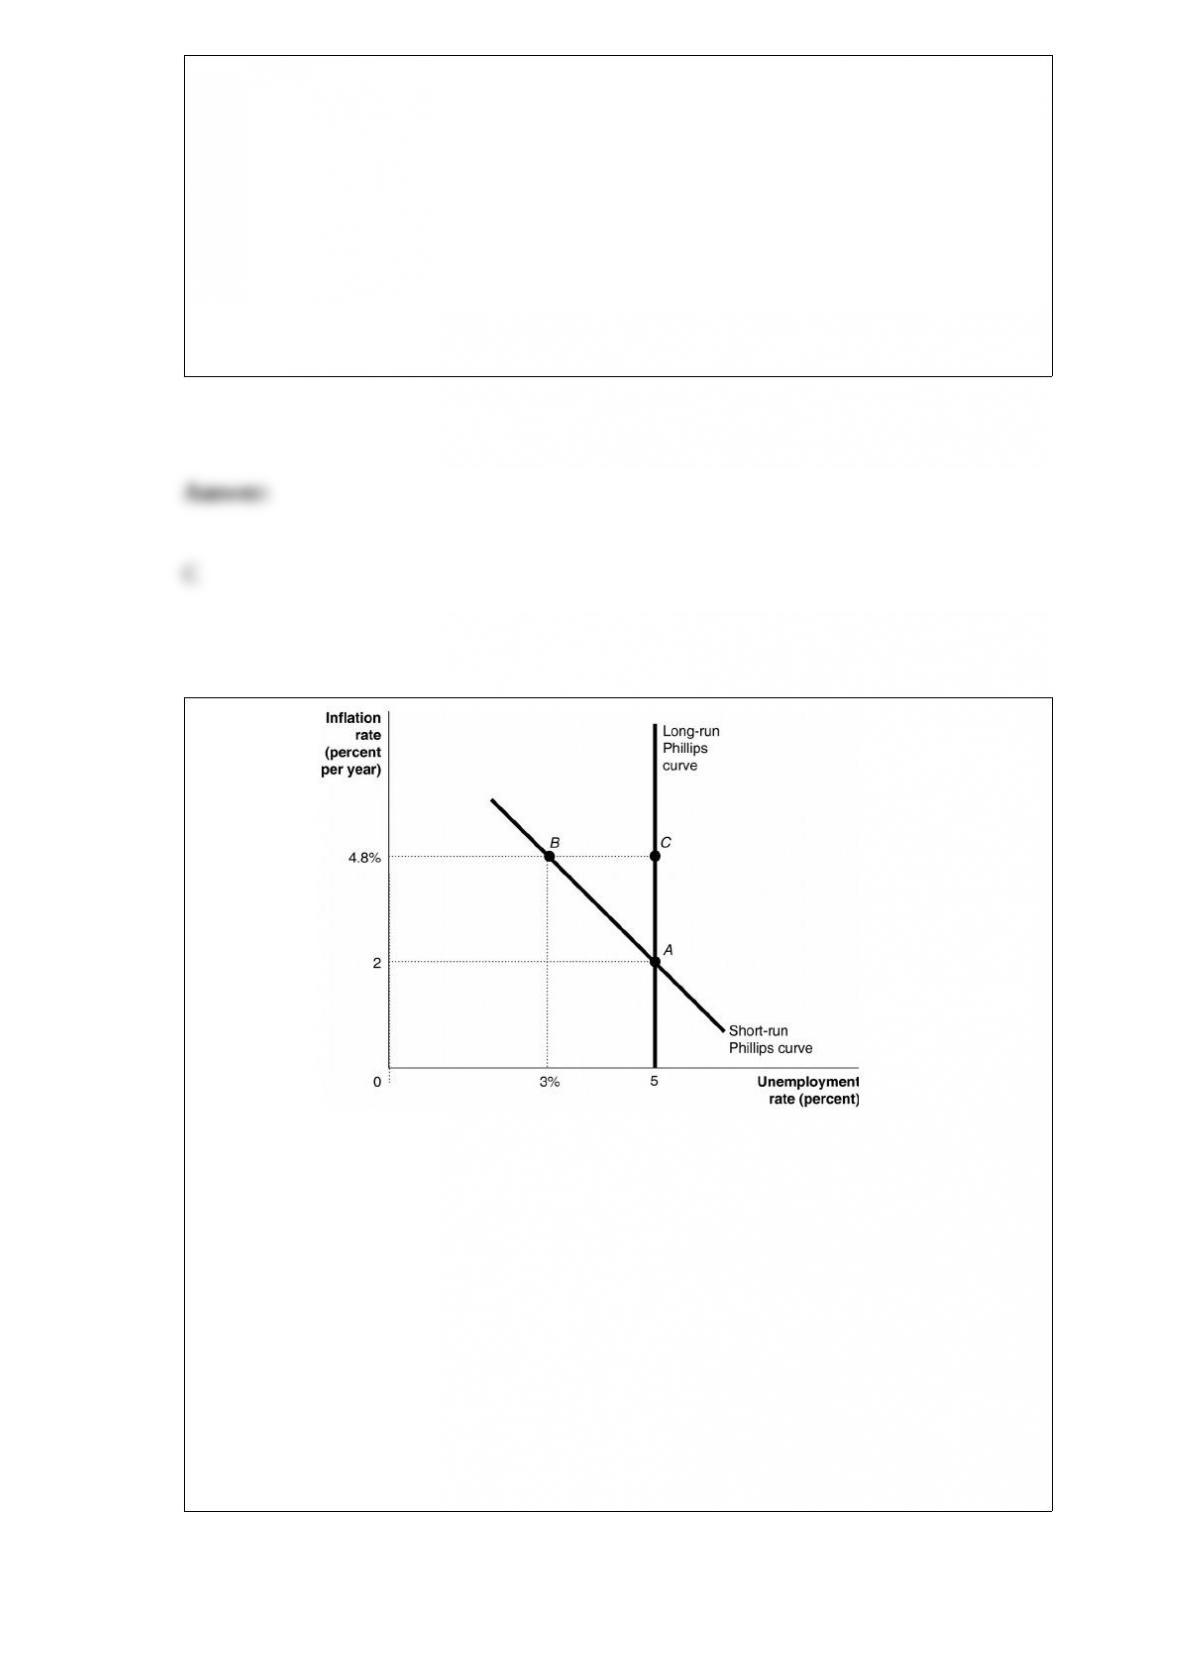
Figure 28-6
If firms and workers have adaptive expectations, an expansionary monetary policy will
cause the short-run equilibrium to move from
A) point B to point C.
B) point A to point C.
C) point A to point B.
D) point B to point A.
E) point C to point B.
Until the early 1980s, The Walt Disney Company used a pricing strategy in which
visitors to its theme parks paid a low admission fee and also paid for rides. This pricing
strategy is an example of
A) perfect price discrimination.
B) cost-plus pricing.
C) a two-part tariff.
D) monopoly pricing.
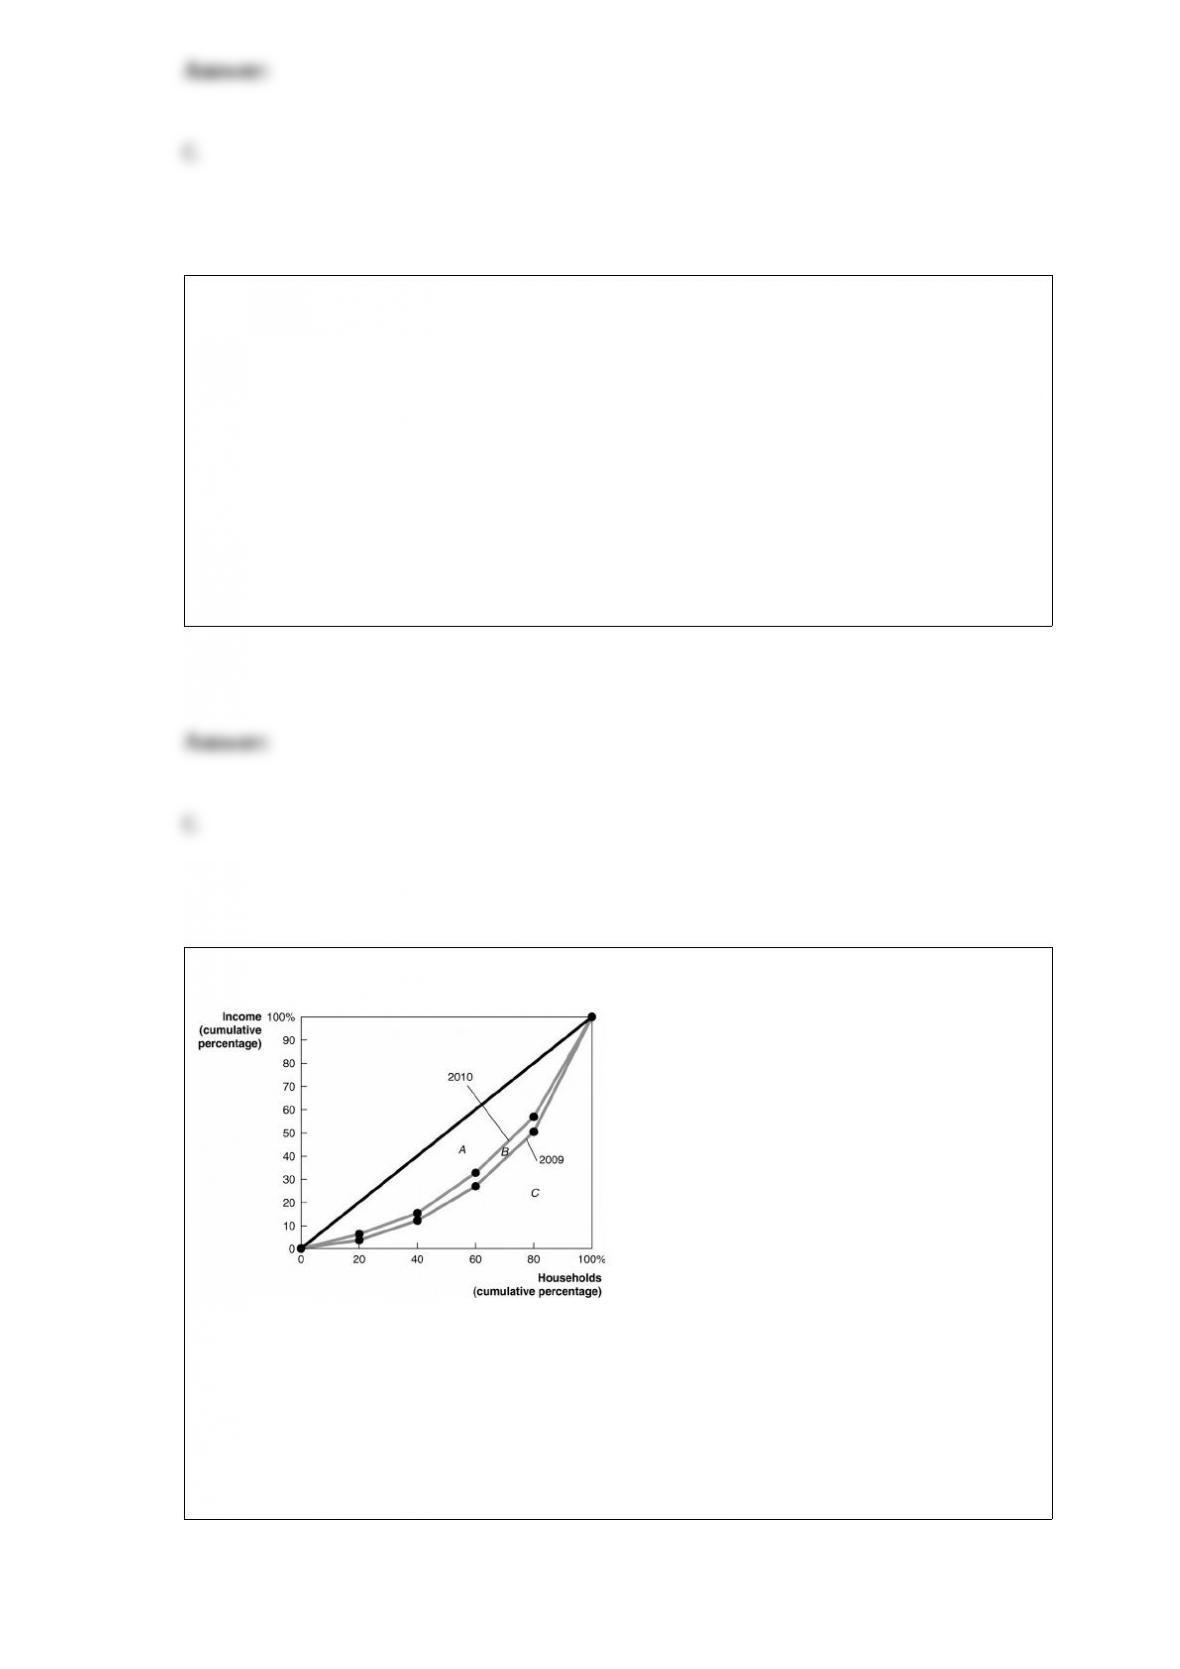
Figure 18-9
Answer the following questions.
a. Did the distribution of income become more equal in 2010 that it was in 2009, or did
it become less equal? Explain.
b. If area A = 1,600, area B = 200, and area C = 3,200, calculate the Gini coefficient for
2009 and the Gini coefficient for 2010.

Suppose the governor of California has proposed increasing toll rates on California’s
toll roads, and has presented two possible scenarios to implement these increases.
Following are projected data for the two scenarios for the California toll roads: Scenario
1: Toll rate in 2012: $10.00. Toll rate in 2016: $22.50
For every 100 cars using the toll roads in 2012, only 81.6 cars will use the toll roads in
2016. Scenario 2: Toll rate in 2012: $10.00. Toll rate in 2016: $17.50
For every 100 cars using the toll roads in 2012, only 96.2 cars will use the toll roads in
2016.
a. Using the midpoint formula, calculate the price elasticity of demand for Scenario 1
and Scenario 2. b. Assume 10,000 cars use California toll roads every day in 2012.
What would be the daily total revenue received for each scenario in 2012 and in 2016?
c. Is demand under Scenario 1 and under Scenario 2 price elastic, inelastic, or unit
elastic. Briefly explain. (For above questions, assume that nothing other than the toll
change occurs during the time frame listed that would affect consumer demand.)
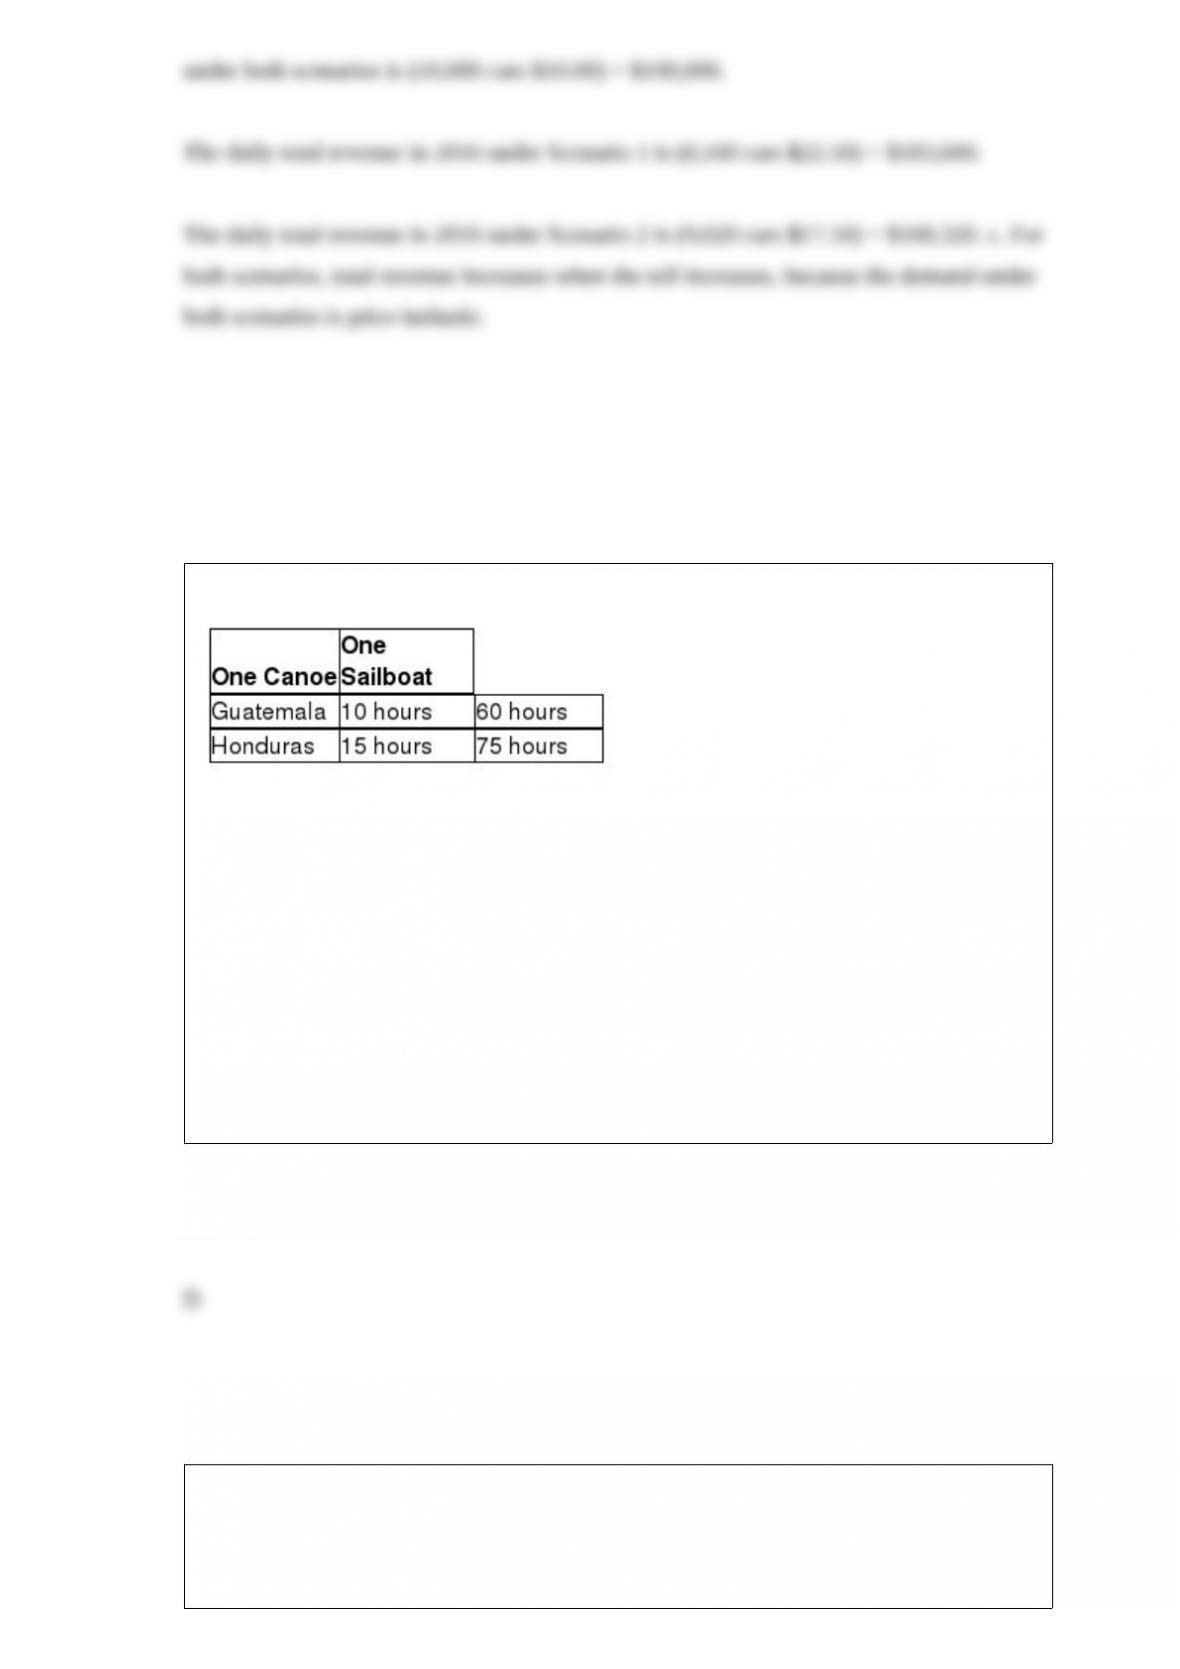
Table 2-12
Table 2-12 shows the number of labor hours required to produce a canoe and a sailboat
in Guatemala and Honduras.
What is Guatemala’s opportunity cost of producing one sailboat?
A) 1/6 of a canoe
B) 2/3 of a canoe
C) 3 canoes
D) 6 canoes
Which of the following is held constant along an indifference curve?
A) the prices of the goods in question

B) the marginal rate of substitution between the two goods in question
C) the marginal utility derived from consuming any bundle of goods on the indifference
curve
D) the total utility derived from consuming any bundle of goods on the indifference
curve
Traditionally, Wall Street investment banks had been organized as partnerships, but by
2000 they had converted to being publicly traded companies. As partnerships, the
principal-agent problem is ________ because there is ________ separation of
ownership from control.
A) reduced; much
B) reduced; little
C) increased; much
D) increased; little
The slope of a production possibilities frontier
A) has no economic relevance or meaning.
B) is always constant.
C) is always varying.
D) measures the opportunity cost of producing one more unit of a good.

Under Alan Greenspan, the Fed strived to hit its goals of price stability and high
employment through
A) setting targets for the federal funds rate of interest.
B) setting targets for rates of growth in the M1 and M2 money supplies.
C) practicing discretionary monetary policy, reacting to counter-changes in the level of
unemployment during recessions and booms.
D) strict adherence to rules based strategies.
If the implied exchange rate between Big Mac prices in the United States and the
Philippines is 68 pesos per dollar, but the actual exchange rate between the United
States and the Philippines is 43 pesos per dollar, which of the following would you
expect to see?
A) a depreciation of the dollar
B) a decrease in the demand for Philippine pesos
C) a decrease in the demand for dollars
D) an appreciation of the Philippine pesos
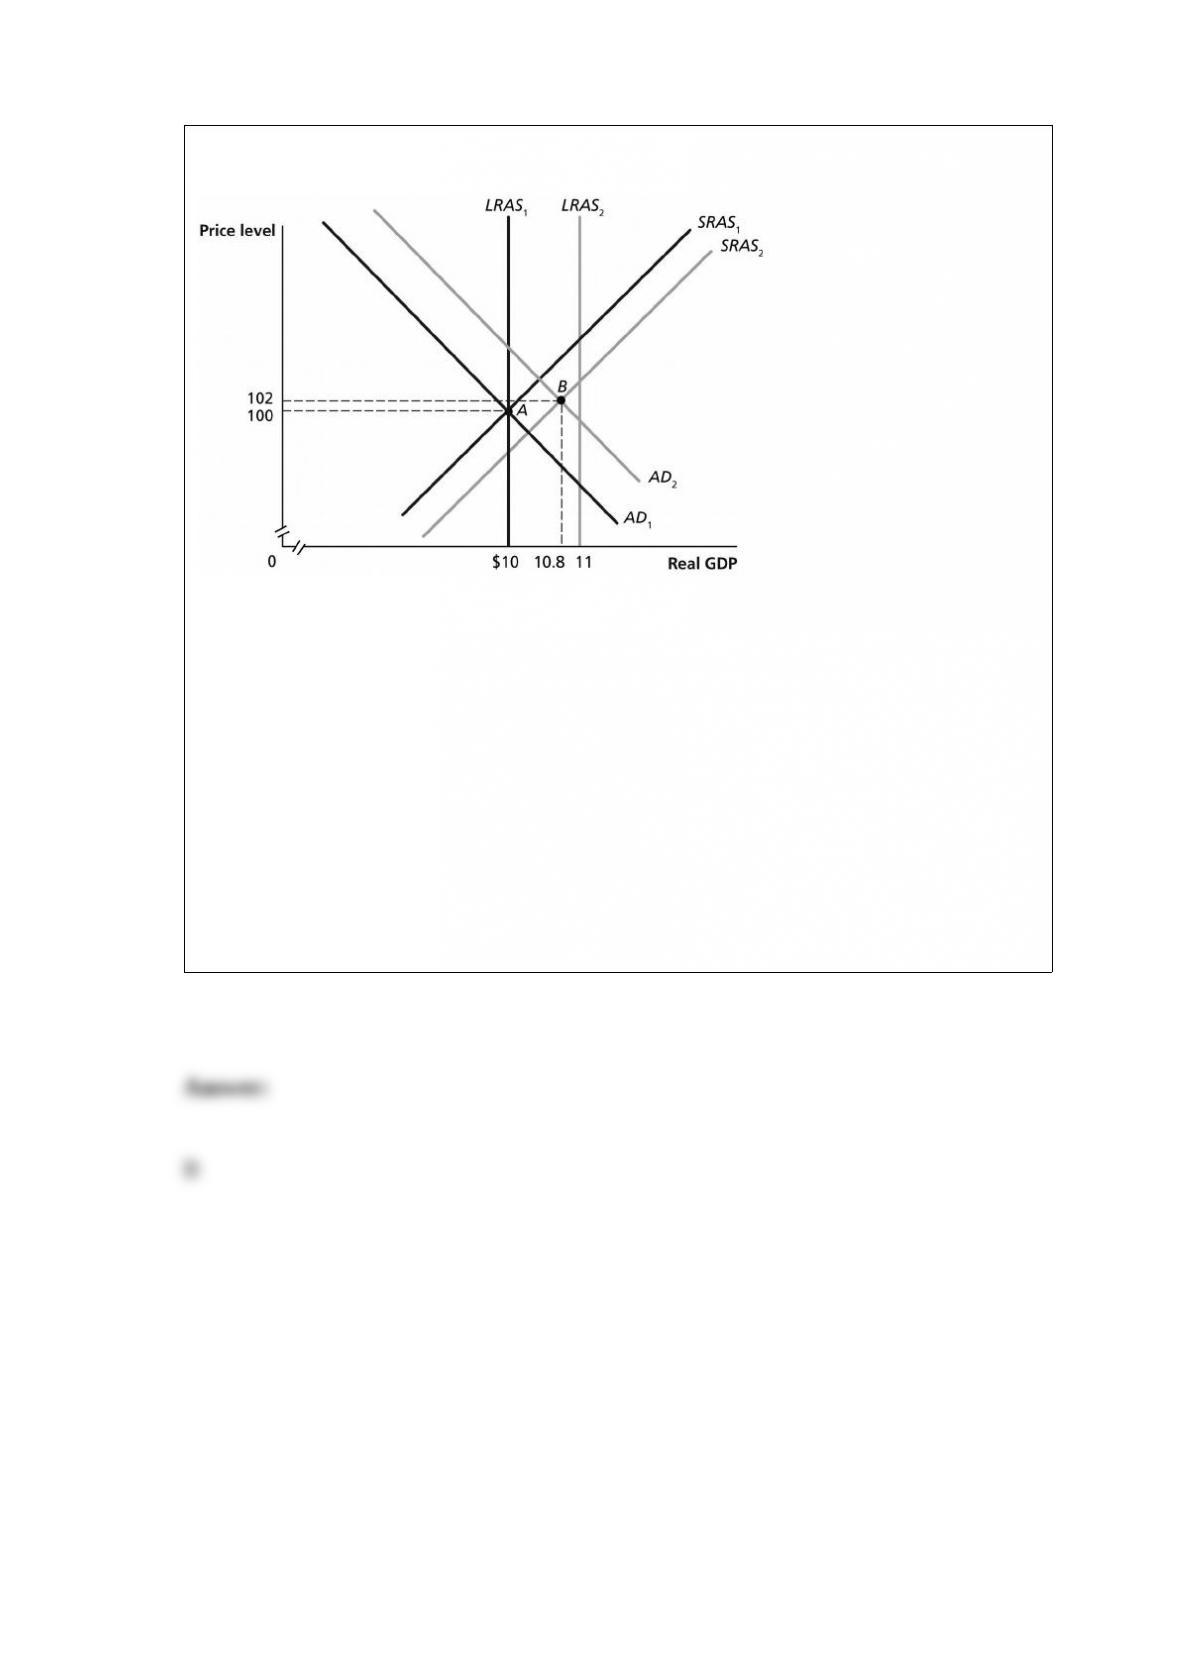
Figure 15-11
In the dynamic model of AD–AS in the figure above, the economy is at point A in year 1
and is expected to go to point B in year 2, and the Federal Reserve pursues policy. This
will result in
A) unemployment rates higher than what would occur if no policy had been pursued.
B) inflation higher than what would occur if no policy had been pursued.
C) real GDP lower than what would occur if no policy had been pursued.
D) short-term interest rates higher than what would occur if no policy had been
pursued.