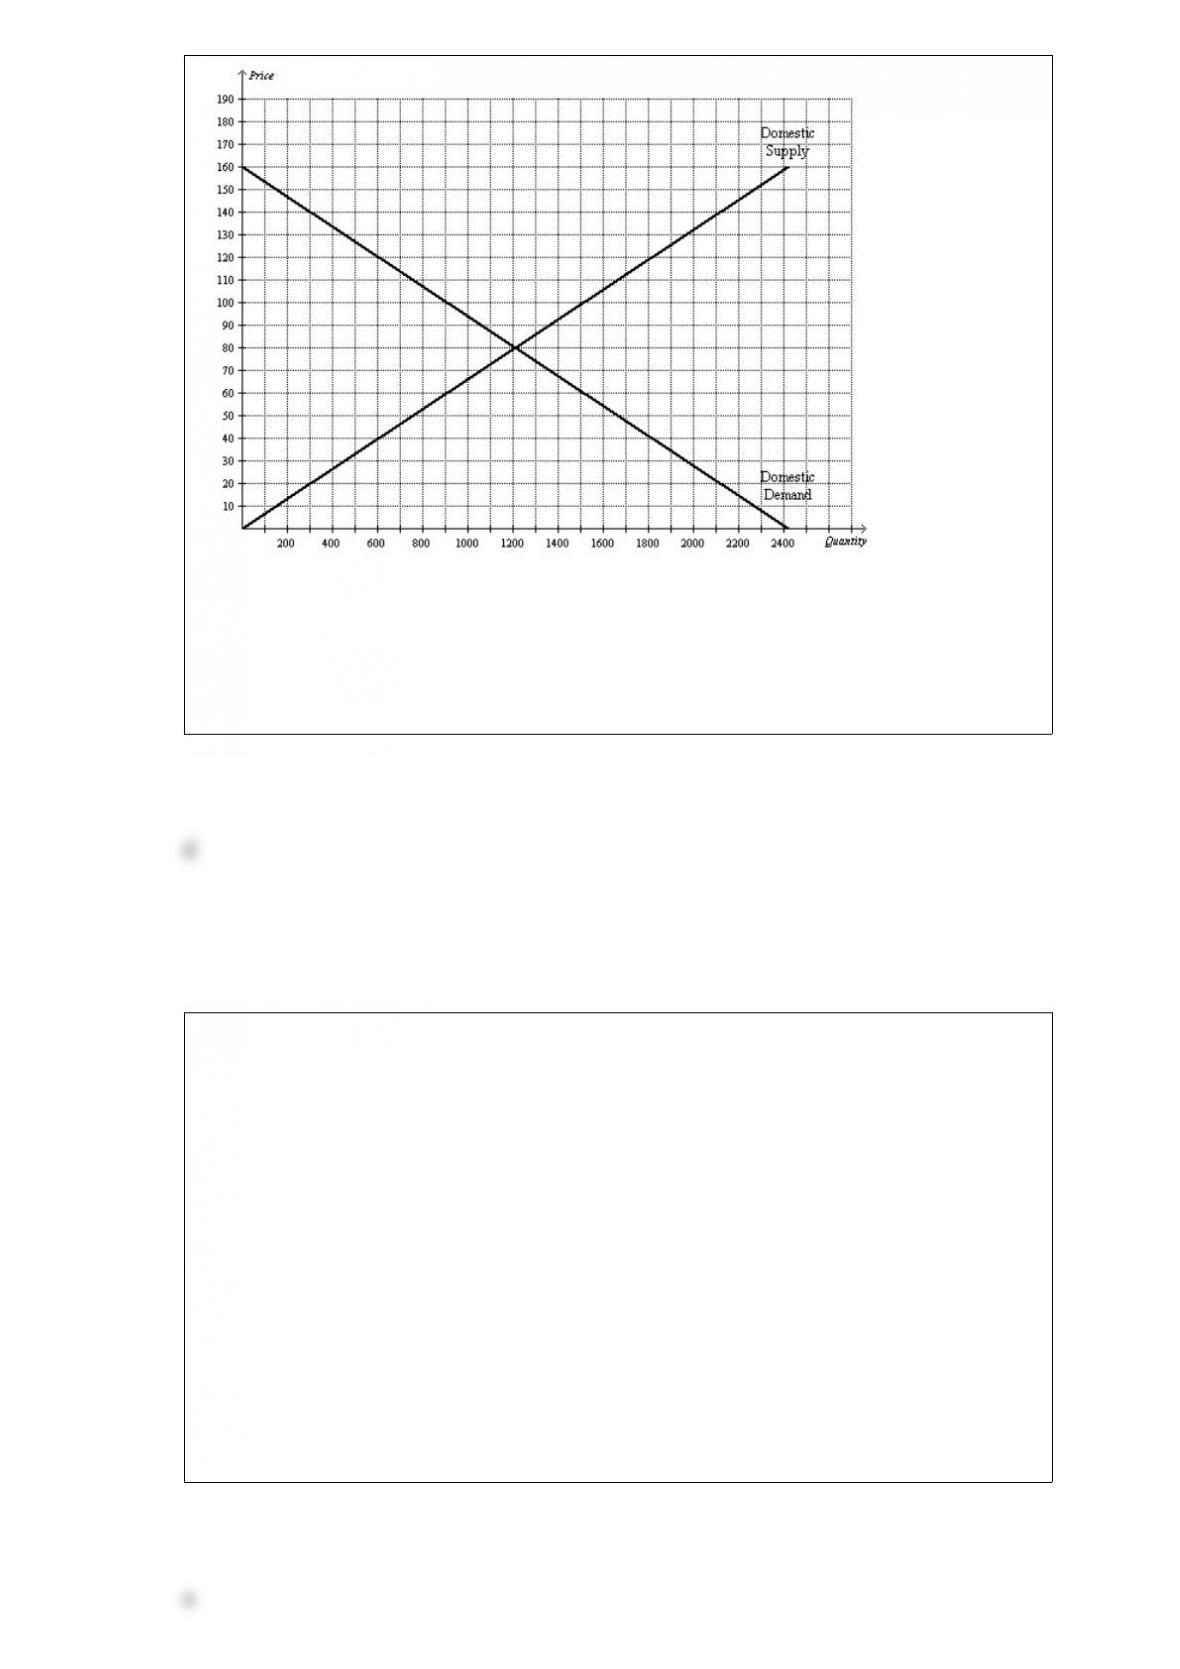
Figure 917
Refer to Figure 917. Without trade, consumer surplus is
a. $400 and producer surplus is $200.
b. $400 and producer surplus is $800.
c. $1,600 and producer surplus is $200.
d. $1,600 and producer surplus is $800.
The supply of a good or service is determined by
a. those who buy the good or service.
b. the government.
c. those who sell the good or service.
d. both those who buy and those who sell the good or service.
A linear, upwardsloping supply curve has

a. a constant slope and a changing price elasticity of supply.
b. a changing slope and a constant price elasticity of supply.
c. both a constant slope and a constant price elasticity of supply.
d. both a changing slope and a changing price elasticity of supply.
Table 43
PriceBert’s
Quantity
DemandedErnie’s
Quantity
DemandedGrover’s
Quantity
DemandedOscar’s
Quantity
Demanded
$0.00201648
$0.50181266
$1.00141025
$1.5012804
$2.006602
$2.500400
Refer to Table 43. Whose demand does not obey the law of demand?
a. Bert’s
b. Ernie’s
c. Grover’s
d. Oscar’s
Figure 69

Refer to Figure 69. At which price would a price floor be binding?
a. $7
b. $6
c. $4
d. $5
When the government imposes taxes on buyers or sellers of a good, society
a. loses some of the benefits of market efficiency.
b. gains efficiency but loses equality.
c. is better off because the government’s tax revenues exceed the deadweight loss.
d. moves from an elastic supply curve to an inelastic supply curve.
Figure 23

Refer to Figure 23. What is flowing from rectangle 1 to oval A?
a. revenue
b. goods and services sold
c. factors of production
d. labor, land, and capital
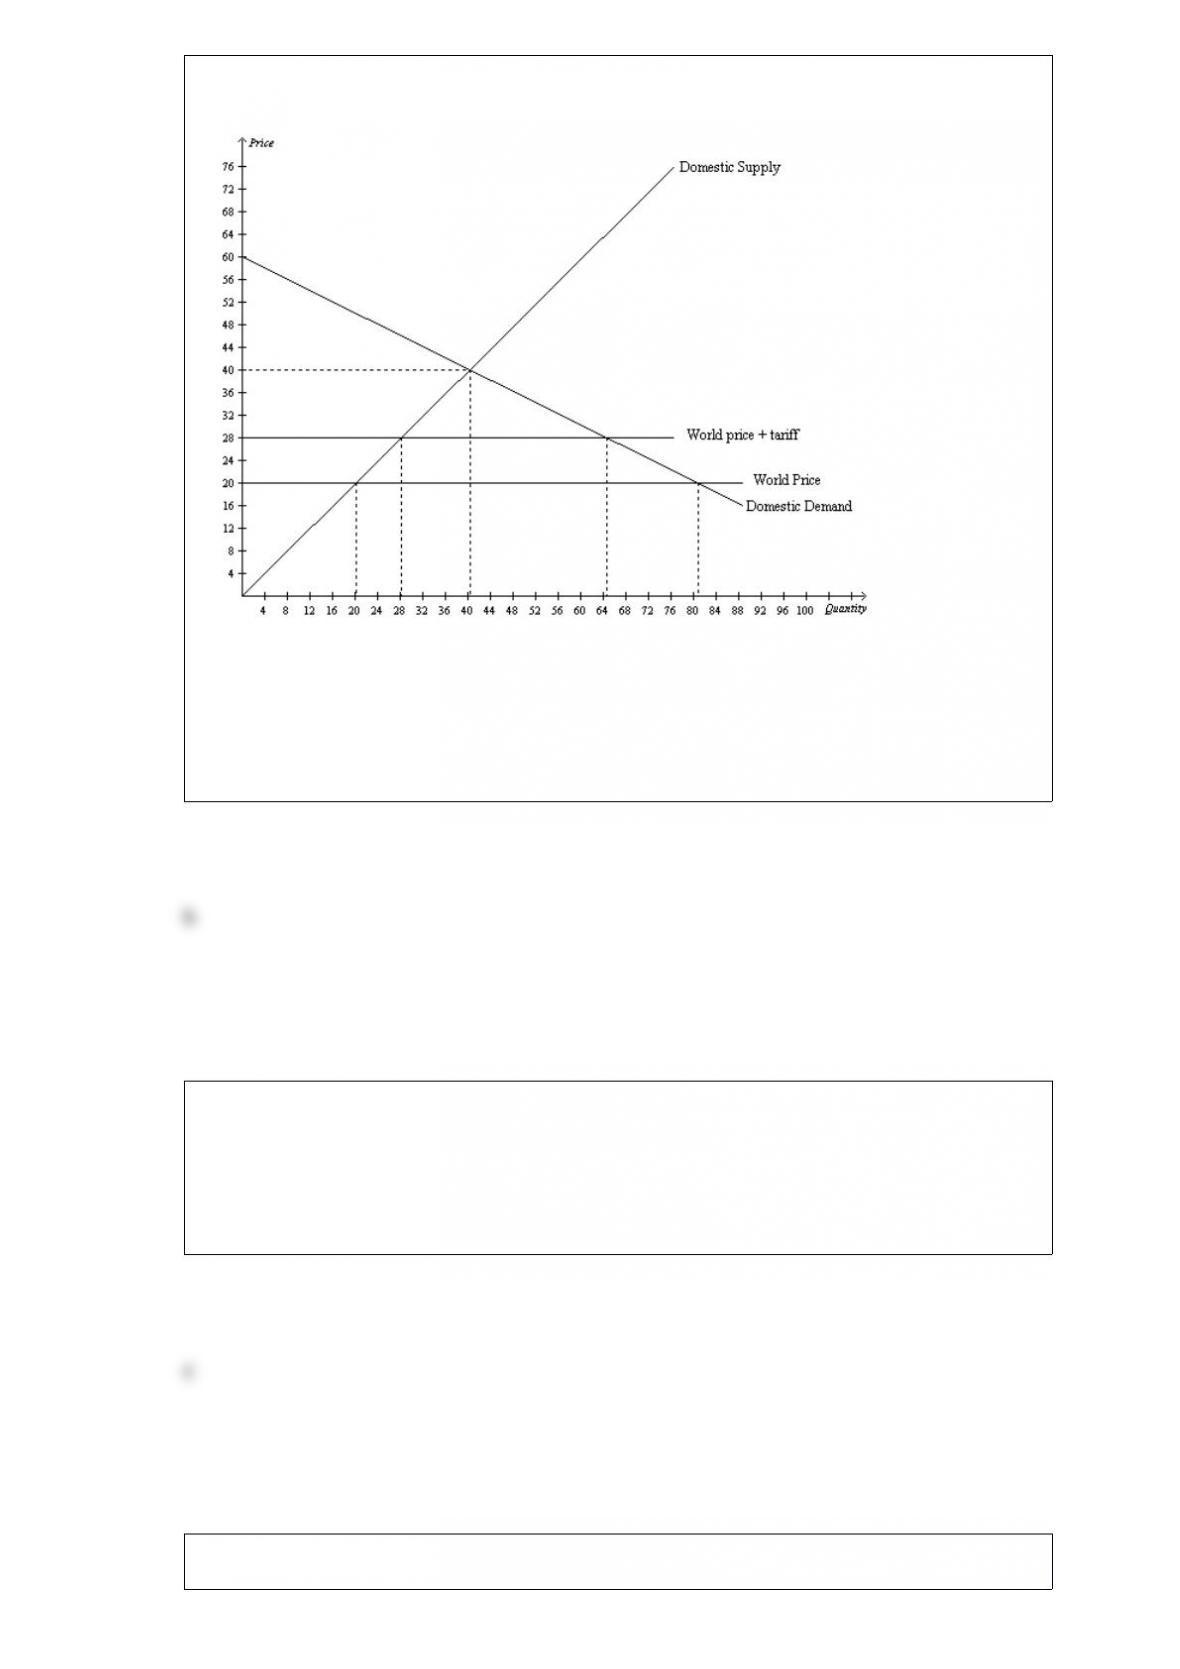
Figure 922
The following diagram shows the domestic demand and domestic supply in a market. In
addition, assume that the world price in this market is $40 per unit.
Refer to Figure 922. With free trade, total surplus is
a. $30,000.
b. $66,000.
c. $96,000.
d. $120,000.
Table 324
Assume that England and Spain can switch between producing cheese and producing
bread at a constant rate.
Labor Hours Needed to Make 1 Unit ofNumber of Units Produced in 40 Hours
CheeseBreadCheeseBread
England 144010
Spain 48105
Refer to Table 324. England should specialize in the production of
a. cheese and Spain should specialize in the production of bread.
b. bread and Spain should specialize in the production of cheese.
c. both goods and Spain should specialize in the production of neither good.
d. neither good and Spain should specialize in the production of both goods.

Economists are particularly adept at understanding that people respond to
a. laws.
b. incentives.
c. punishments more than rewards.
d. rewards more than punishments.
Table 317
The following table contains some production possibilities for an economy for a given
year.
CakesPies
10600
20400
30?
Refer to Table 317. If the production possibilities frontier is bowed outward, then “?”
could be
a. 180.
b. 200.
c. 220
d. 240.
Which of the following is likely to have the most price inelastic demand?
a. tablet computers
b. leather boots
c. lightbulbs
d. optional textbooks

Bill created a new software program he is willing to sell for $300. He sells his first copy
and enjoys a producer surplus of $250. What is the price paid for the software?
a. $50.
b. $250.
c. $300.
d. $550.
Table 716
PriceQuantity
DemandedQuantity
Supplied
$12.00036
$10.00330
$ 8.00624
$ 6.00918
$ 4.001212
$ 2.00156
$ 0.00180
Refer to Table 716. Both the demand curve and the supply curve are straight lines. At
equilibrium, consumer surplus is
a. $24.
b. $36.
c. $42.
d. $48.
Figure 710
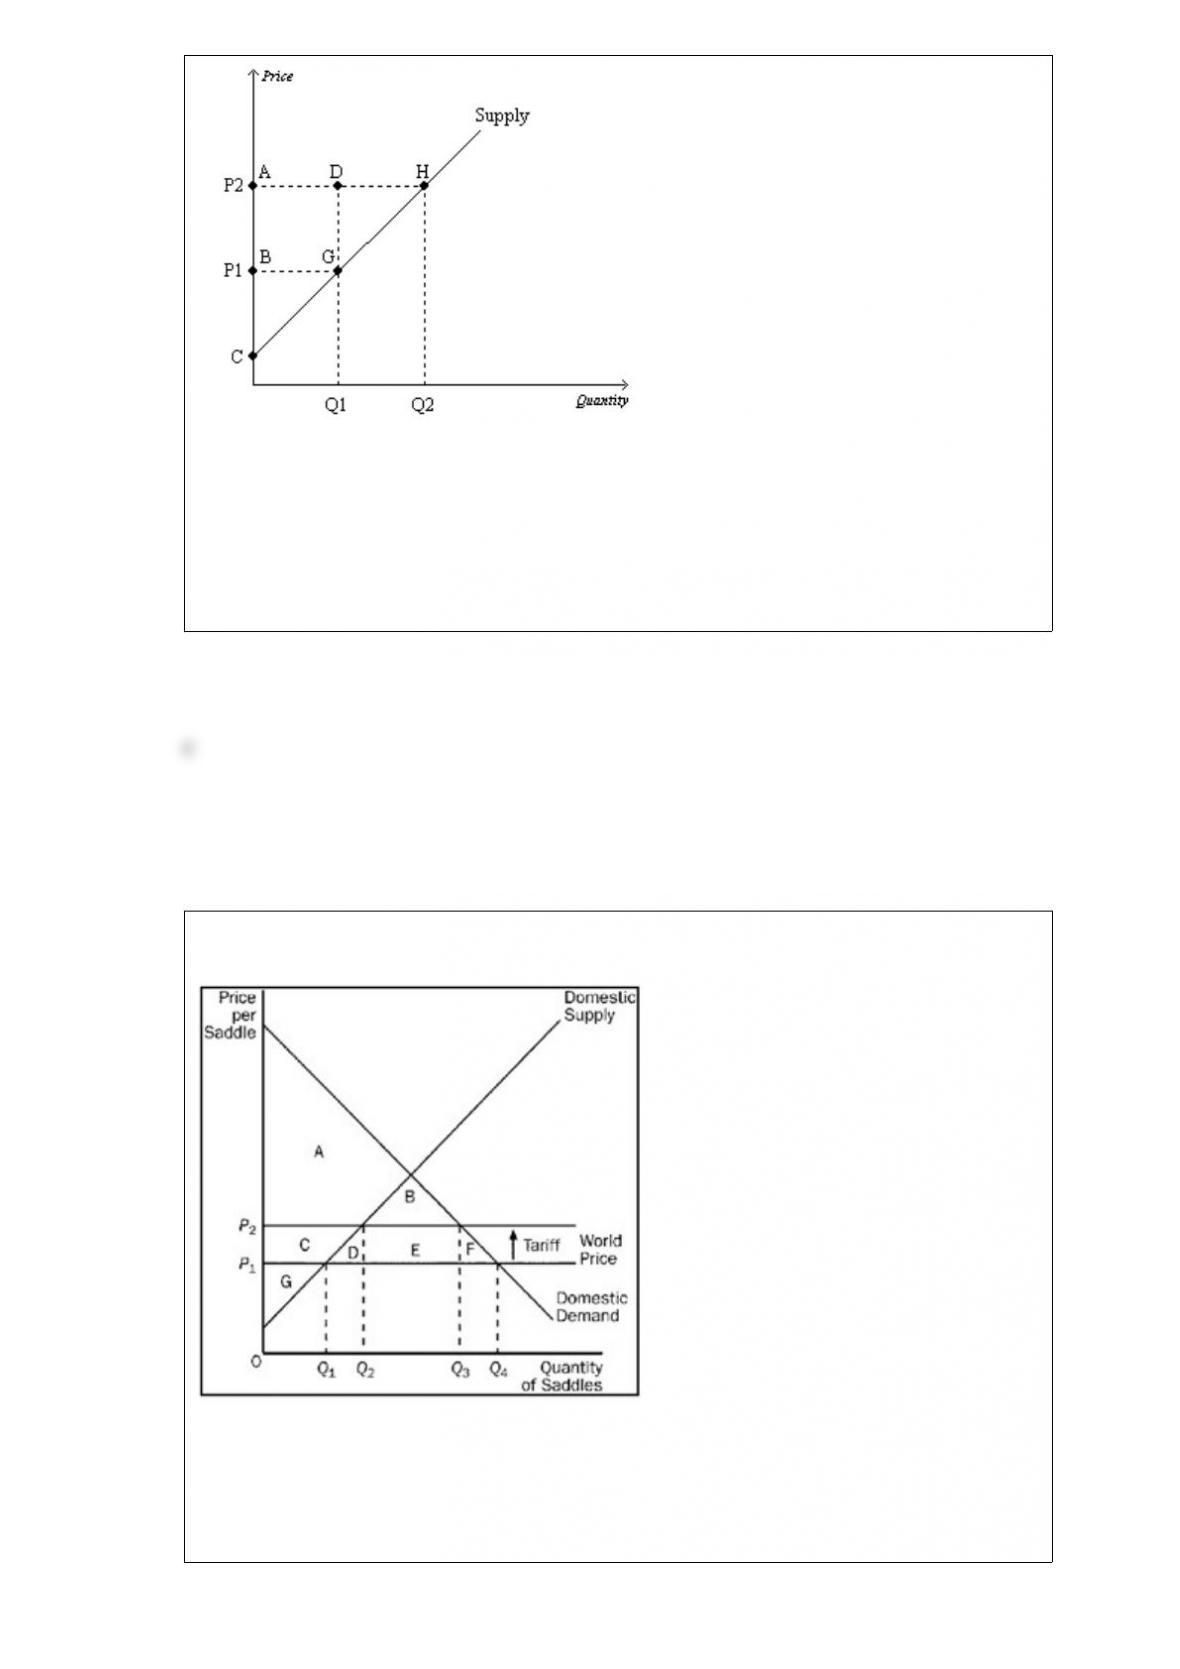
Refer to Figure 710. Which area represents the increase in producer surplus when the
price rises from P1 to P2 due to new producers entering the market?
a. BCG
b. ACH
c. DGH
d. AHGB
Figure 915
Refer to Figure 915. Producer surplus with the tariff is
a. G.
b. C + G.
c. A + C + G.
d. A + B + C + G.
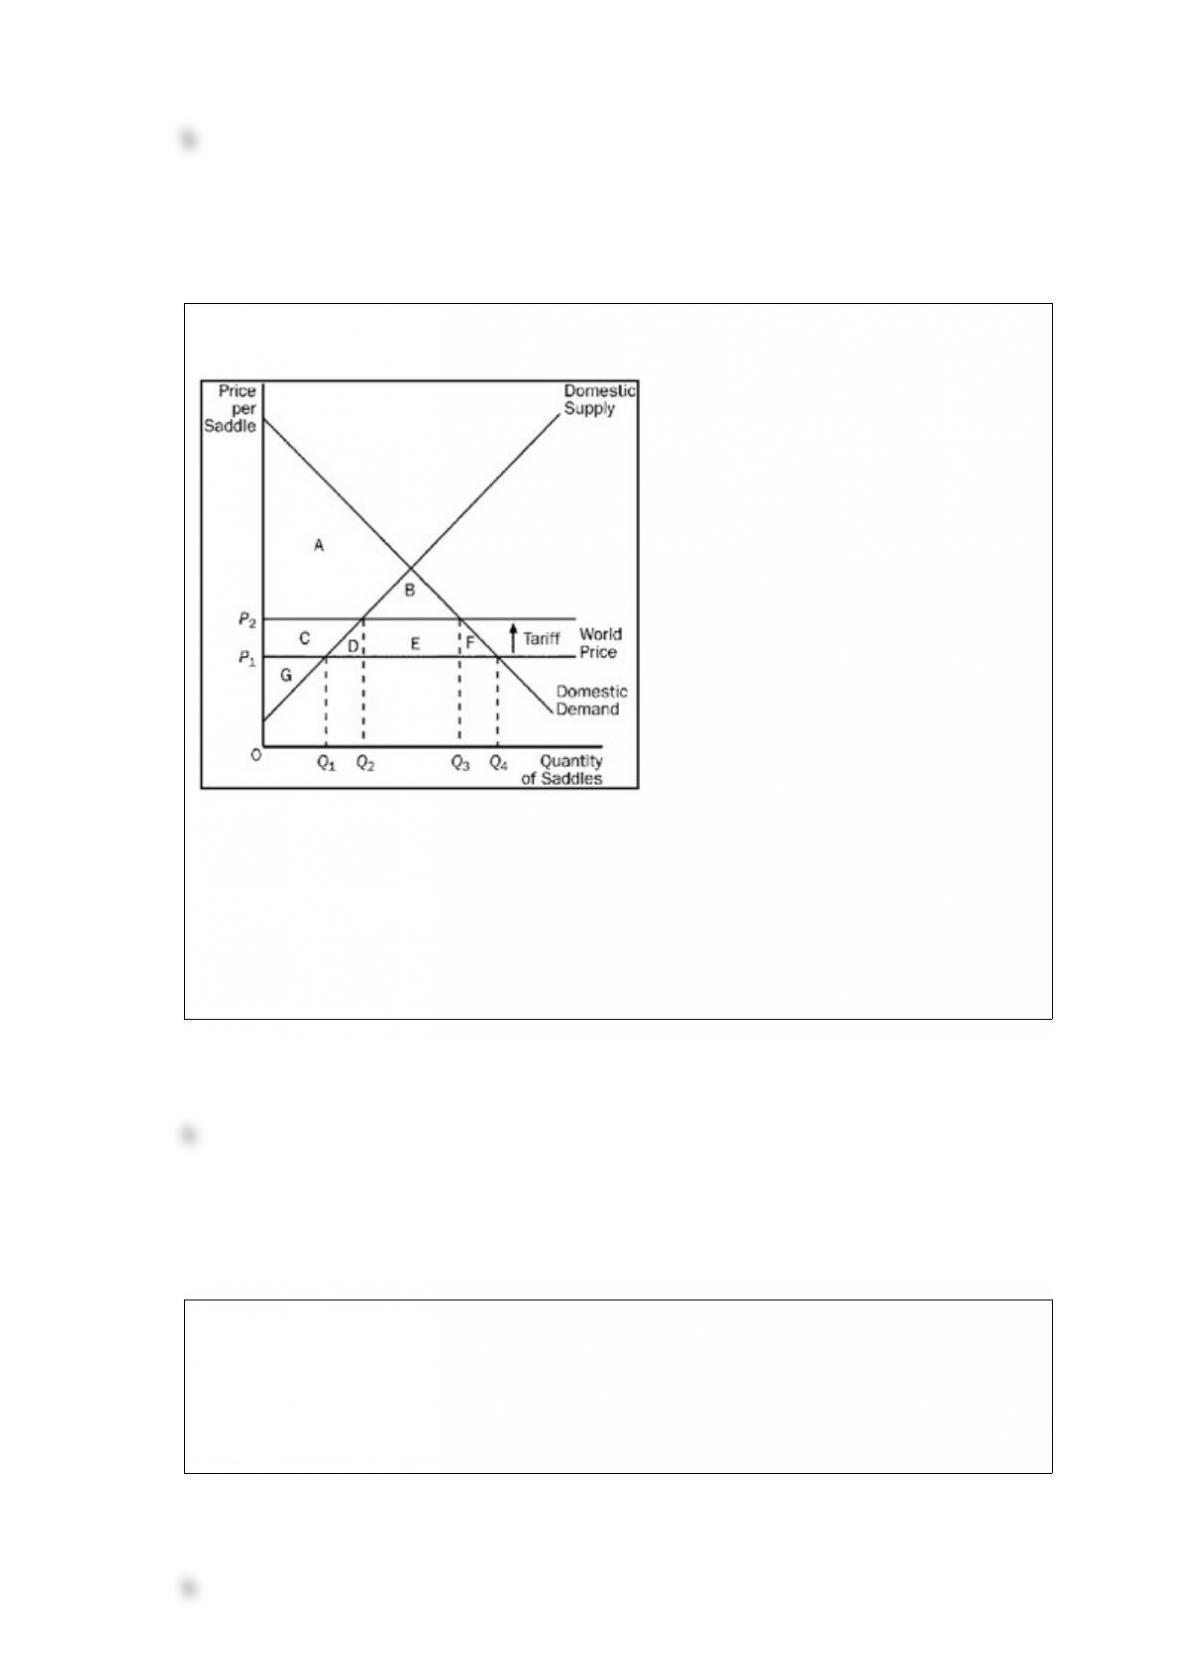
Figure 915
Refer to Figure 915. With trade and without a tariff, the price and domestic quantity
demanded are
a. P1 and Q1.
b. P1 and Q4.
c. P2 and Q2.
d. P2 and Q3.
A deadweight loss is a consequence of a tax on a good because the tax
a. induces the government to increase its expenditures.
b. induces buyers to consume less, and sellers to produce less.
c. increases the equilibrium price in the market.
d. imposes a loss on buyers that is greater than the loss to sellers.

Which of the following is not an example of a positive, as opposed to normative,
statement?
a. Higher gasoline prices will reduce gasoline consumption.
b. Equality is more important than efficiency.
c. Trade restrictions lower our standard of living.
d. If a nation wants to avoid inflation, it will restrict the growth rate of the quantity of
money.
If a country allows trade and, for a certain good, the domestic price without trade is
higher than the world price,
a. the country will be an exporter of the good.
b. the country will be an importer of the good.
c. the country will be neither an exporter nor an importer of the good.
d. Additional information is needed about demand to determine whether the country
will be an exporter of the good, an importer of the good, or neither.
Suppose Larry, Moe, and Curly are bidding in an auction for a mintcondition video of
Charlie Chaplin’s first movie. Each has in mind a maximum amount that he will bid.
This maximum is called
a. a resistance price.
b. willingness to pay.
c. consumer surplus.
d. producer surplus.

Suppose the demand for peanuts increases. What will happen to producer surplus in the
market for peanuts?
a. It increases.
b. It decreases.
c. It remains unchanged.
d. It may increase, decrease, or remain unchanged.
In the simple circularflow diagram, households
a. are the only decision makers.
b. own the factors of production.
c. are buyers of inputs.
d. consume only some of the goods and services that firms produce.
Suppose there is currently a tax of $50 per ticket on airline tickets. Buyers of airline
tickets are required to pay the tax to the government. If the tax is reduced from $50 per
ticket to $30 per ticket, then the
a. demand curve will shift upward by $20, and the effective price received by sellers
will increase by $20.
b. demand curve will shift upward by $20, and the effective price received by sellers
will increase by less than $20.
c. supply curve will shift downward by $20, and the price paid by buyers will decrease
by $20.
d. supply curve will shift downward by $20, and the price paid by buyers will decrease
by less than $20.
A likely example of substitute goods for most people would be
a. peanut butter and jelly.
b. tennis balls and tennis rackets.
c. televisions and subscriptions to cable television services.
d. pencils and pens.
The price elasticity of demand for bread is
a. computed as the change in the price of bread divided by the change in the quantity
demanded of bread.
b. independent of the availability of close substitutes.
c. influenced by whether consumers view bread as a necessity or luxury.
d. All of the above are correct.
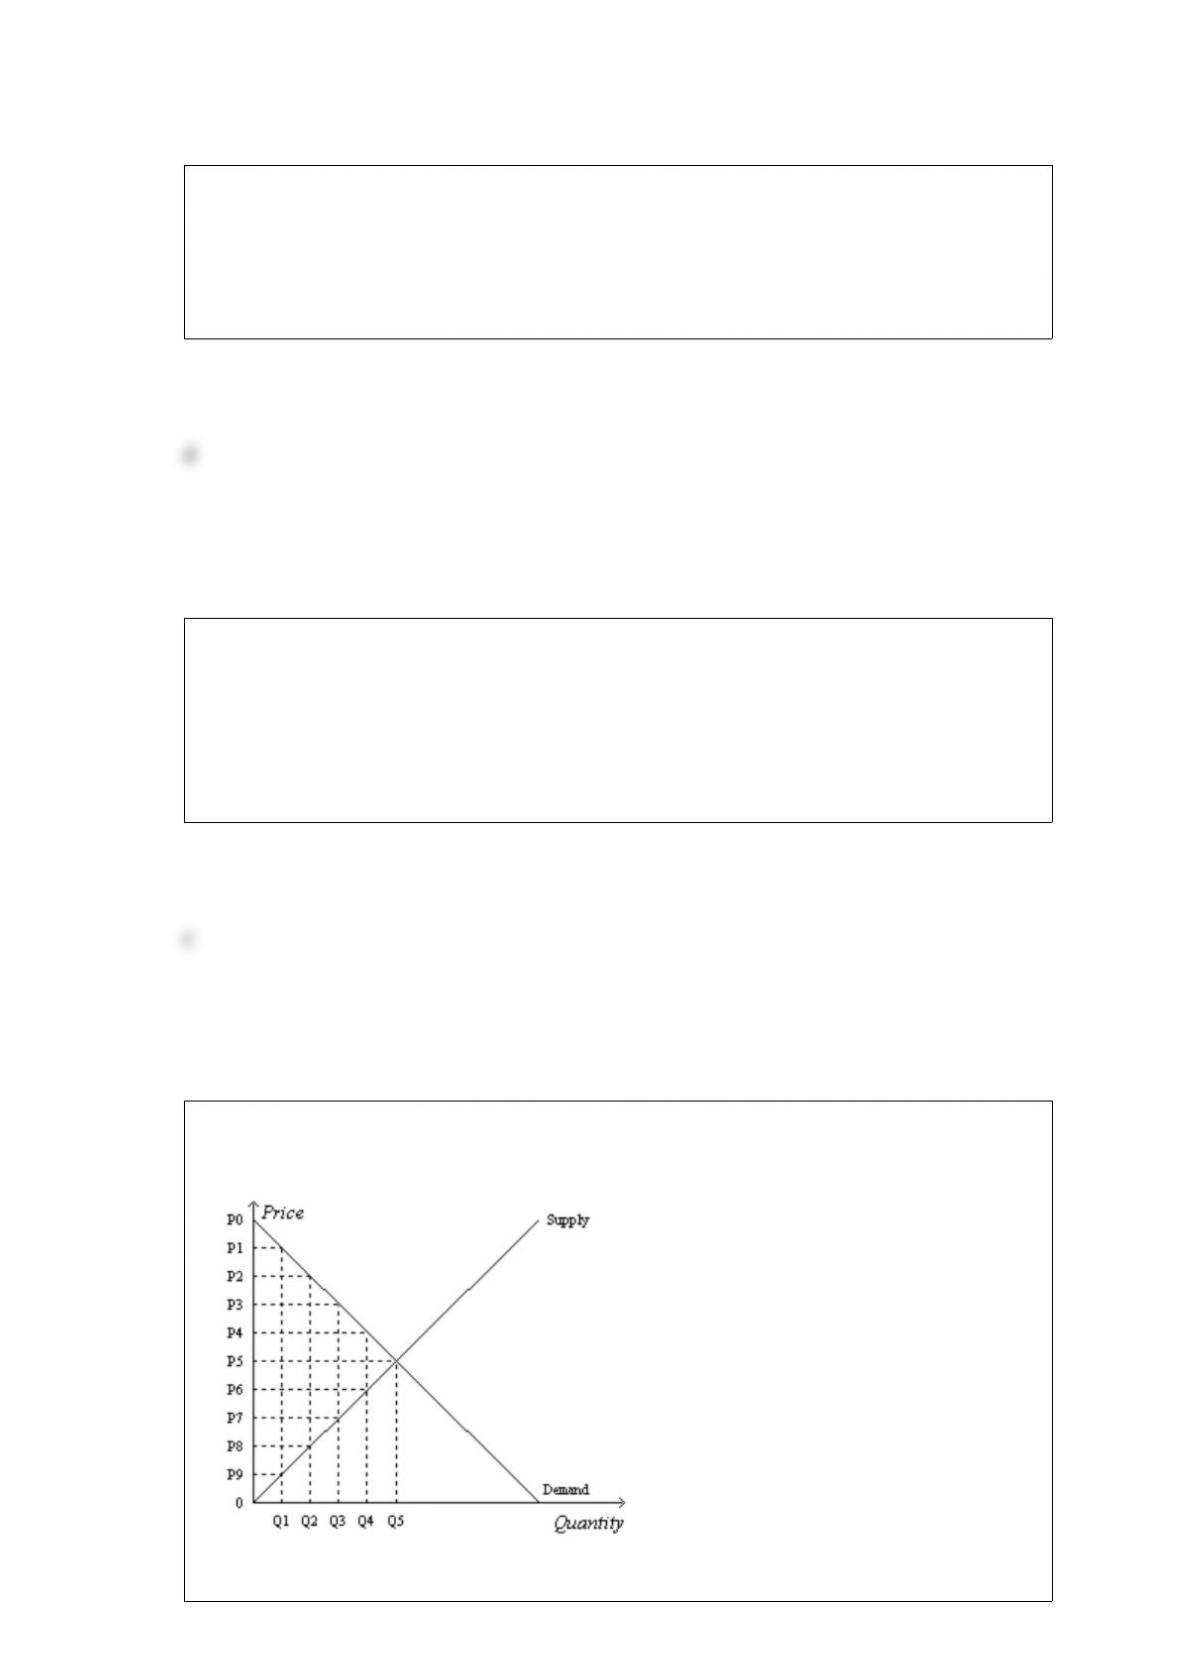
Figure 810
Refer to Figure 810. Suppose the government imposes a tax that reduces the quantity

sold in the market after the tax to Q2. The tax revenue is
a. (P0P2) x Q2.
b. (P2P8) x Q2.
c. (P2P5) x Q5.
d. (P5P8) x Q5.
Table 46
PriceFirm A’s
Quantity
SuppliedFirm B’s
Quantity
SuppliedFirm C’s
Quantity
SuppliedFirm D’s
Quantity
Supplied
$010000
$28345
$466810
$6491215
$8212820
$10015425
Refer to Table 46. If these are the only four sellers in the market, then when the price
decreases from $4 to $2, the market quantity supplied
a. increases by 10 units.
b. decreases by 10 units.
c. decreases by 20 units.
d. decreases by 30 units.
The business cycle is the
a. relationship between unemployment and inflation.
b. irregular fluctuations in economic activity.
c. positive relationship between the quantity of money in an economy and inflation.
d. predictable changes in economic activity due to changes in government spending and
taxes.
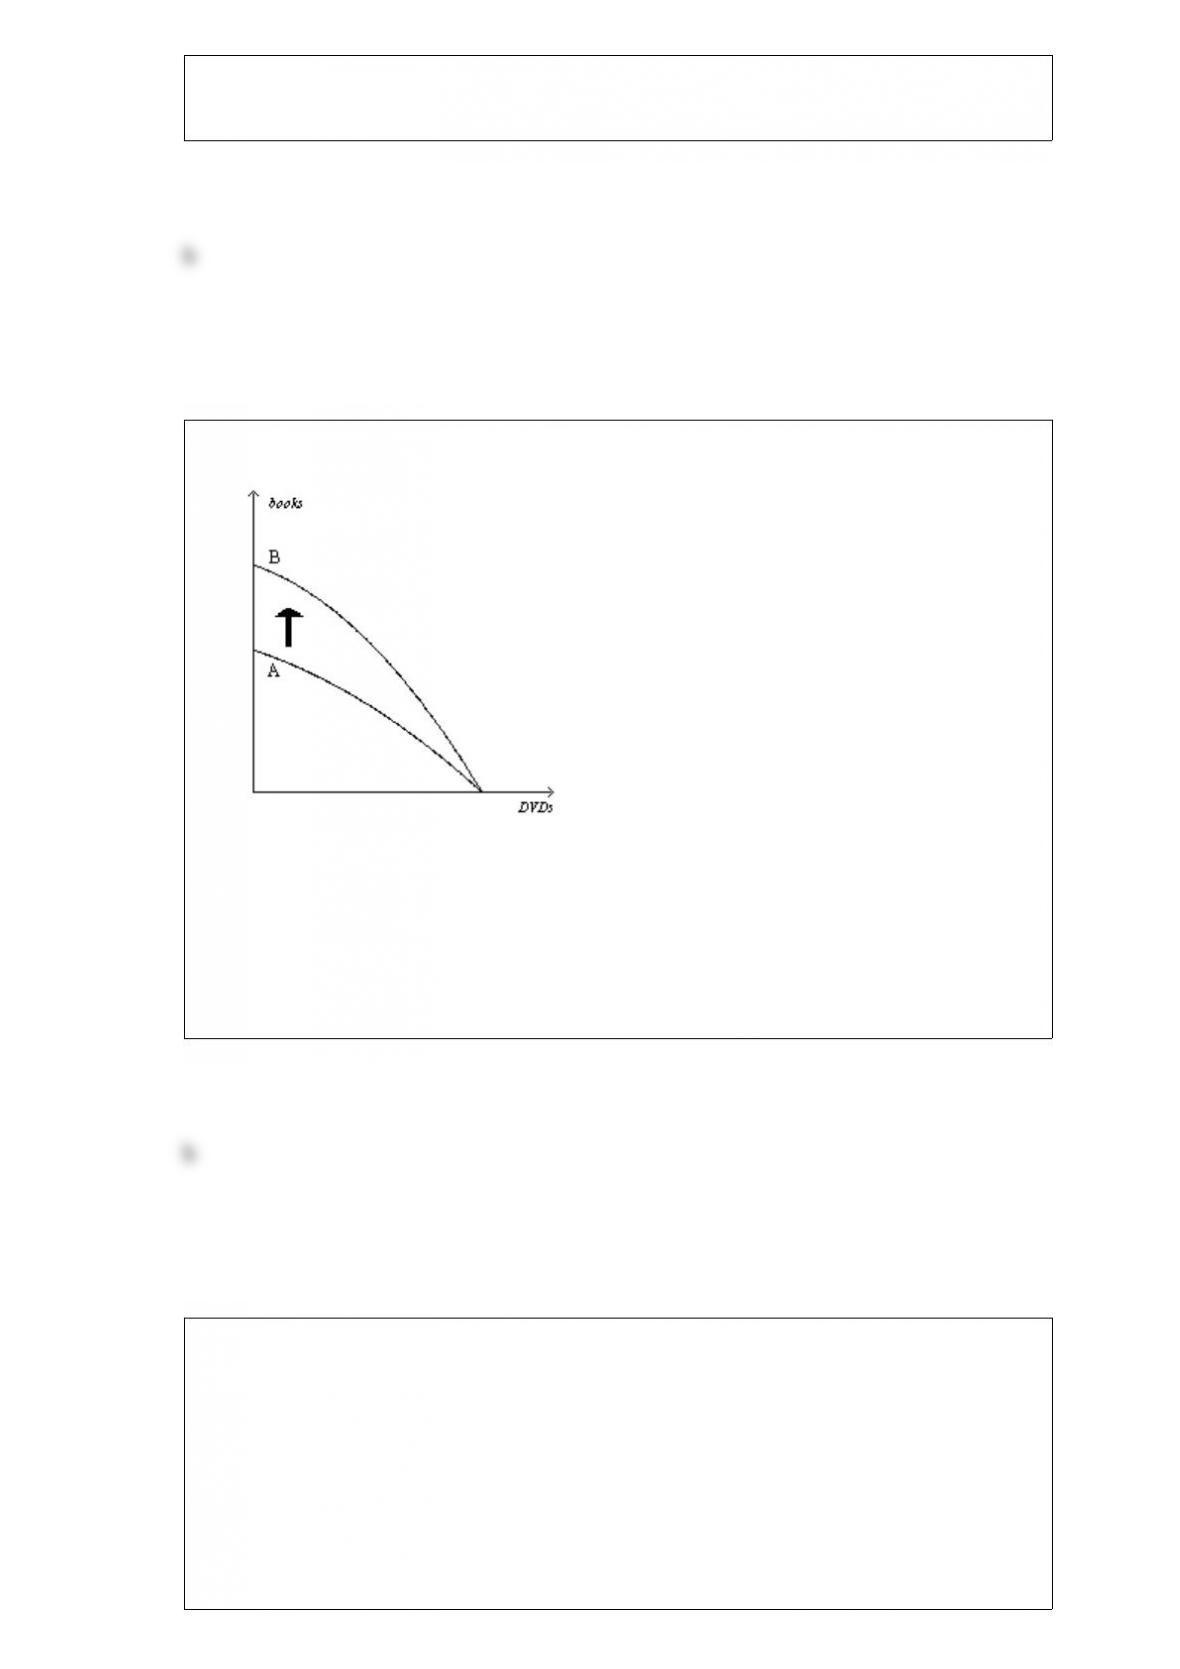
Figure 211
Refer to Figure 211. Which of the following events would explain the shift of the
production possibilities frontier from A to B?
a. The economy’s citizens developed an enhanced taste for books.
b. The economy experienced a technological advance in the production of books.
c. More capital became available in the economy.
d. More labor became available in the economy.
Table 63
The following table contains the demand schedule and supply schedule for a market for
a particular good. Suppose sellers of the good successfully lobby Congress to impose a
price floor $2 above the equilibrium price in this market.
PriceQuantity
DemandedQuantity
Supplied
$0150
$1133
$2116
$399
$4712
$5515
$6318
Refer to Table 63. How many units of the good are sold after the imposition of the
price floor?
a. 5
b. 9
c. 10
d. 15
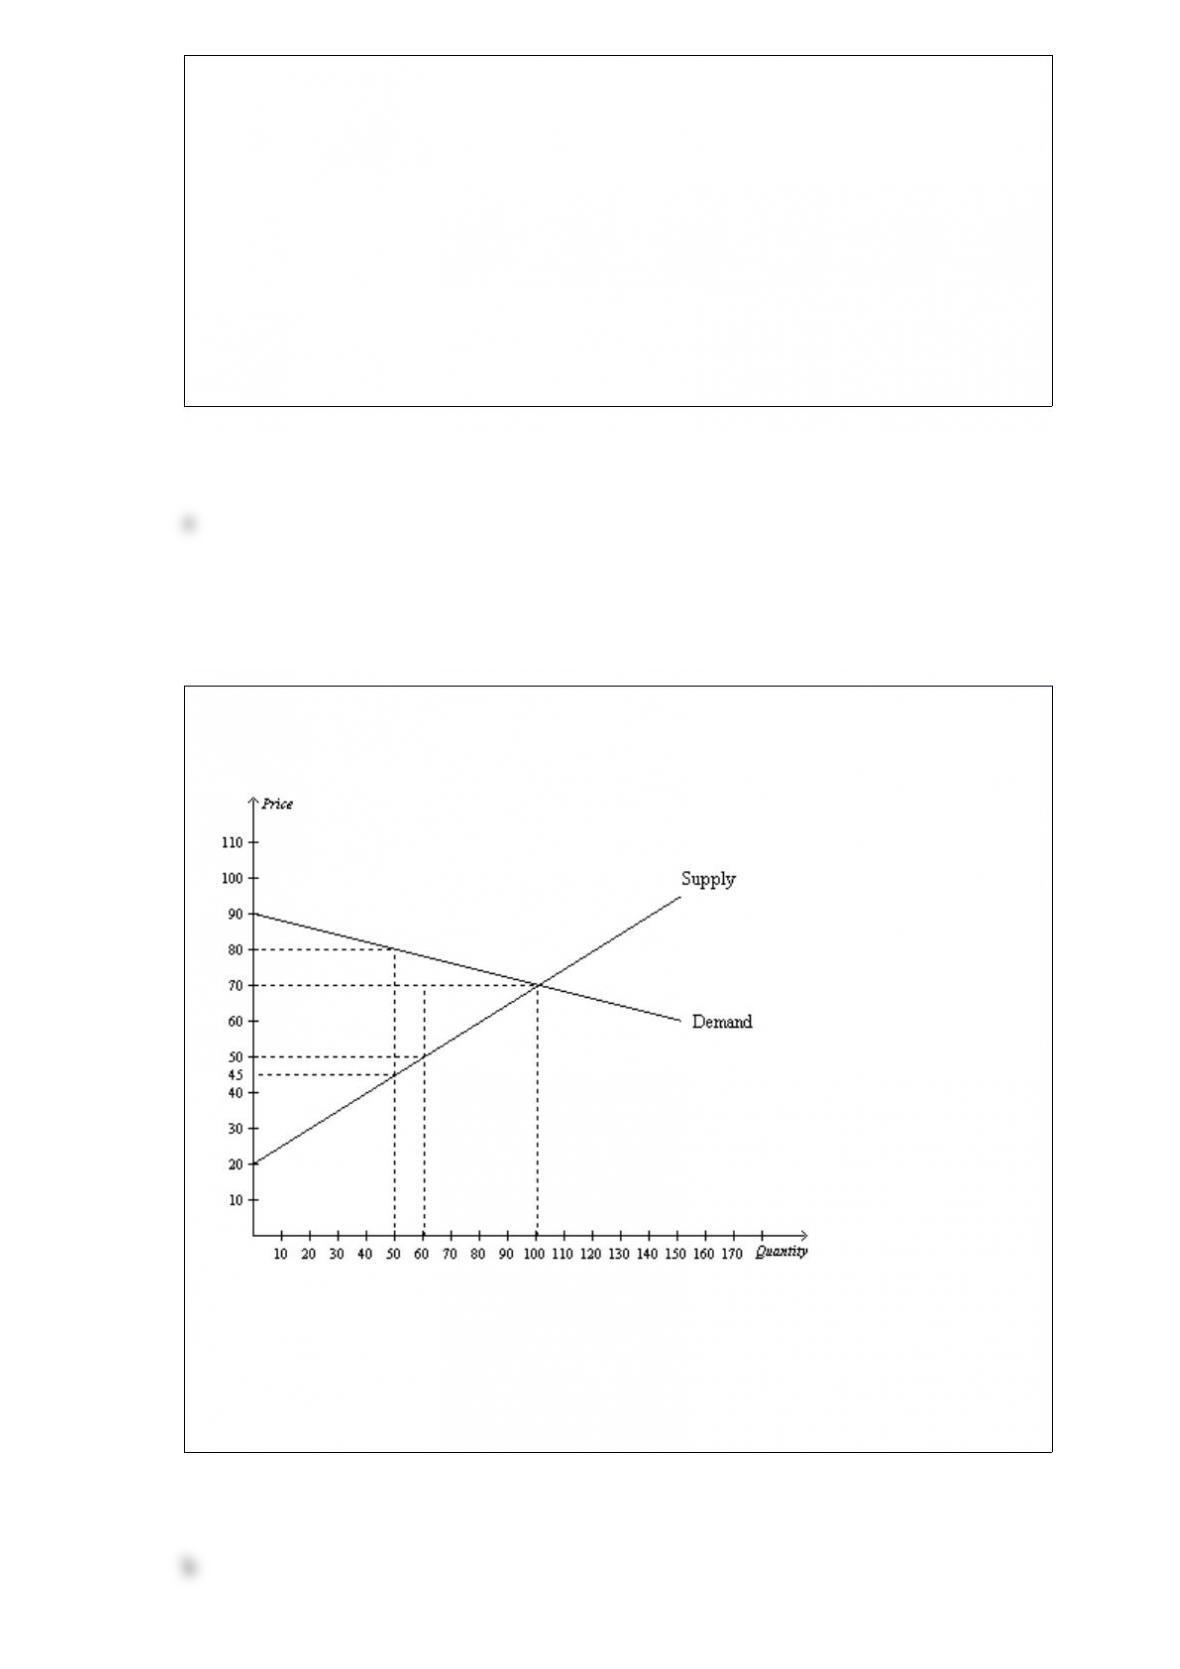
Figure 722
Refer to Figure 722. At the equilibrium price, producer surplus is
a. $5,000.
b. $2,500.
c. $3,500.
d. $1,750.
