
The amount of goods and services produced from each unit of labor input is called
a. opportunity cost.
b. productivity.
c. externality.
d. marginal benefit.
Suppose that Honduras opens its markets to international trade. As a result of this, the
domestic price of coffee decreases. We can conclude that
a. Honduras has a comparative advantage in the production of coffee.
b. Honduras has begun to import coffee into the country.
c. the price of coffee in Honduras prior to the opening of trade was lower than the world
price.
d. Honduras should specialize in the production of coffee.
The Federal Reserve
a. designs tax policy.
b. enforces the nation’s antitrust laws.
c. sets the nation’s monetary policy.
d. analyzes data on workers.
Opponents of the minimum wage point out that the minimum wage
a. encourages teenagers to drop out of school.
b. prevents some workers from getting needed onthejob training.
c. contributes to the problem of unemployment.
d. All of the above are correct.
Assume Leo buys coffee beans in a competitive market. It follows that
a. Leo has a limited number of sellers from which to buy coffee beans.
b. Leo will negotiate with sellers whenever he buys coffee beans.
c. Leo can influence the price of coffee beans if he buys a large quantity of them.
d. None of the above is correct.
Figure 812
Refer to Figure 812. Suppose a $3 perunit tax is placed on this good. The amount of
deadweight loss resulting from this tax is
a. $7.50.
b. $15.00.
c. $22.50.
d. $45.00.
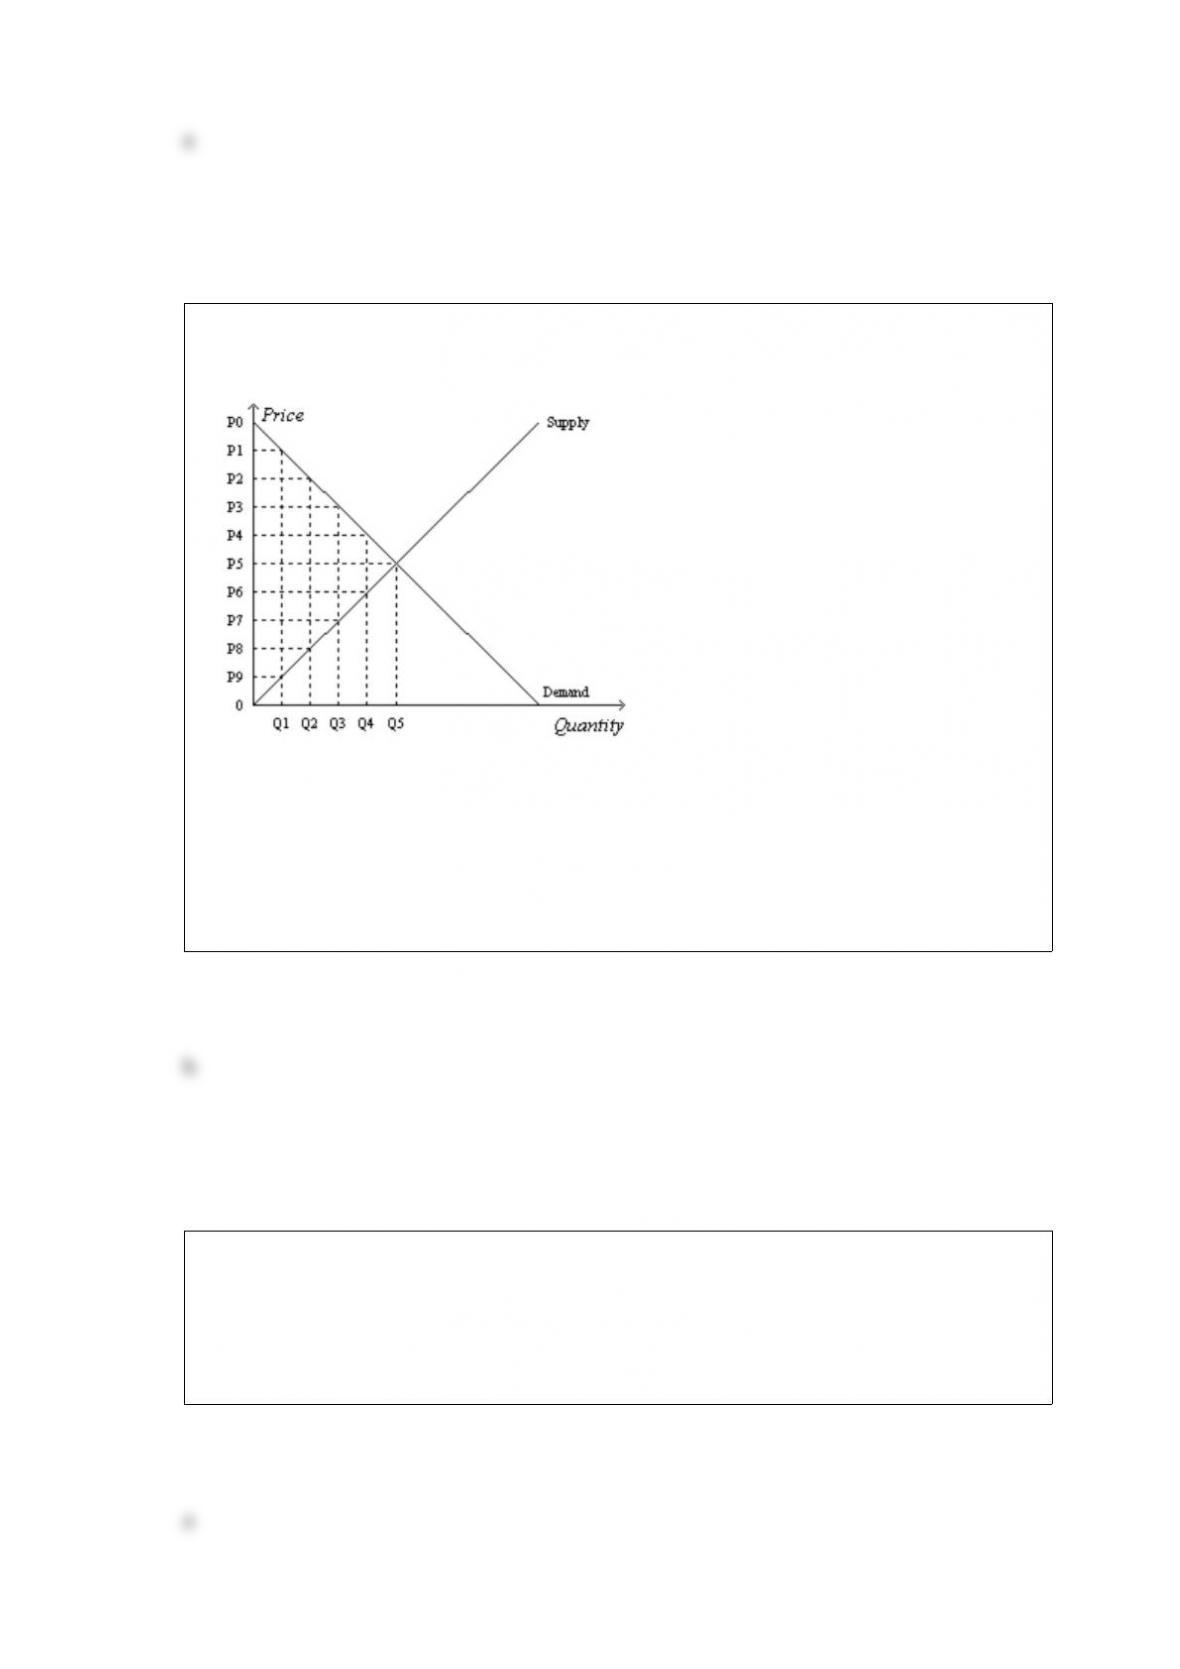
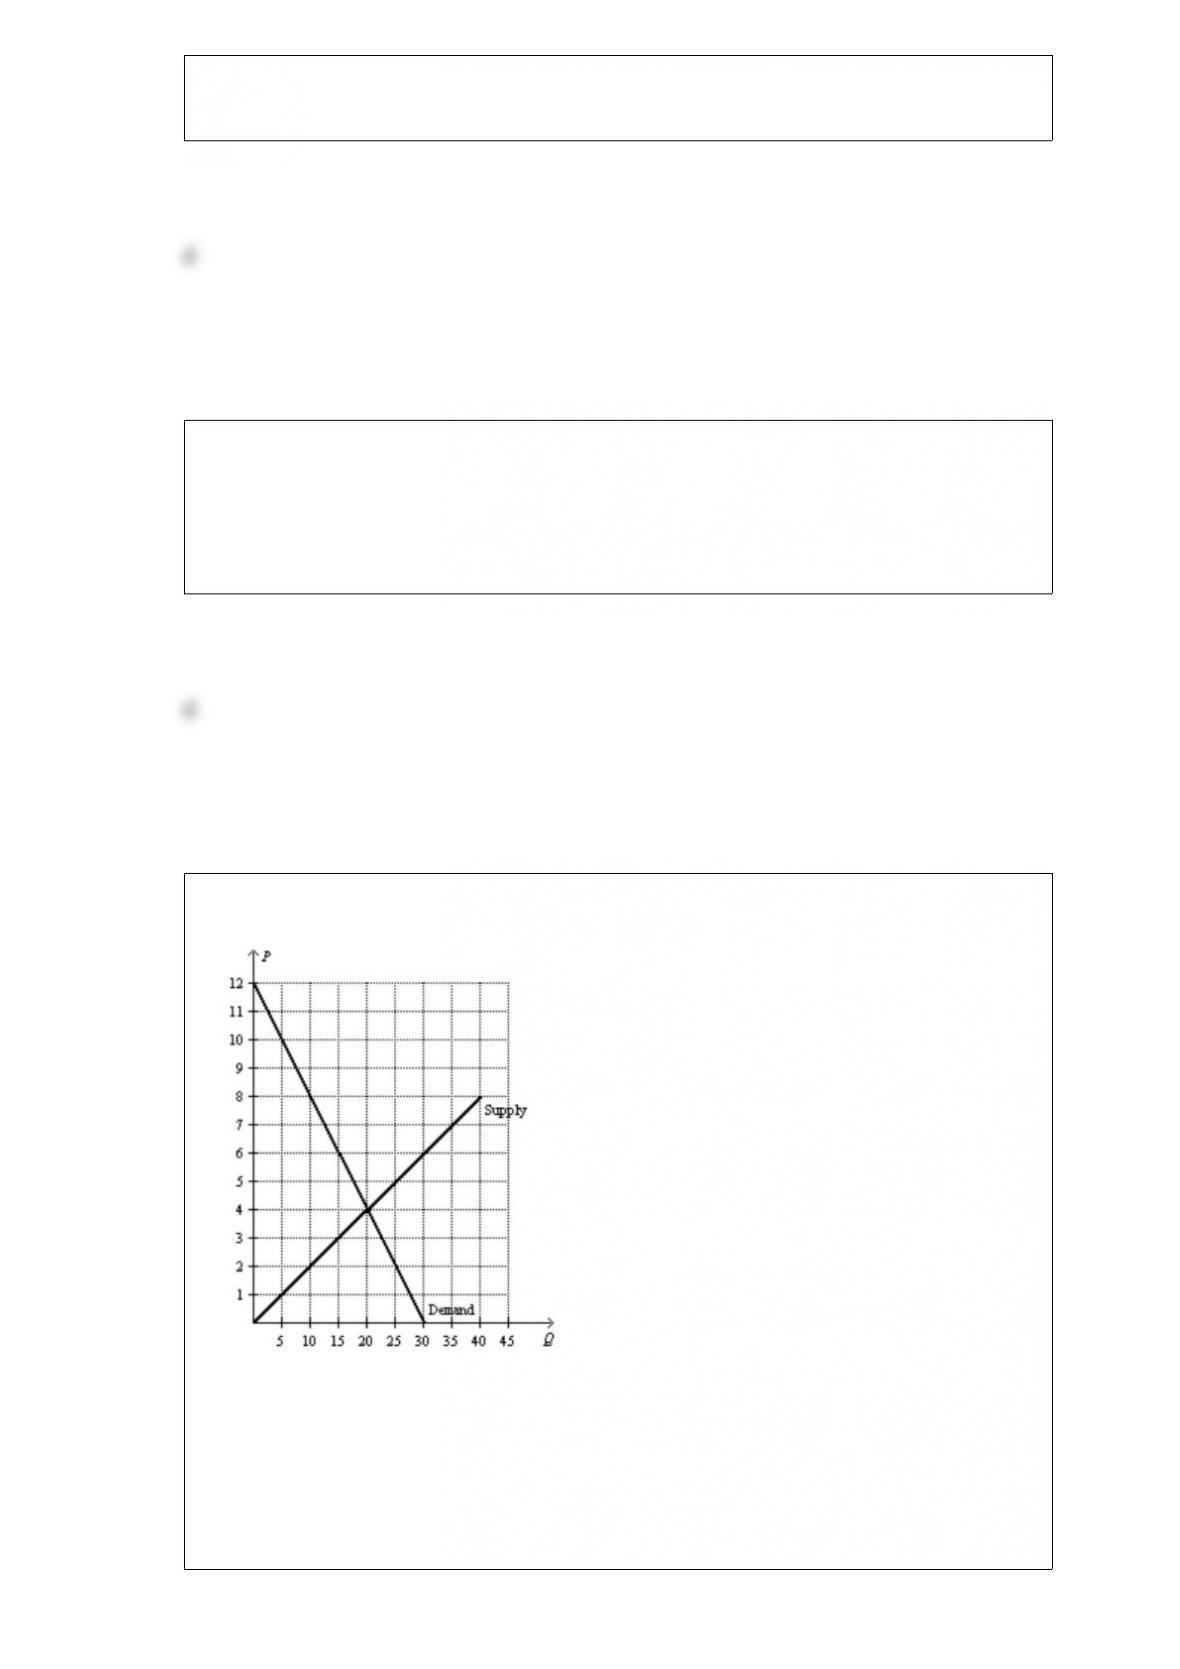
Figure 810
Refer to Figure 810. Suppose the government imposes a tax that reduces the quantity
sold in the market after the tax to Q2. Without the tax, the producer surplus is
a. (P50) x Q5.
b. 1/2 x (P50) x Q5.
c. (P80) x Q2.
d. 1/2 x (P80) x Q2.
For most students, the largest single cost of a college education is
a. the wages given up to attend school.
b. tuition, fees, and books.
c. room and board.
d. transportation, parking, and entertainment.
Scenario 54
Milk has an inelastic demand, and beef has an elastic demand. Suppose that a
mysterious increase in bovine infertility decreases both the population of dairy cows
and the population of beef cattle by 50 percent.
Refer to Scenario 54. The equilibrium price will
a. increase in both the milk and beef markets.
b. increase in the milk market and decrease in the beef market.
c. decrease in the milk market and increase in the beef market.
d. decrease in both the milk and beef markets.
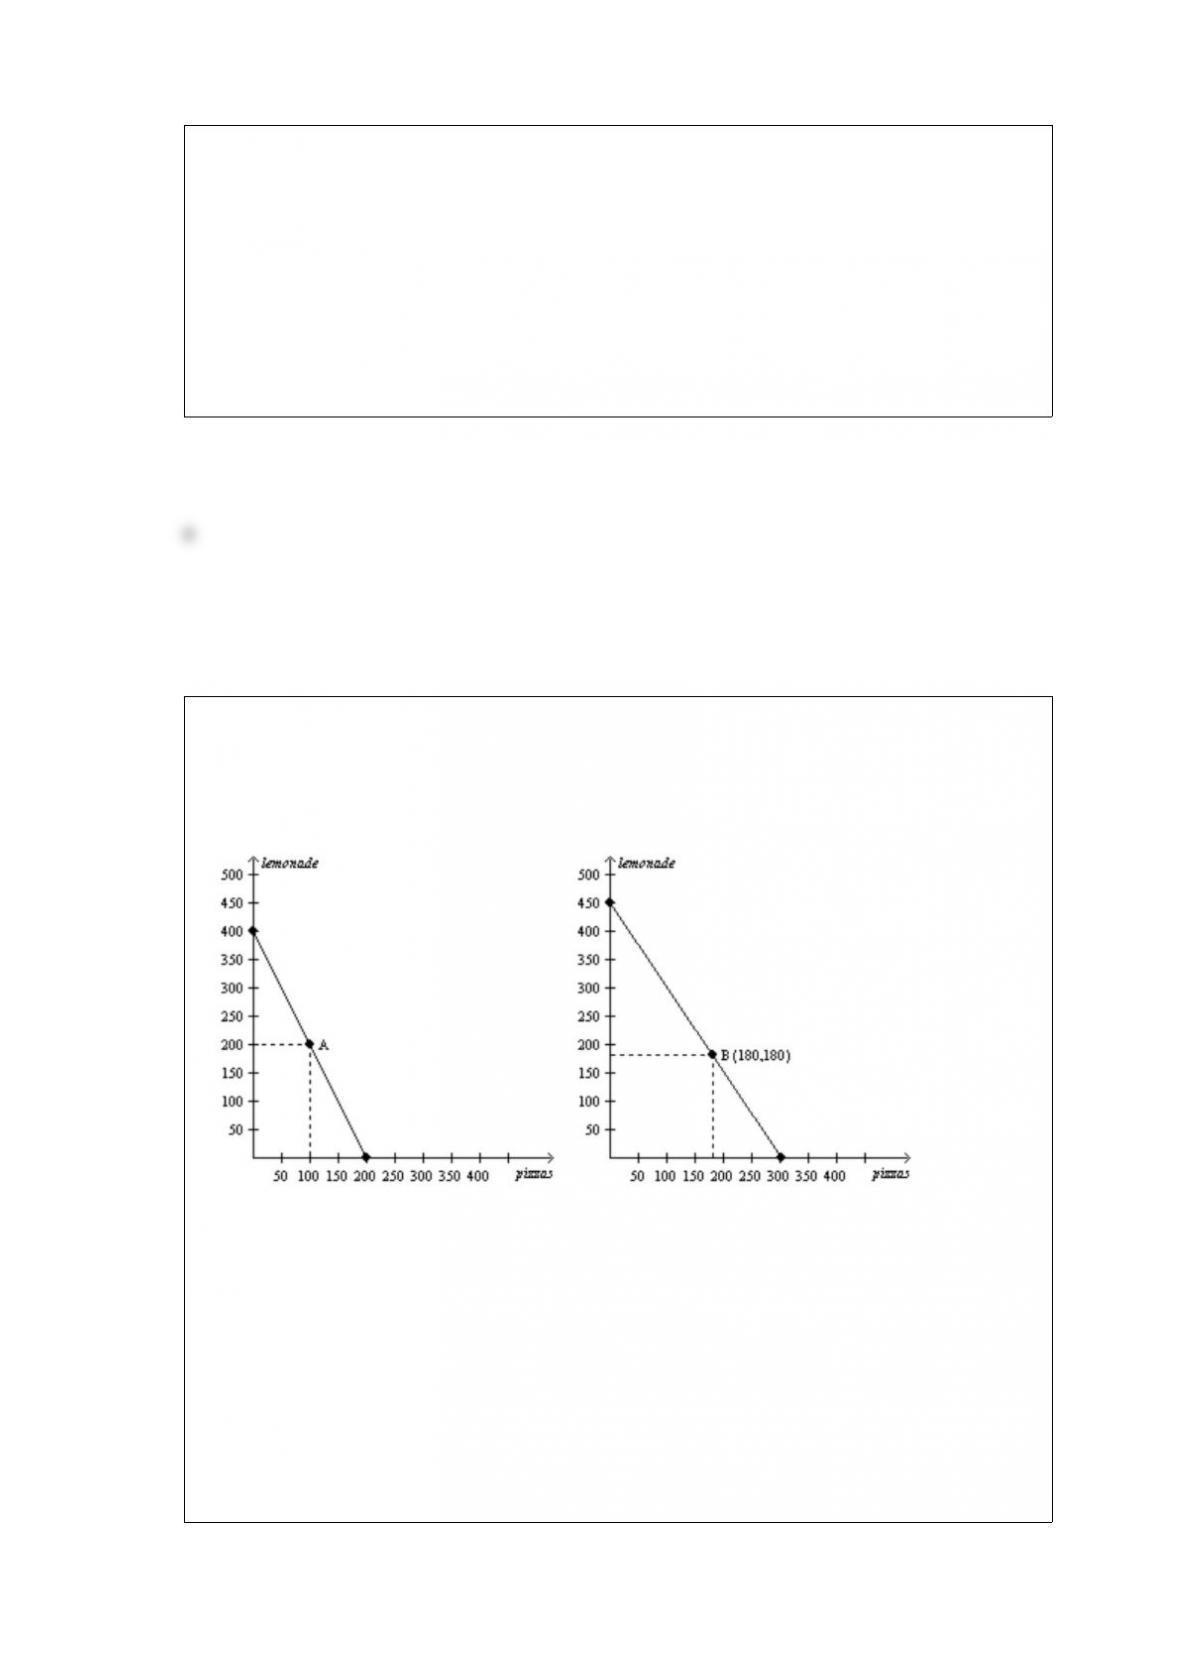
Figure 322
Alice and Betty’s Production Possibilities in one 8hour day.
Alice’s Production Possibilities FrontierBetty’s Production Possibilities Frontier
Refer to Figure 322. What are Alice and Betty’s opportunity costs of 1 pitcher of
lemonade?
a. Alice’s opportunity cost of 1 pitcher of lemonade is 1/2 of a pizza and Betty’s
opportunity cost of 1 pitcher of lemonade is 2/3 of a pizza.
b. Alice’s opportunity cost of 1 pitcher of lemonade is 2 pizzas and Betty’s opportunity
cost of 1 pitcher of lemonade is 1.5 pizzas.
c. Alice’s opportunity cost of 1 pitcher of lemonade is 10 pizzas and Betty’s opportunity
cost of 1 pitcher of lemonade is 10 pizzas.
d. Alice’s opportunity cost of 1 pitcher of lemonade is 200 pizzas and Betty’s
opportunity cost of 1 pitcher of lemonade is 300 pizzas.

Alfonso has noticed that increases in unemployment insurance claims are associated
with recessions, and therefore he advocates limits on unemployment insurance so as to
prevent recessions. Mary has noticed that most drug addicts once attended schools, and
therefore she advocates getting rid of schools so as to prevent drug addiction.
a. The reasoning of both Alfonso and Mary suffers from the omitted variable problem.
b. The reasoning of both Alfonso and Mary suffers from the reverse causality problem.
c. Alfonso’s reasoning suffers from the reverse causality problem, and Mary’s reasoning
suffers from the omitted variable problem.
d. Mary’s reasoning suffers from the reverse causality problem, and Alfonso’s reasoning
suffers from the omitted variable problem.
If the price elasticity of demand for a good is 0.8, then a 12 percent increase in the
quantity demanded must be the result of
a. a 0.06 percent decrease in the price.
b. a 1.5 percent decrease in the price.
c. a 9.6 percent decrease in the price.
d. a 15 percent decrease in the price.
Which of the following changes would not shift the supply curve for a good or service?
a. a change in production technology
b. a change in the price of the good or service
c. a change in expectations about the future price of the good or service
d. a change in input prices

Table 326
Assume that Japan and Korea can switch between producing cars and producing
airplanes at a constant rate.
Hours Needed to Make 1Quantity Produced in 2400 Hours
CarAirplaneCarsAirplanes
Japan301508016
Korea501504816
Refer to Table 326. Suppose Korea decides to increase its production of cars by 18.
What is the opportunity cost of this decision?
a. 3 airplanes
b. 6 airplanes
c. 16 airplanes
d. 150 airplanes
Table 38
Assume that England and Spain can switch between producing cheese and producing
bread at a constant rate.
Labor Hours Needed to Make 1 Unit ofNumber of Units Produced in 24 Hours
CheeseBreadCheeseBread
England23128
Spain3684
Refer to Table 38. We could use the information in the table to draw a production
possibilities frontier for England and a second production possibilities frontier for
Spain. If we were to do this, measuring bread along the horizontal axis, then
a. the slope of England’s production possibilities frontier would be 0.67 and the slope of
Spain’s production possibilities frontier would be 0.5.
b. the slope of England’s production possibilities frontier would be 1.5 and the slope of
Spain’s production possibilities frontier would be 2.
c. the slope of England’s production possibilities frontier would be .75 and the slope of
Spain’s production possibilities frontier would be 1.
d. the slope of England’s production possibilities frontier would be 2 and the slope of
Spain’s production possibilities frontier would be .5.
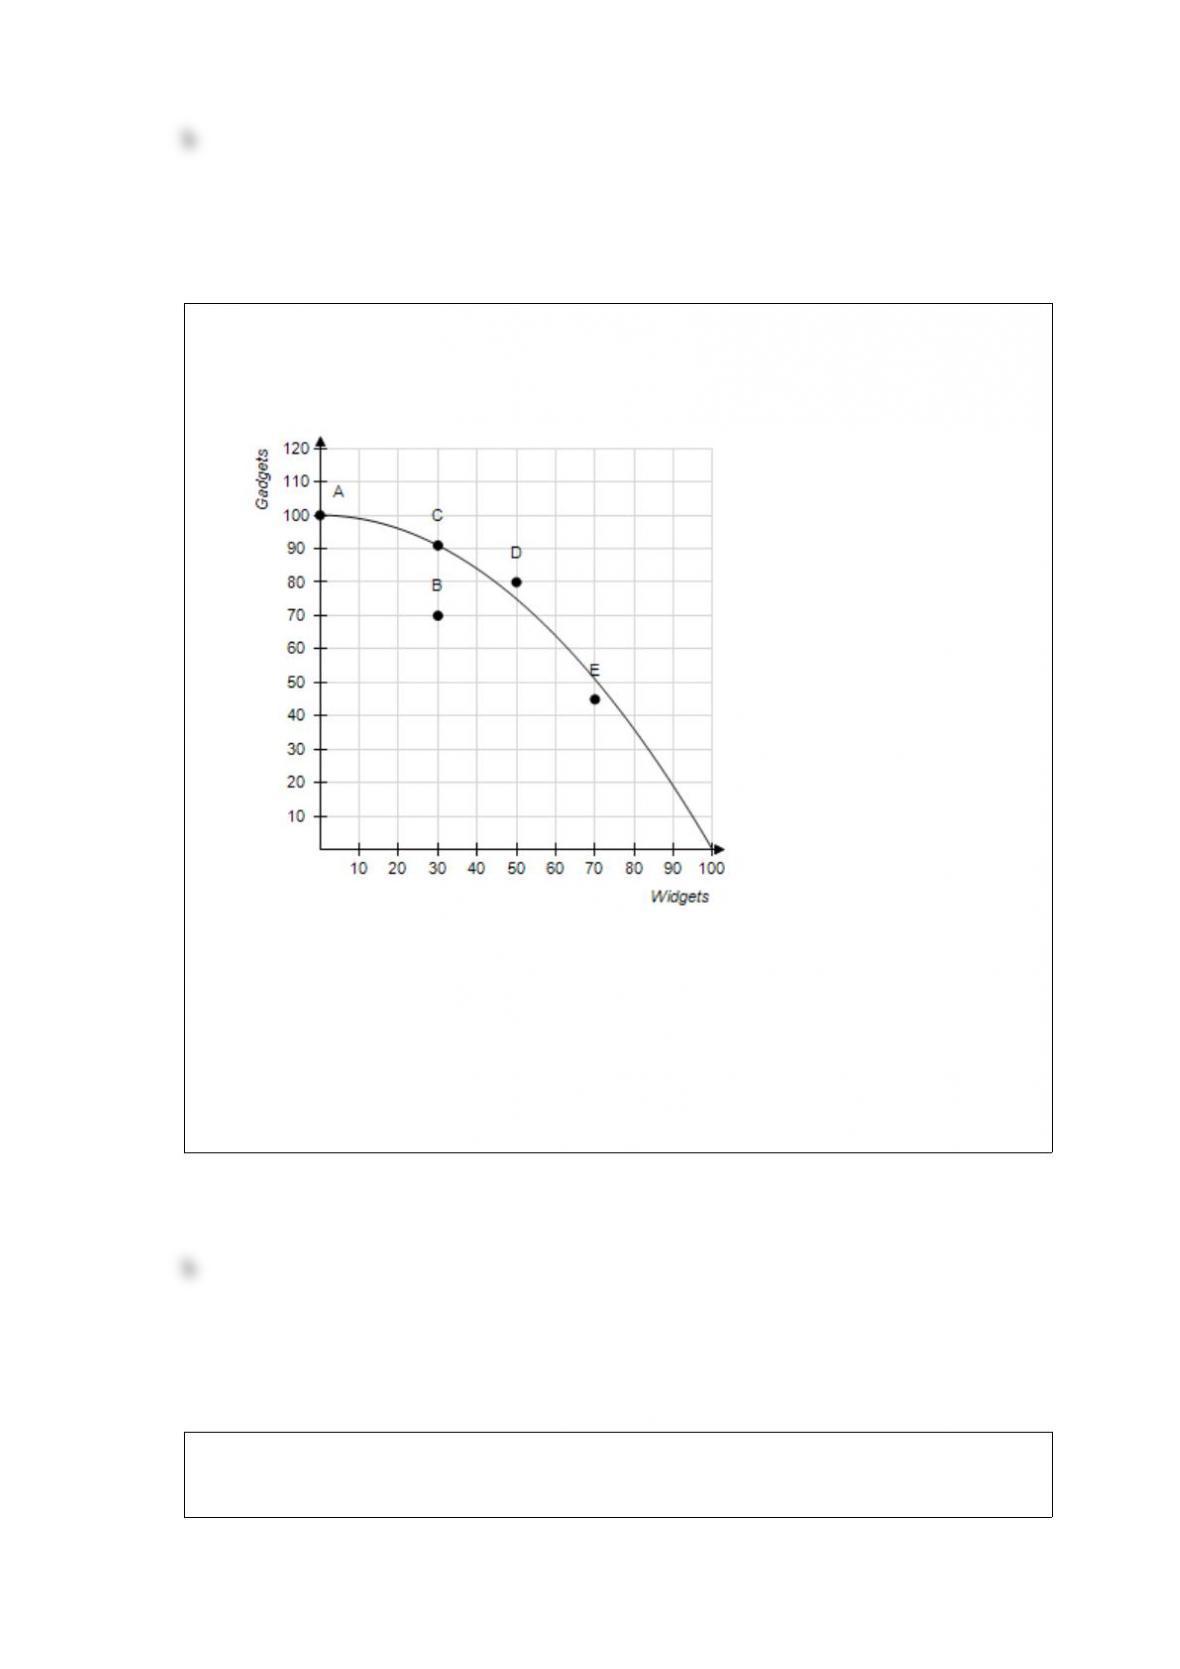
Figure 216
Refer to Figure 216. The opportunity cost of obtaining approximately 10 additional
gadgets by moving from point C to point A is
a. 10 gadgets.
b. 30 widgets
c. 10 gadgets and 30 widgets.
d. 0 gadgets.
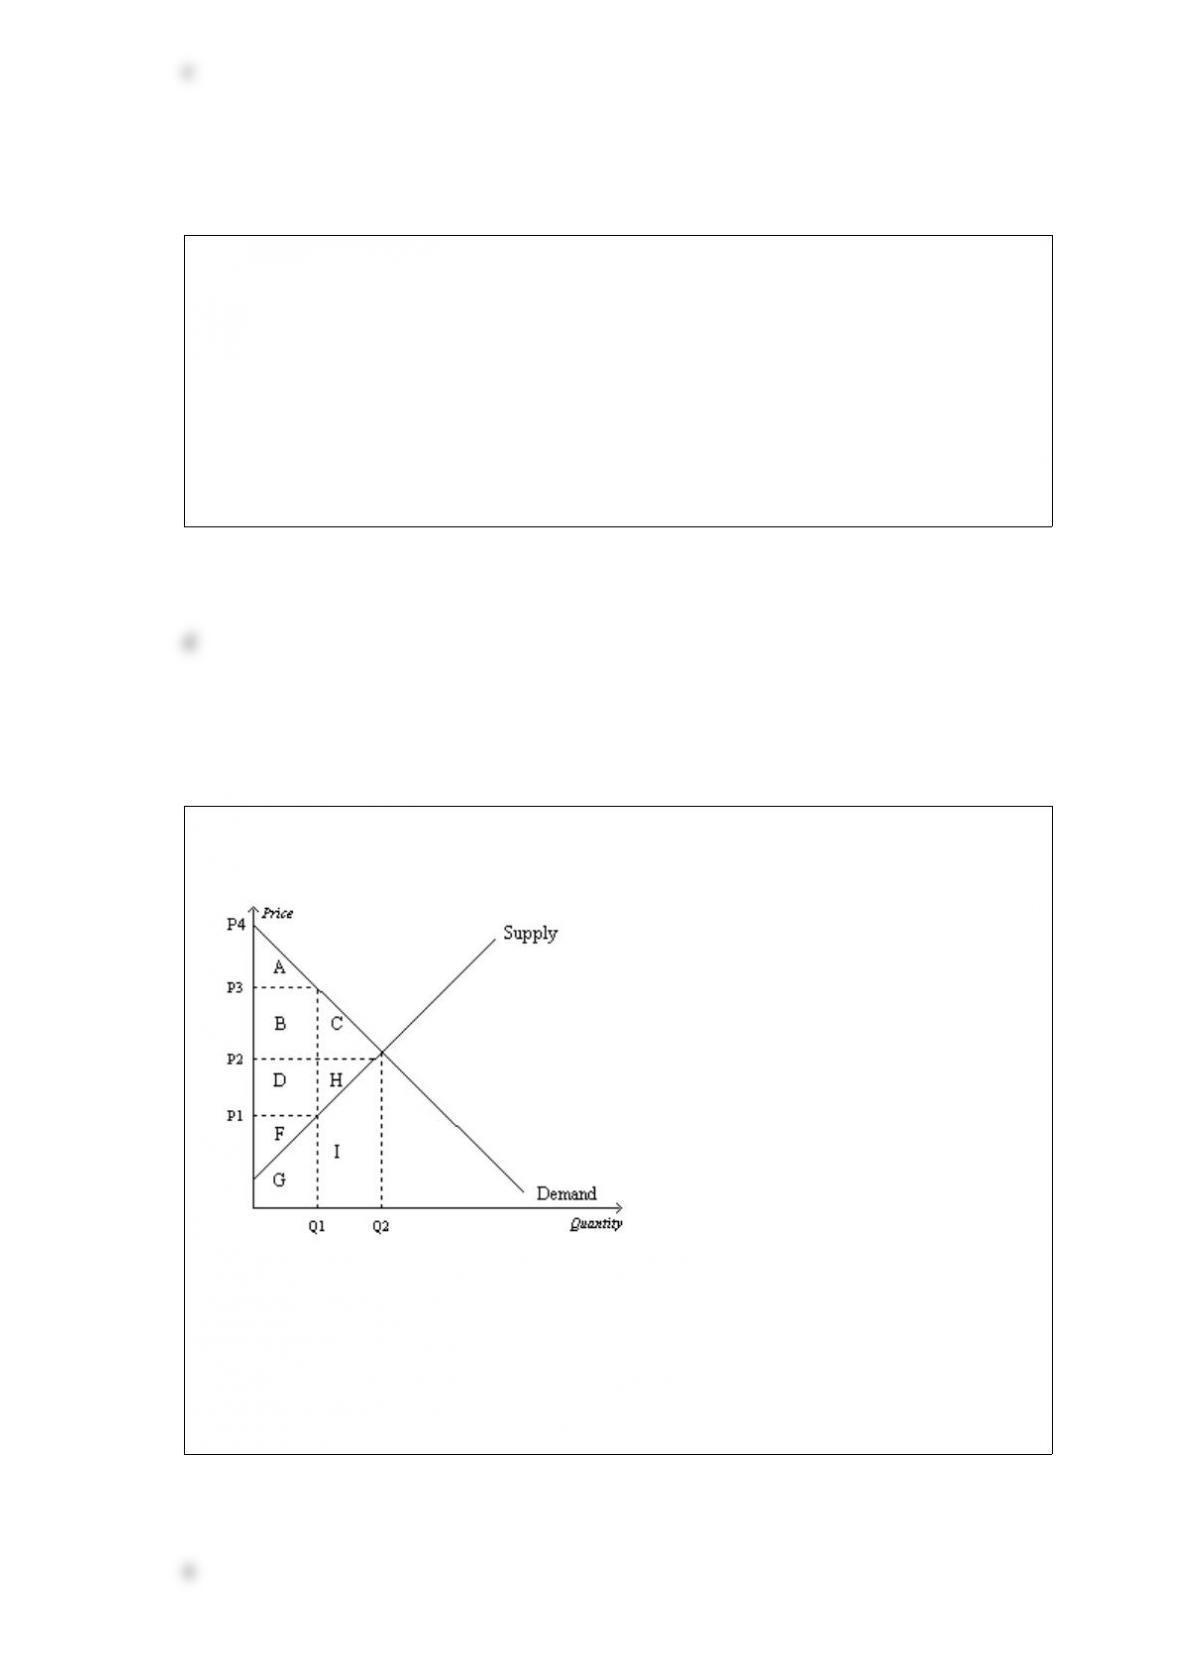
Figure 85
Suppose that the government imposes a tax of P3 P1.
Refer to Figure 85. The benefit to the government is measured by
a. tax revenue and is represented by area A+B.
b. tax revenue and is represented by area B+D.
c. the net gain in total surplus and is represented by area B+D.
d. the net gain in total surplus and is represented by area C+H.
Table 75
For each of three potential buyers of oranges, the table displays the willingness to pay
for the first three oranges of the day. Assume Allison, Bob, and Charisse are the only
three buyers of oranges, and only three oranges can be supplied per day.
First OrangeSecond OrangeThird Orange
Allison$2.00$1.50$0.75
Bob$1.50$1.00$0.60
Charisse$0.75$0.25$0
Refer to Table 75. If the market price of an orange increases from $0.70 to $1.40, then
consumer surplus
a. increases by $2.60.
b. decreases by $0.70.
c. decreases by $2.50.
d. decreases by $2.60.
Inefficiency exists in an economy when a good is
a. being produced with less than all available resources.
b. not distributed fairly among buyers.
c. not being produced by the lowestcost producers.
d. being consumed by buyers who value it most highly.
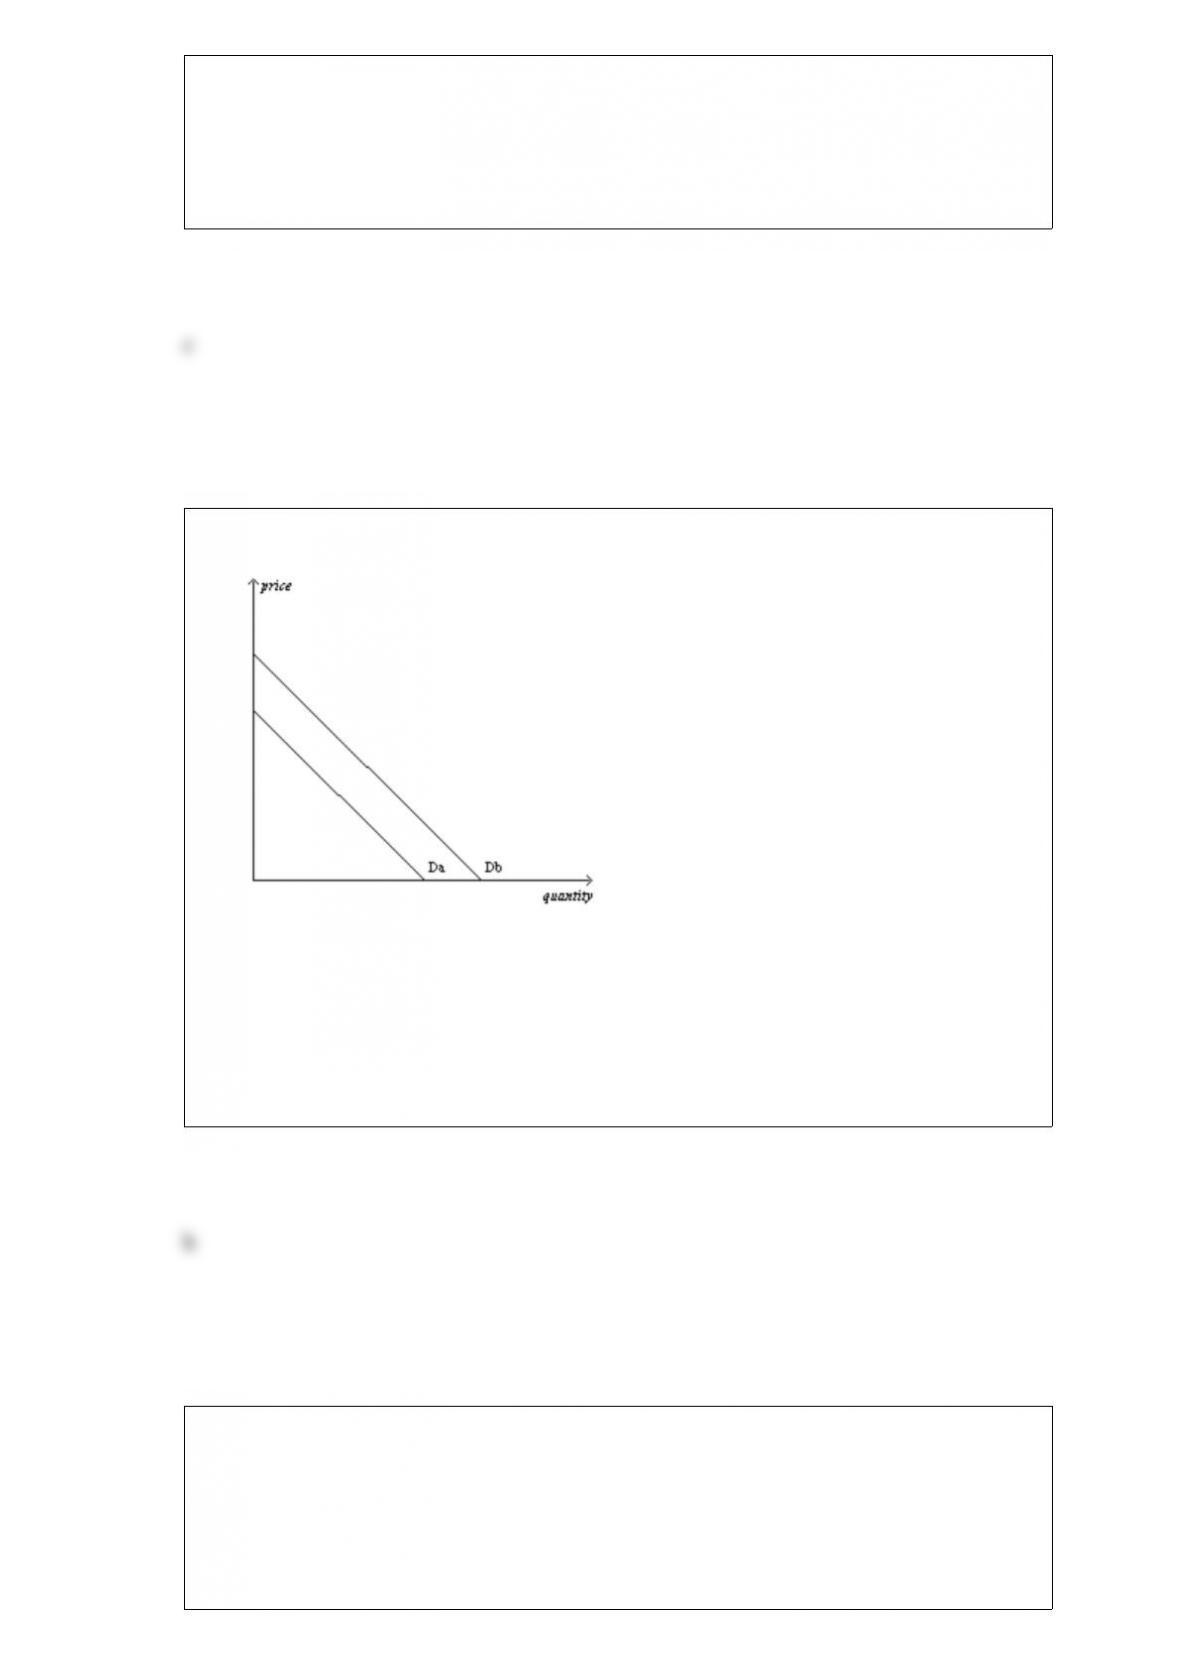
Figure 47
Refer to Figure 47. The movement from Db to Da in the market for potato chips could
be caused by a(n)
a. decrease in the price of potato chips.
b. decrease in income, assuming that potato chips are a normal good.
c. announcement by the FDA that potato chips lower cholesterol.
d. increase in the price of a pretzels.
Suppose a tax of $1 per unit is imposed on a good. The more elastic the demand for the
good, other things equal,
a. the larger is the decrease in quantity demanded as a result of the tax.
b. the smaller is the tax burden on buyers relative to the tax burden on sellers.
c. the larger is the deadweight loss of the tax.
d. All of the above are correct.
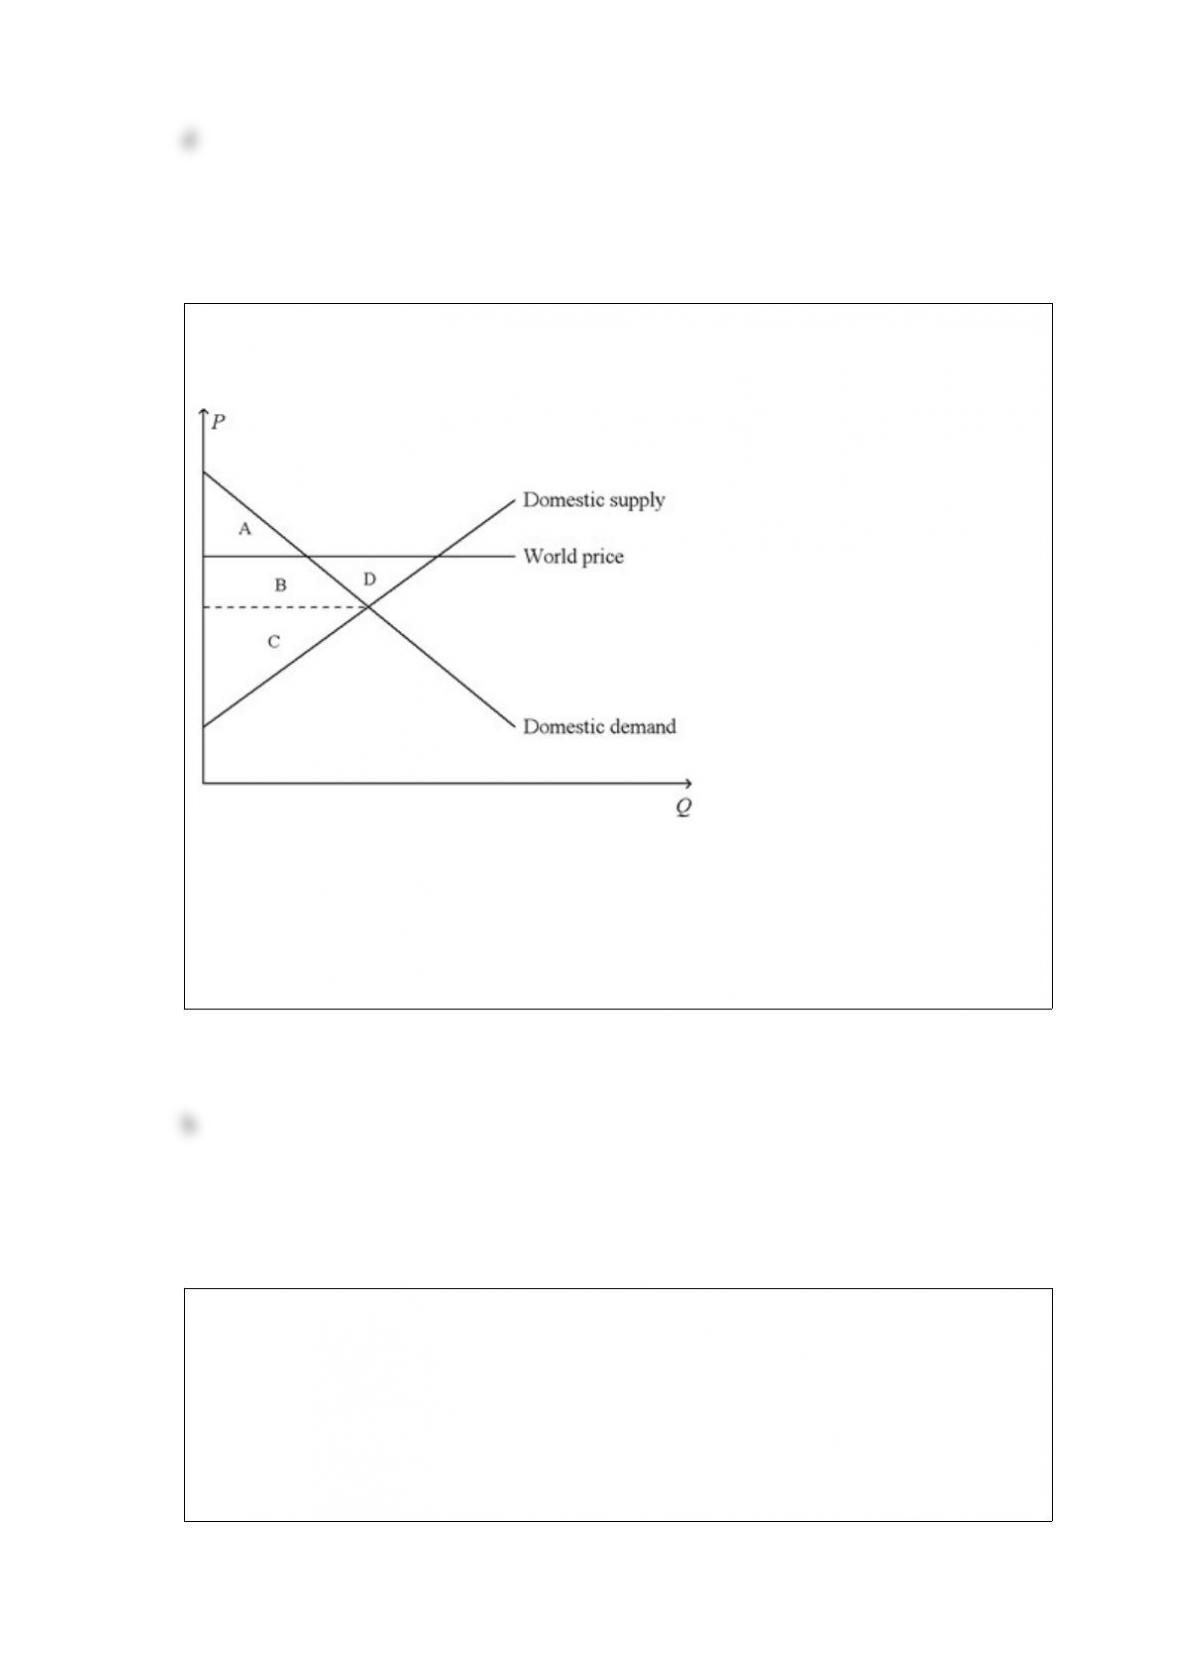
Figure 914. On the diagram below, Q represents the quantity of crude oil and P
represents the price of crude oil.
Refer to Figure 914. When the country for which the figure is drawn allows
international trade in crude oil,
a. consumer surplus changes from the area A + B + D to the area A.
b. producer surplus changes from the area C to the area B + C + D.
c. total surplus decreases by the area D.
d. All of the above are correct.
Suppose the government taxes the wealthy at a higher rate than it taxes the poor and
then develops programs to redistribute the tax revenue from the wealthy to the poor.
This redistribution of wealth
a. is more efficient and more equal for society.
b. is more efficient but less equal for society.
c. is more equal but less efficient for society.
d. is less equal and less efficient for society.
John Maynard Keynes described economics as an easy subject at which very few excel.
Which of the following is not one of the reasons Keynes gave for why so few people
excel at the study of economics?
a. An economist must also be a mathematician, historian, statesman, and philosopher in
some degree.
b. An economist must understand symbols and speak in words.
c. An economist must be purposeful and disinterested in a simultaneous mood.
d. An economist must understand environmental science, regulation, and political
science.
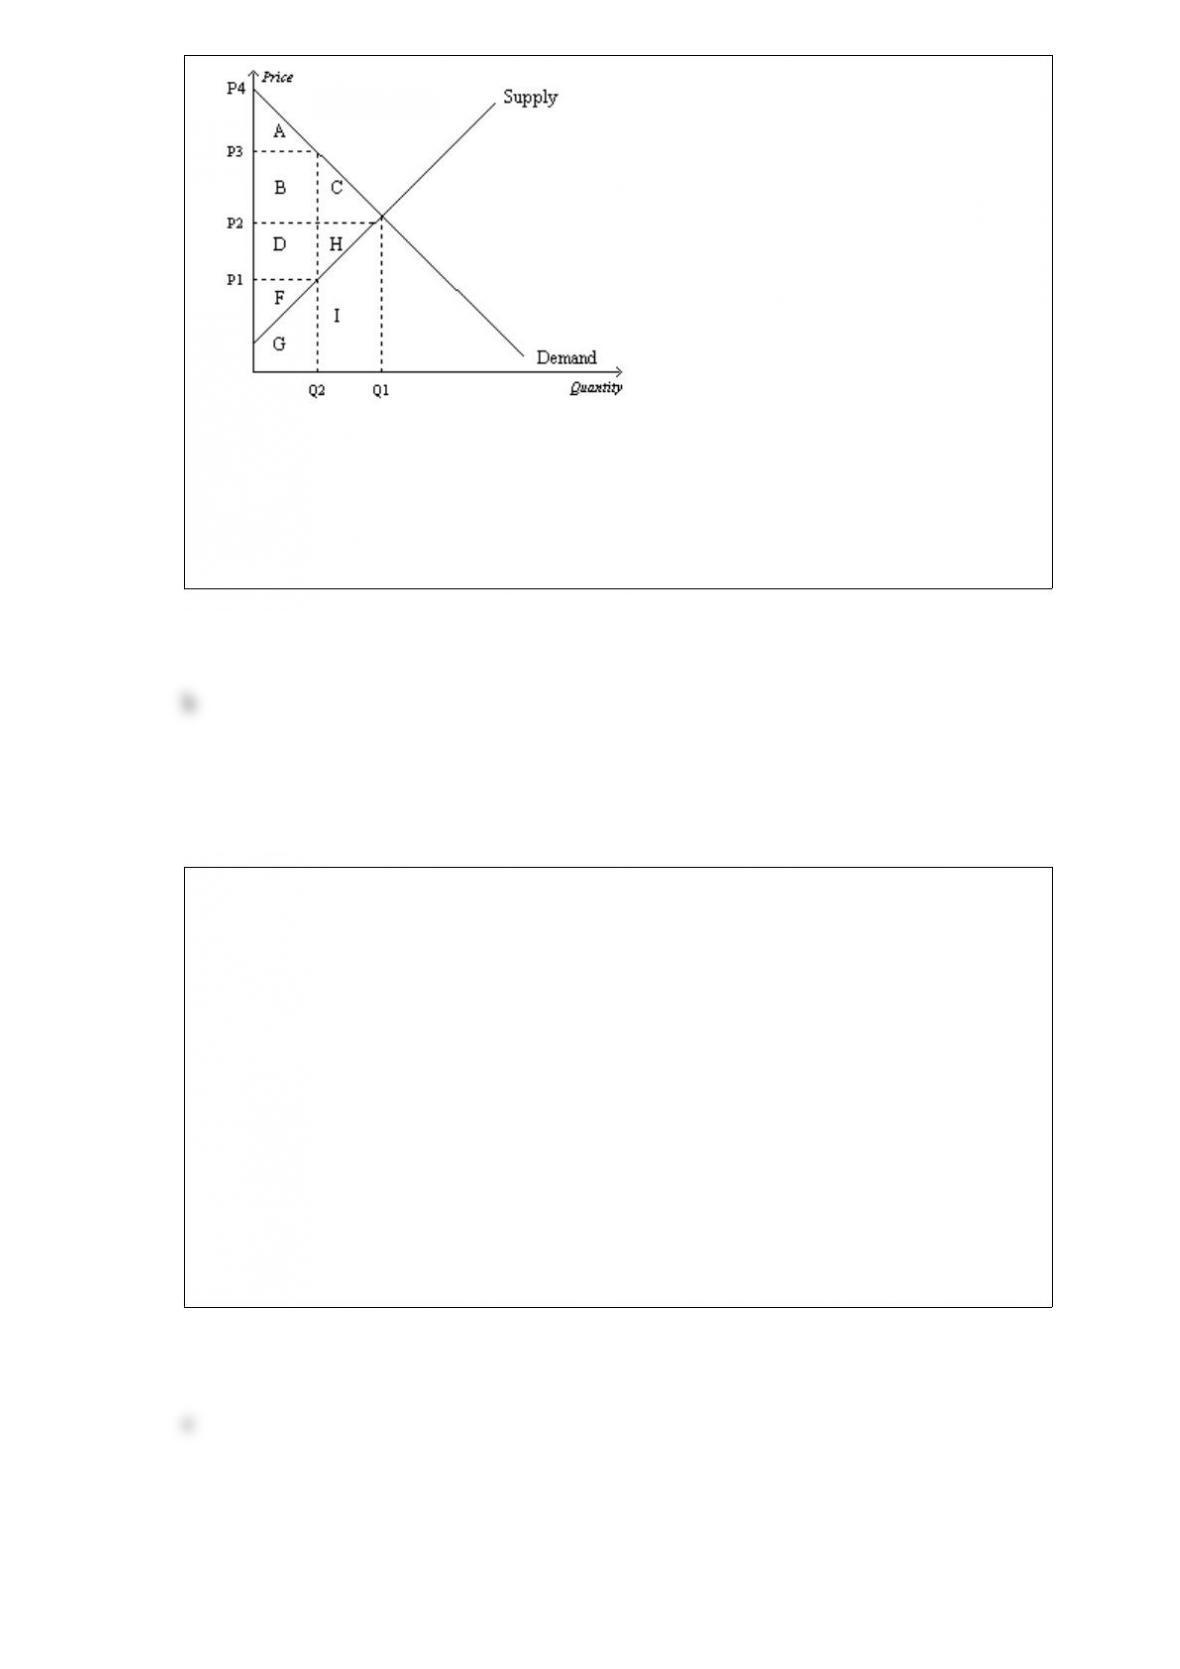
Figure 723
Refer to Figure 723. If the price were P1, producer surplus would be represented by
the area
a. F.
b. F+G.
c. D+H+F.
d. D+H+F+G+I.
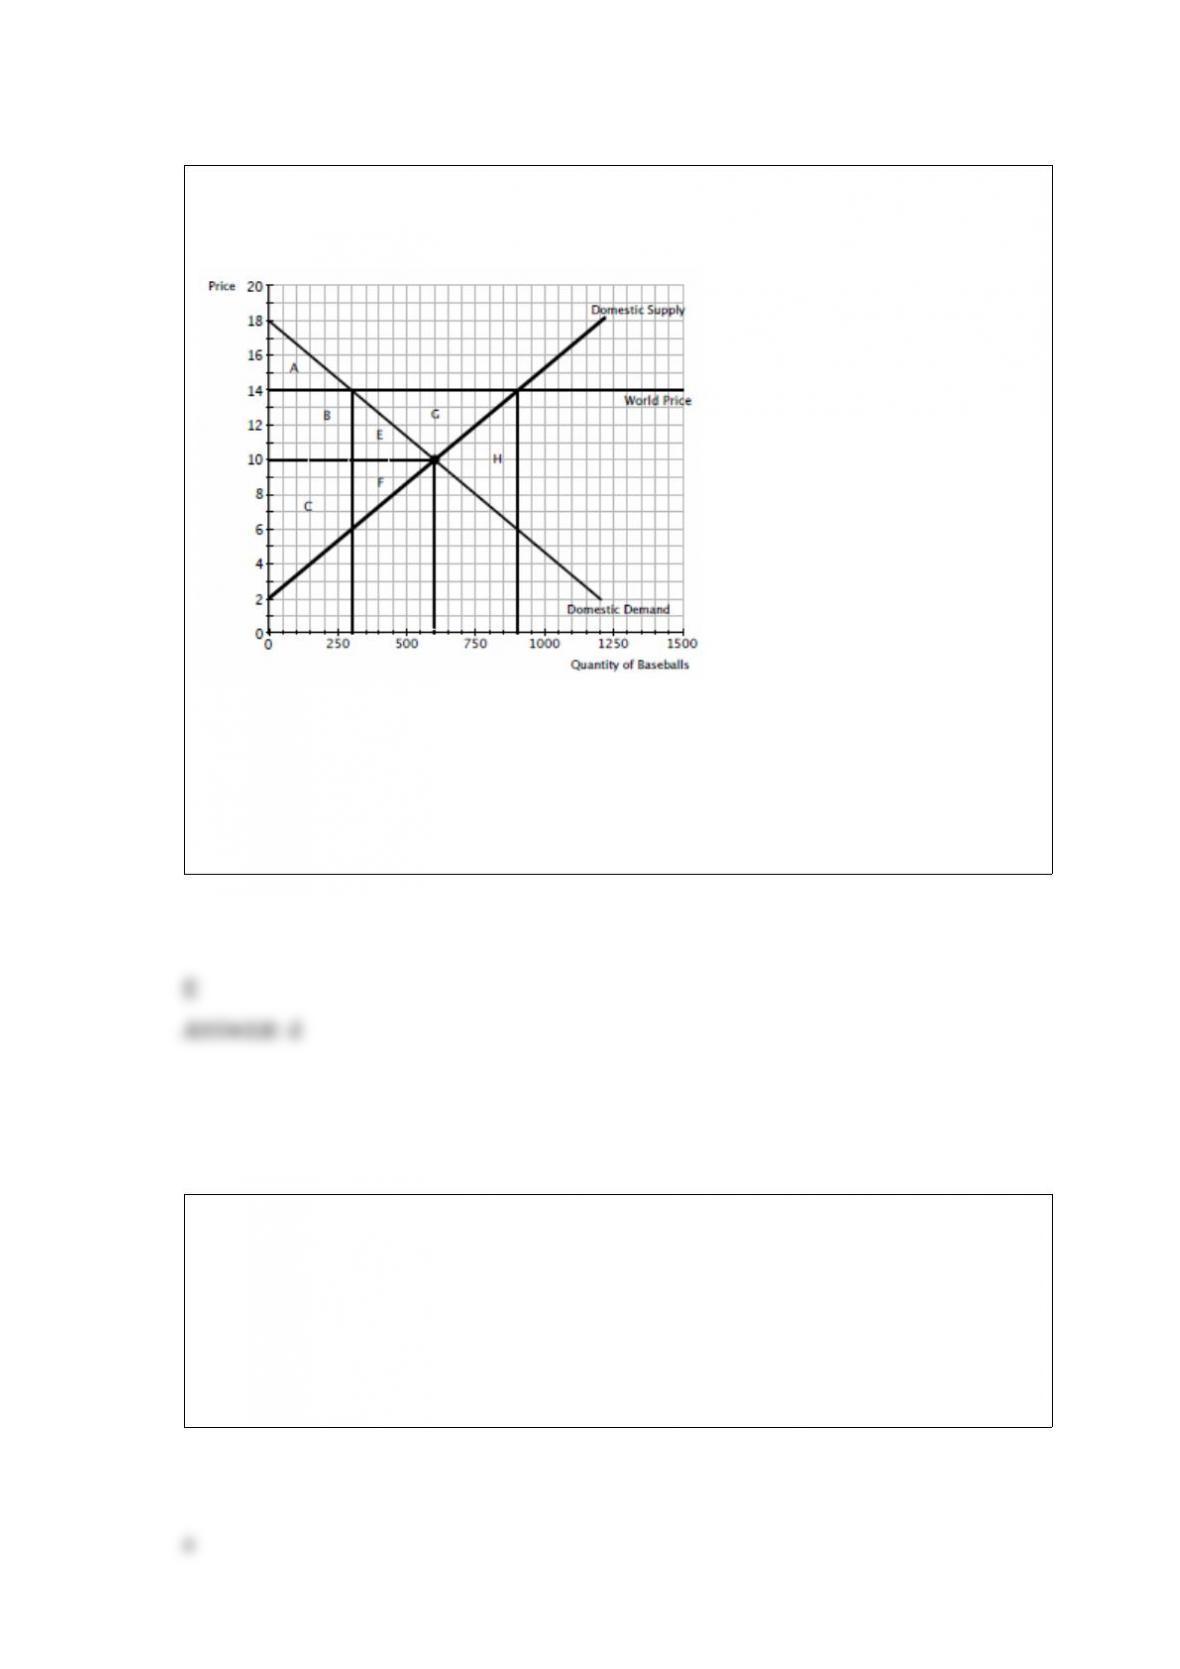
Figure 926
The diagram below illustrates the market for baseballs in the U.S.
Refer to Figure 926. As a result of opening up the baseball market to international
trade, the U.S. willHTMLENTITY#8203HTMLENTITY
a. HTMLENTITY#8203HTMLENTITYimport 600 baseballs.
b. HTMLENTITY#8203HTMLENTITYexport 300 baseballs.
c. HTMLENTITY#8203HTMLENTITYimport 400 baseballs.
d. HTMLENTITY#8203HTMLENTITYexport 600 baseballs.
If the price of walnuts rises, many people would switch from consuming walnuts to
consuming pecans. But if the price of salt rises, people would have difficulty
purchasing something to use in its place. These examples illustrate the importance of
a. the availability of close substitutes in determining the price elasticity of demand.
b. a necessity versus a luxury in determining the price elasticity of demand.
c. the definition of a market in determining the price elasticity of demand.
d. the time horizon in determining the price elasticity of demand.

The Laffer curve relates
a. the tax rate to tax revenue raised by the tax.
b. the tax rate to the deadweight loss of the tax.
c. the price elasticity of supply to the deadweight loss of the tax.
d. government welfare payments to the birth rate.
Consumer surplus
a. is the amount a buyer pays for a good minus the amount the buyer is willing to pay
for it.
b. is represented on a supplydemand graph by the area below the price and above the
demand curve.
c. measures the benefit sellers receive from participating in a market.
d. measures the benefit buyers receive from participating in a market.
Assume, for England, that the domestic price of wine without international trade is
higher than the world price of wine. This suggests that, in the production of wine,
a. England has a comparative advantage over other countries and England will export
wine.
b. England has a comparative advantage over other countries and England will import
wine.
c. other countries have a comparative advantage over England and England will export
wine.
d. other countries have a comparative advantage over England and England will import
wine.

Suppose the crossprice elasticity of demand between peanut butter and jelly is 2.50.
This implies that a 20 percent increase in the price of peanut butter will cause the
quantity of jelly purchased to
a. fall by 8 percent.
b. fall by 50 percent.
c. rise by 8 percent.
d. rise by 50 percent.
The signals that guide the allocation of resources in a market economy are
a. surpluses and shortages.
b. quantities.
c. government policies.
d. prices.