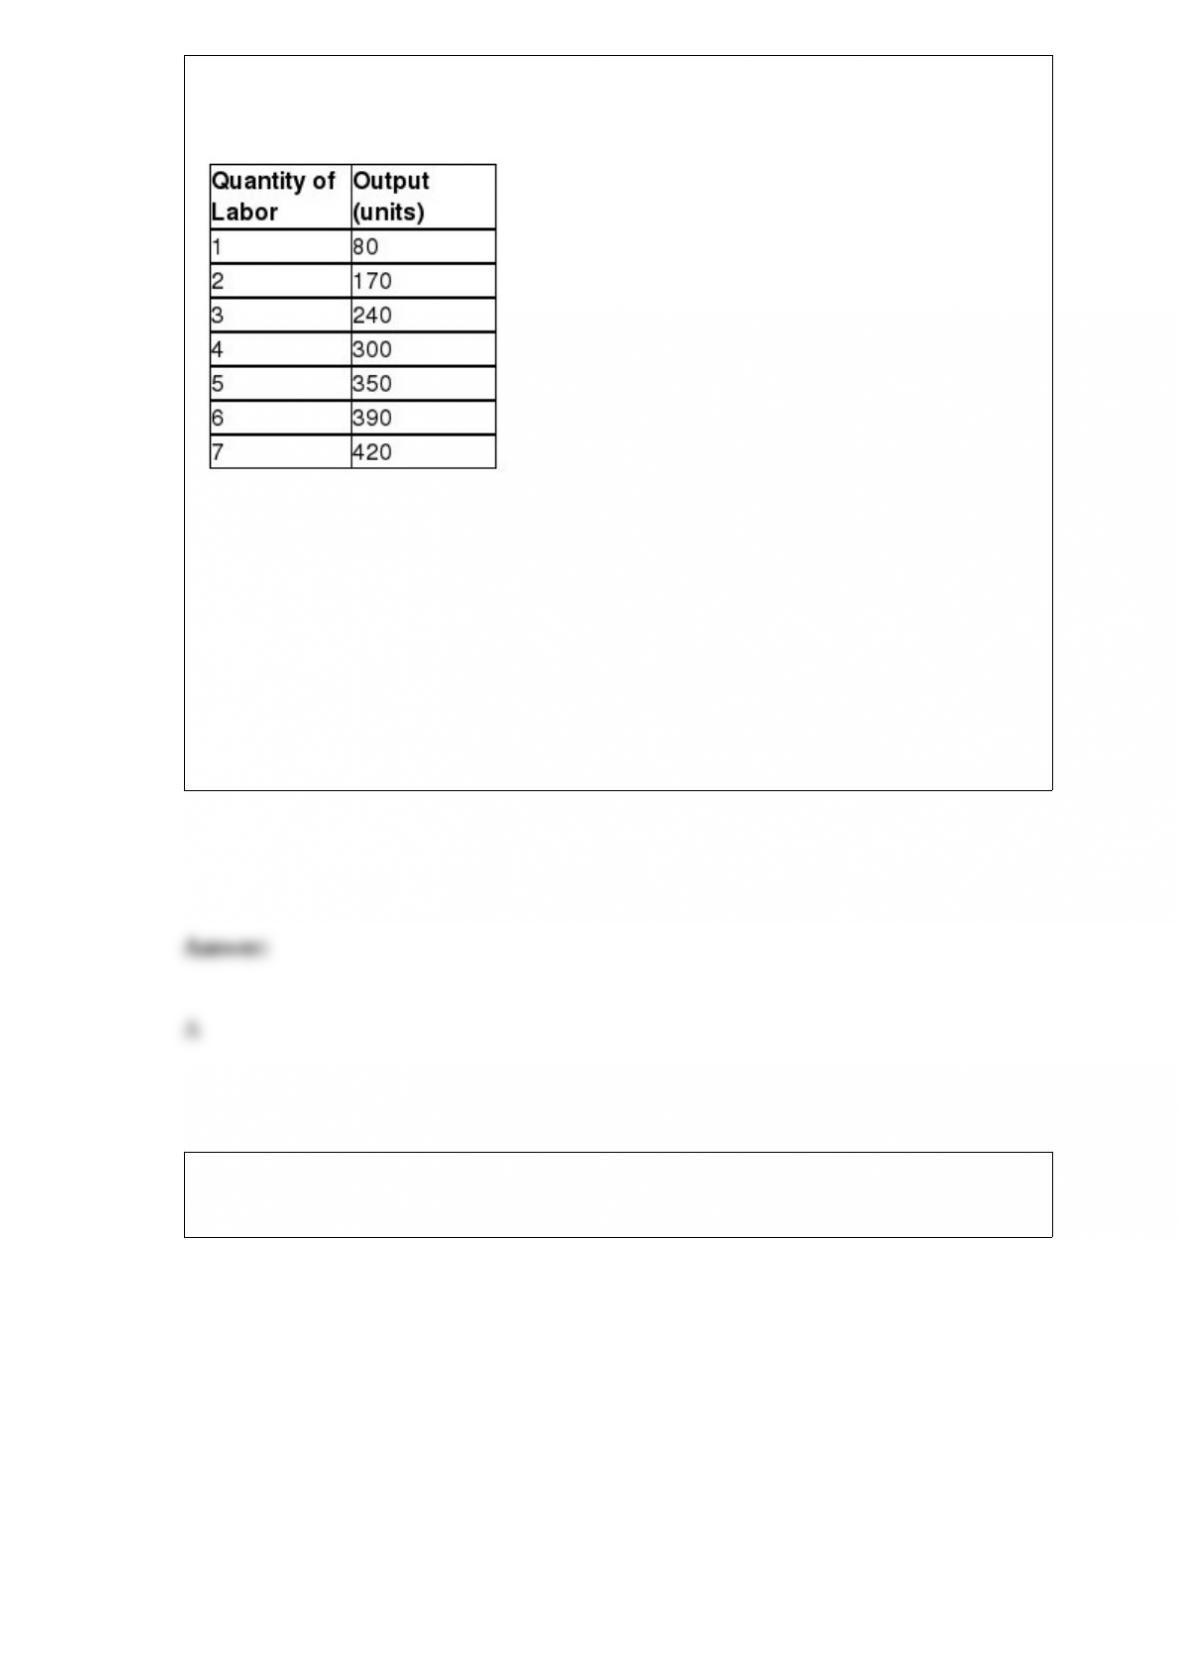
Table 17-1
Refer to Table 17-1. Suppose the output price is $3. If the wage rate is $90, what is the
profit-maximizing quantity of labor that the firm should hire?
A) 7 units
B) 5 units
C) 4 units
D) 3 units
Figure 12-11
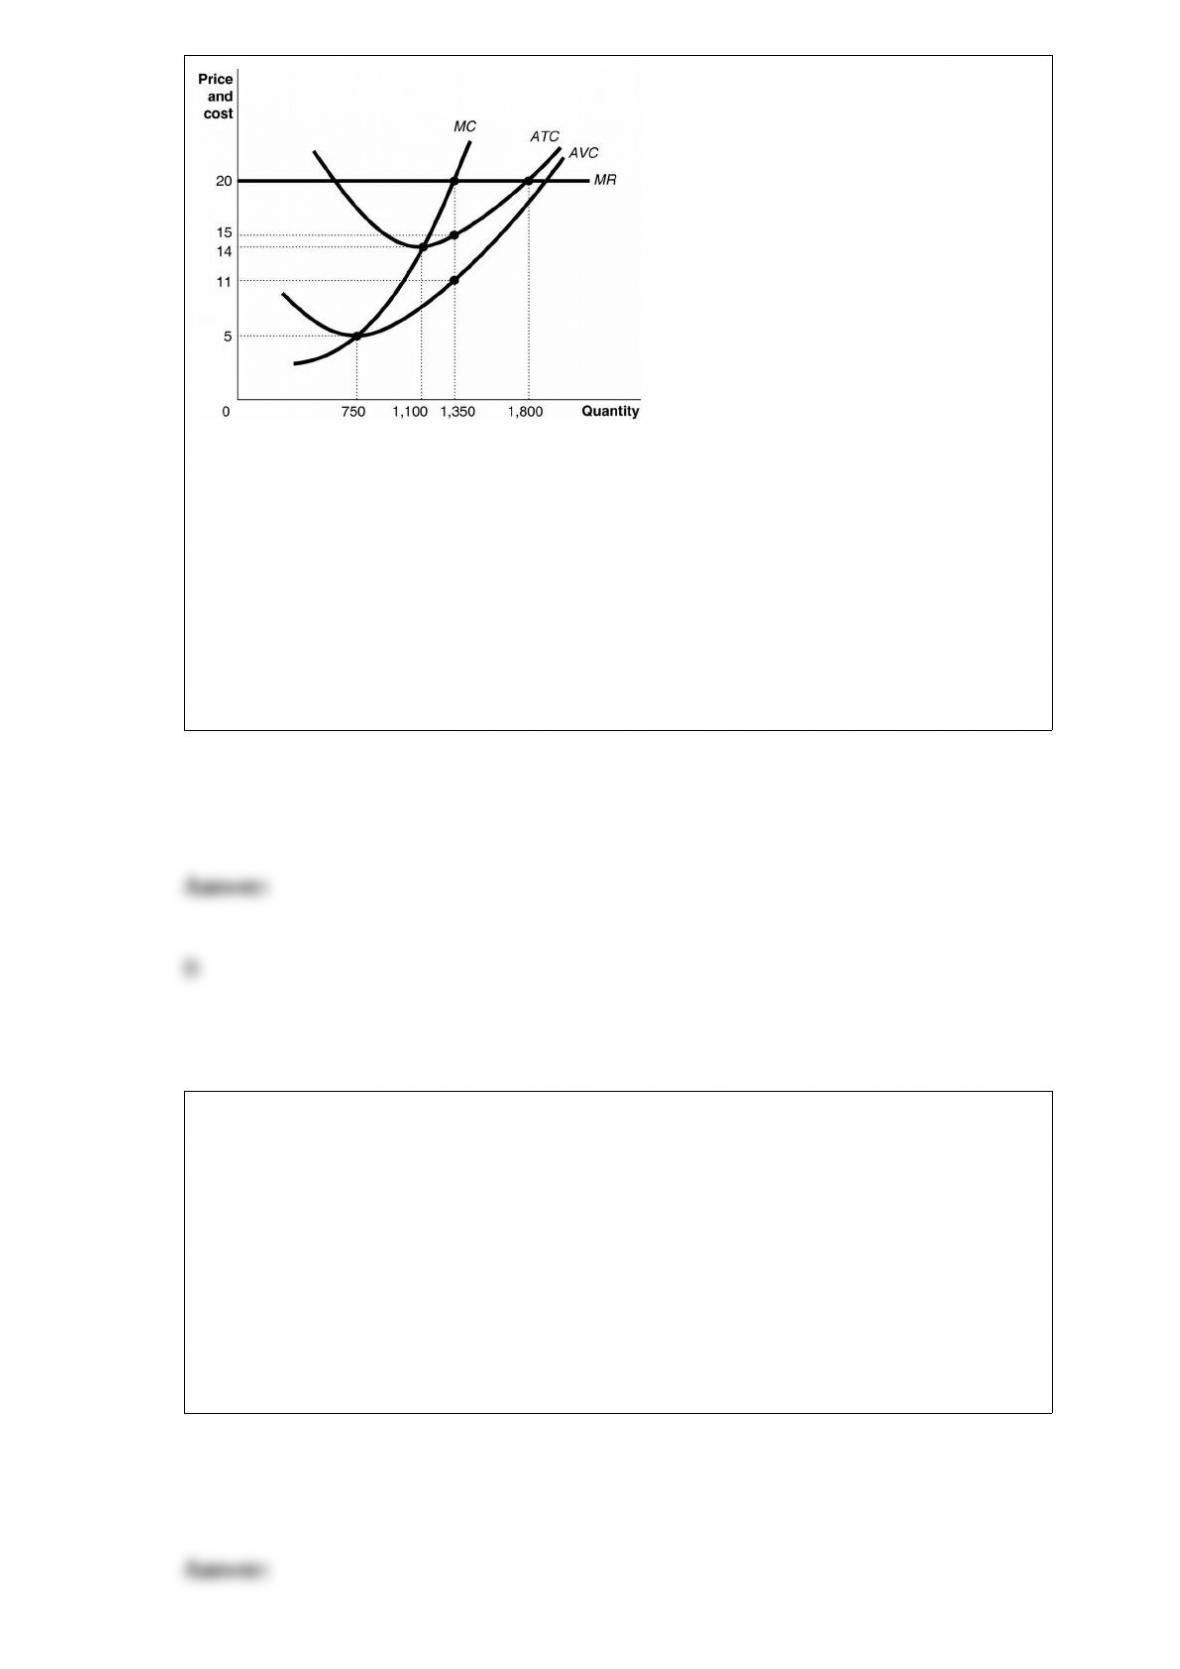
Refer to Figure 12-11. If this is a constant-cost industry, what is the market price in the
long-run equilibrium?
A) $5
B) $14
C) $15
D) $20
China has developed a comparative advantage in the production of clothing. The source
of this comparative advantage is
A) a large supply of natural resources.
B) a large supply of unskilled workers and relatively little capital.
C) investment in capital used to produce clothing.
D) superior process technology.
Jenna runs a small boutique in Capitola. She tells one of her suppliers that she is willing
to pay $6 for a pair of wool hand warmers and not a dime more. On the basis of this
information, what can you conclude about her price elasticity of demand for wool hand
warmers?
A) It is elastic.
B) It is perfectly elastic.
C) It is perfectly inelastic.
D) The price elasticity coefficient is 0.
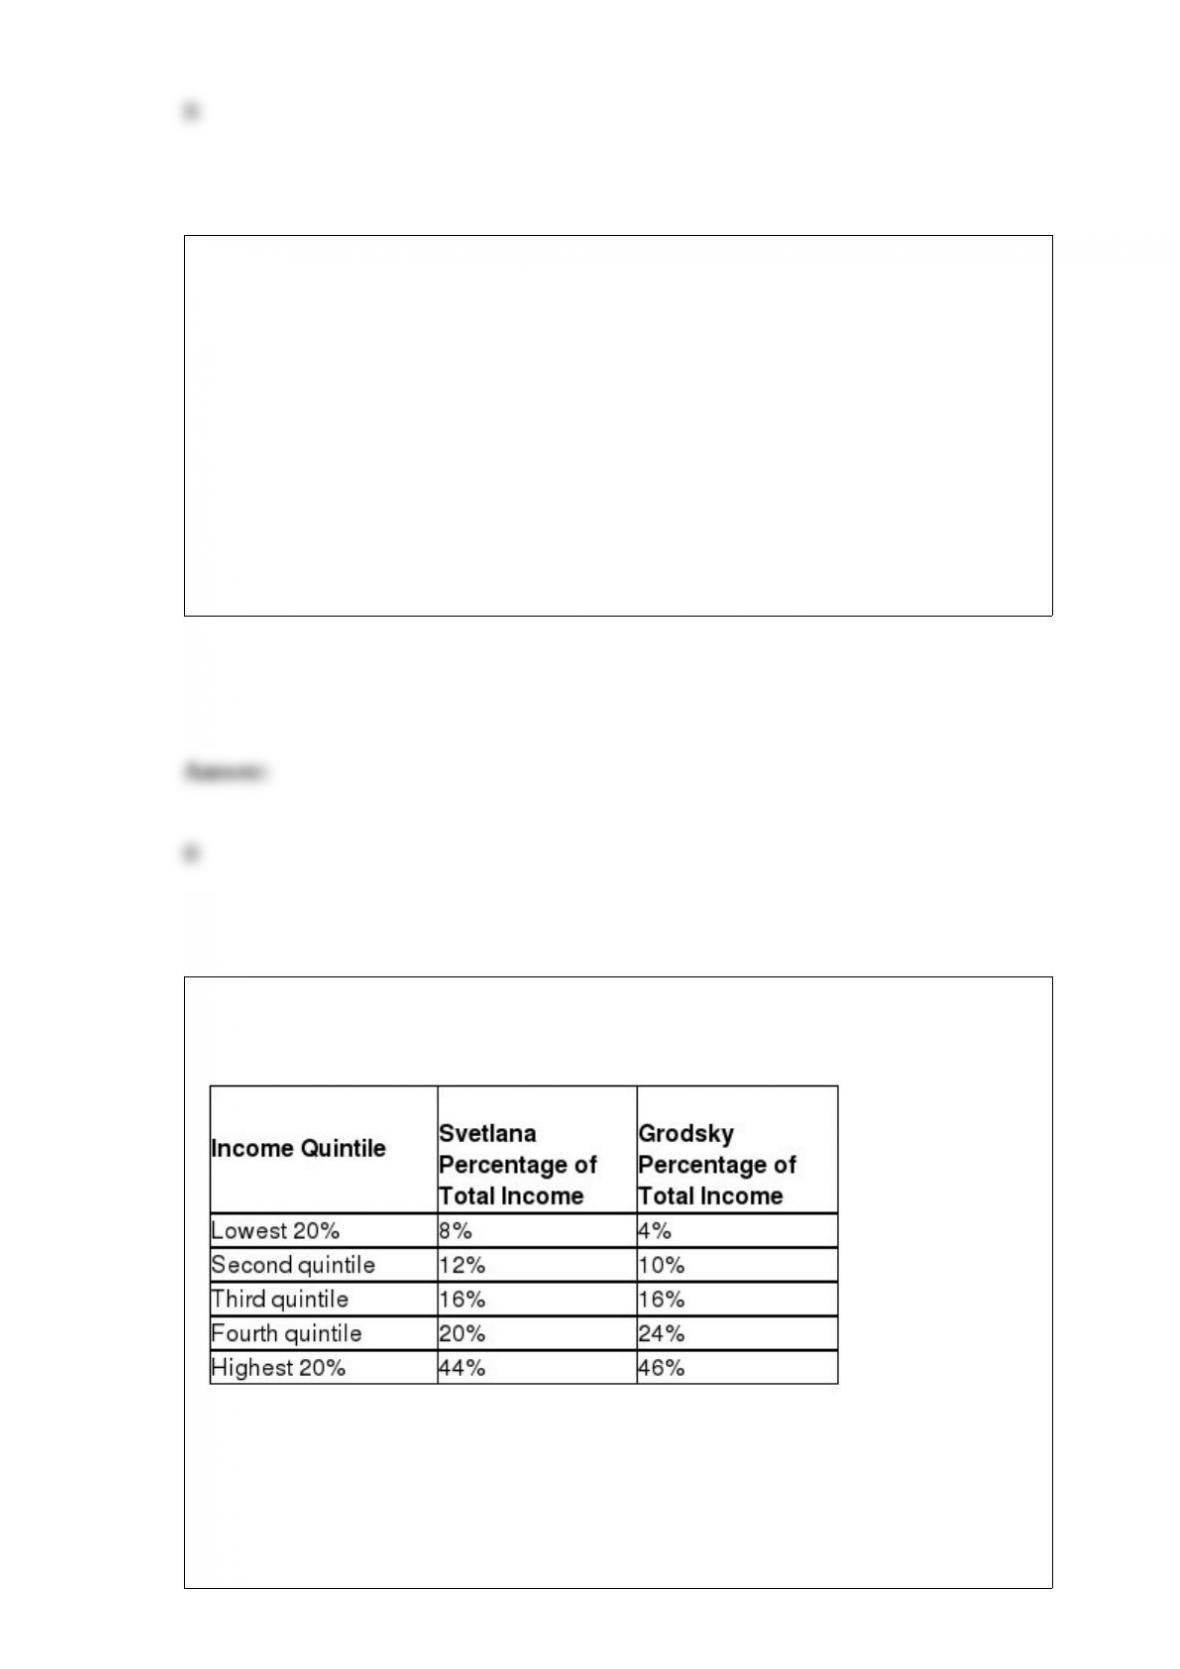
Table 18-11
Table 18-11 shows income distribution data for two countries. Use this data to answer
the following questions.
Refer to Table 18-11.
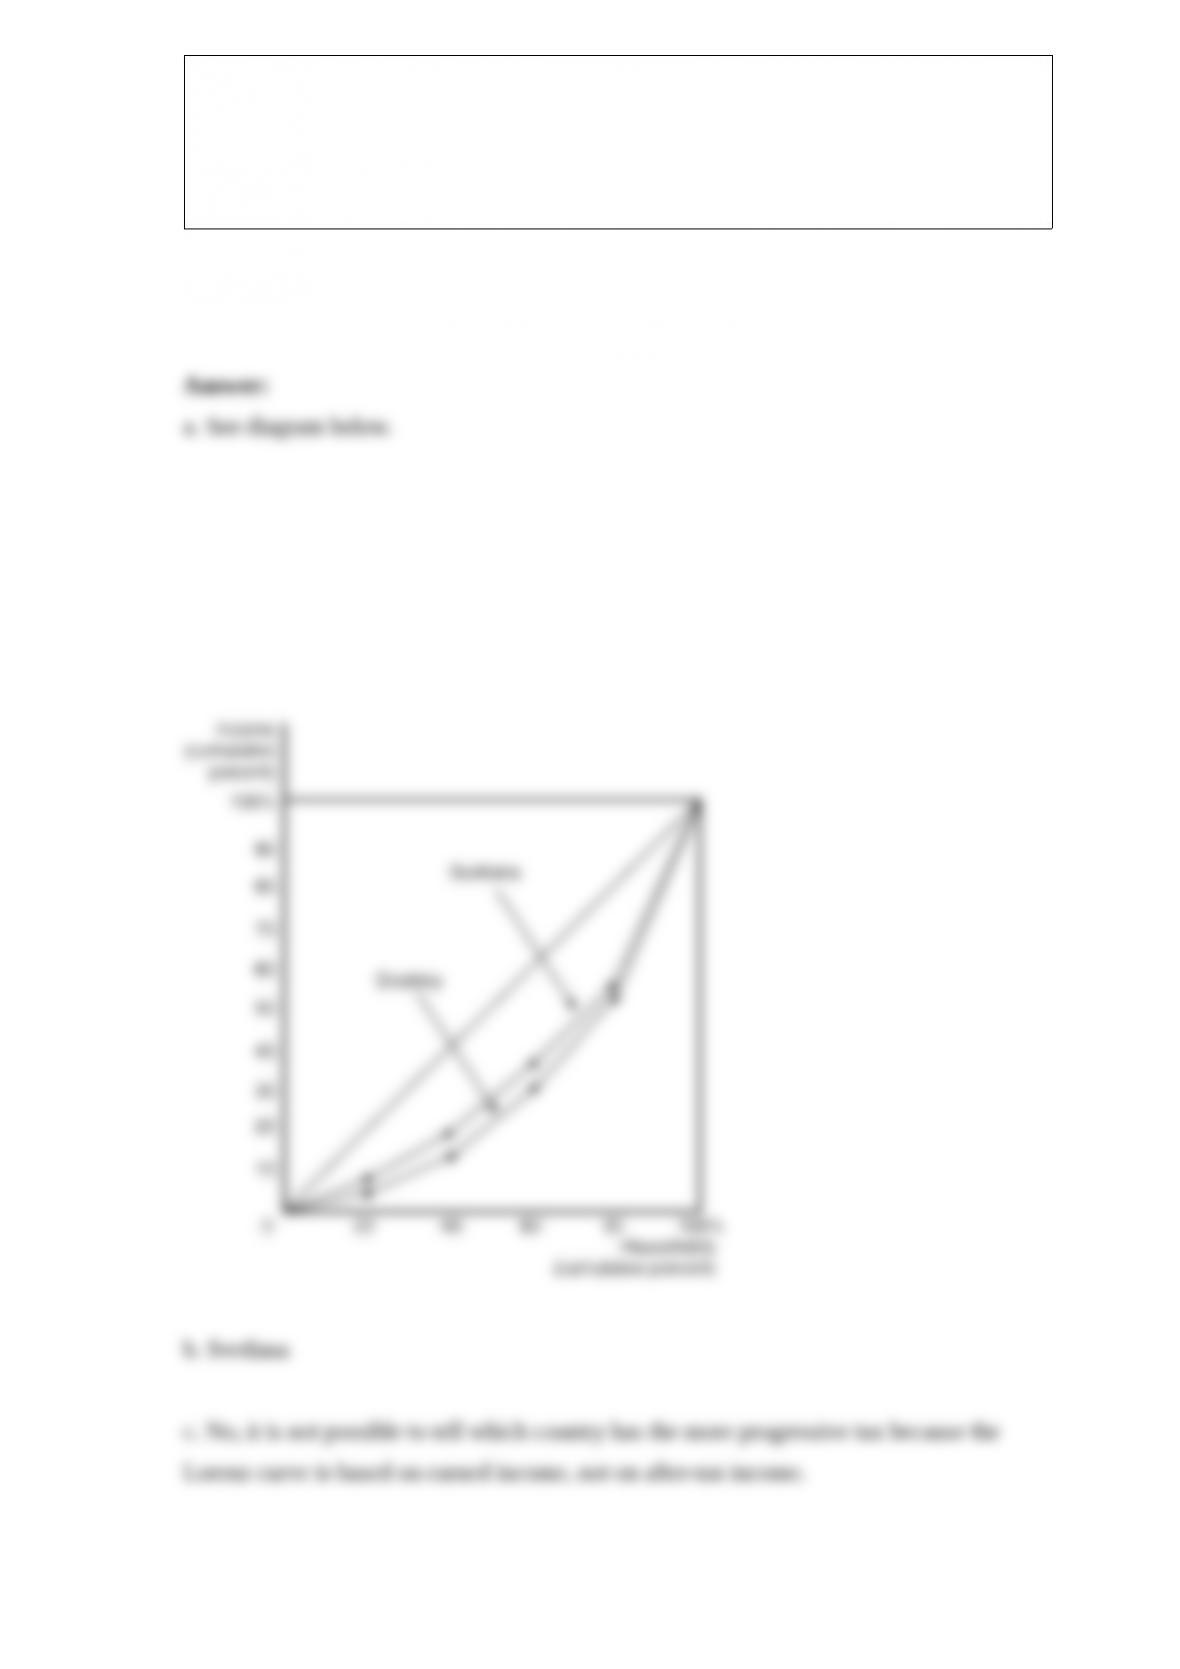
a. Draw a Lorenz curve for each country.
b. Which country has the more equal distribution of income?
c. Based on the Lorenz curves for the two countries, can you determine which country
has the more progressive tax system? Explain your answer.

How can a proprietorship or partnership raise funds for expansion?
A) borrow from someone or an institution willing to lend the funds
B) reinvest profit back into the business
C) take on a partner or more partners
D) Any of these would generate funds for expansion.
Which of the following helps to explain why the supply curve of labor is upward
sloping?
A) The supply curve of labor is a derived supply curve; since the output supply curve is
upward-sloping so is the labor supply curve.
B) As the wage rate rises, the income effect causes the quantity of labor supplied to
increase.
C) The substitution effect of a price change makes a good more expensive relative to
other goods.
D) As the wage rate rises, the opportunity cost of leisure rises.
Which of the following describes how a negative externality affects a competitive
market?

A) The externality causes a difference between the private cost of production and the
social cost.
B) The externality causes a difference between the private cost of production and the
private benefit from consumption.
C) The externality causes consumer surplus to exceed producer surplus.
D) The externality causes a difference between the private cost of production and the
equilibrium price.
The tragedy of the commons was avoided in the Middle Ages by
A) selling common grounds to individuals.
B) the local police who monitored entry into the commons.
C) social pressure to uphold traditionally accepted limits on family use of the commons.
D) the government which imposed a tax for the use of the commons.
Firms such as Taco Bell and Chipotle operate hundreds of restaurants nationwide while
firms such as El Pollo Loco operates only in five states. How would you characterize
these stores?
A) Taco Bell and Chipotle are oligopolists while El Pollo Loco is a monopolistic
competitor.

B) Taco Bell and Chipotle are duopolists while El Pollo Loco is a monopolistic
competitor.
C) Taco Bell and Chipotle are duopolists while El Pollo Loco is an oligopolist.
D) They are all monopolistic competitors.
A form of implicit collusion where one firm in an oligopoly announces a price change
which is matched by other firms in the same industry is
A) “follow the leader” pricing.
B) price leadership.
C) retaliation pricing.
D) “tit-for-tat” pricing.
Consider two industries, industry W and industry X. In industry W there are five
companies, each with a market share of 20% of total sales. In industry X, there are six
companies. One company has a 50% market share and each of the other five firms has a
market share of 10%.
a. Calculate the four-firm concentration ratio for each industry.
b. Calculate the Herfindahl-Hirschman Index (HHI) for each industry.
c. What do the values of the two concentration measures imply about the degree of
market power in the two industries?
If Joey Kobayashi experiences diminishing marginal utility from eating hot dogs then
A) his total utility from eating hot dogs is negative.
B) the marginal utility from the next hot dog Joey eats will be negative.
C) the additional satisfaction he receives from eating another hot dog will be less then
the satisfaction he received from his eating his last hot dog.
D) Joey is maximizing the marginal utility per dollar he receives from eating hot dogs.
What are property rights?

A) the title to ownership of any physical asset
B) a legal document verifying ownership of intangible assets
C) the rights individuals or firms have to the exclusive use of their property, including
the right to buy or sell it
D) the right of the government to appropriate private assets for the good of society
Some firms require consumers to pay an initial fee for the right to buy their product and
an additional fee for each unit of the product they purchase. This practice is referred to
as
A) odd pricing.
B) dual pricing.
C) a two-part tariff.
D) intertemporal pricing.
What is the present value of $888 in a one year if the current rate of interest is five
percent?
A) $4,440
B) $845.71
C) $177.60
D) none of these
Consider two industries, industry Q and industry Z. In industry Q there are 10
companies, each with a market share of 10% of total sales. In industry Z, there are eight
companies. One company has a 65% market share and each of the other seven firms has
a market share of 5%.
a. Calculate the four-firm concentration ratio for each industry.
b. Calculate the Herfindahl-Hirschman Index (HHI) for each industry.
c. What do the values of the two concentration measures imply about the degree of
market power in the two industries?
Because producers do not bear the external cost of pollution
A) the economically efficient level of production is achieved.
B) private production is below the economically efficient level.
C) private production exceeds the economically efficient level.
D) the market price is too high.
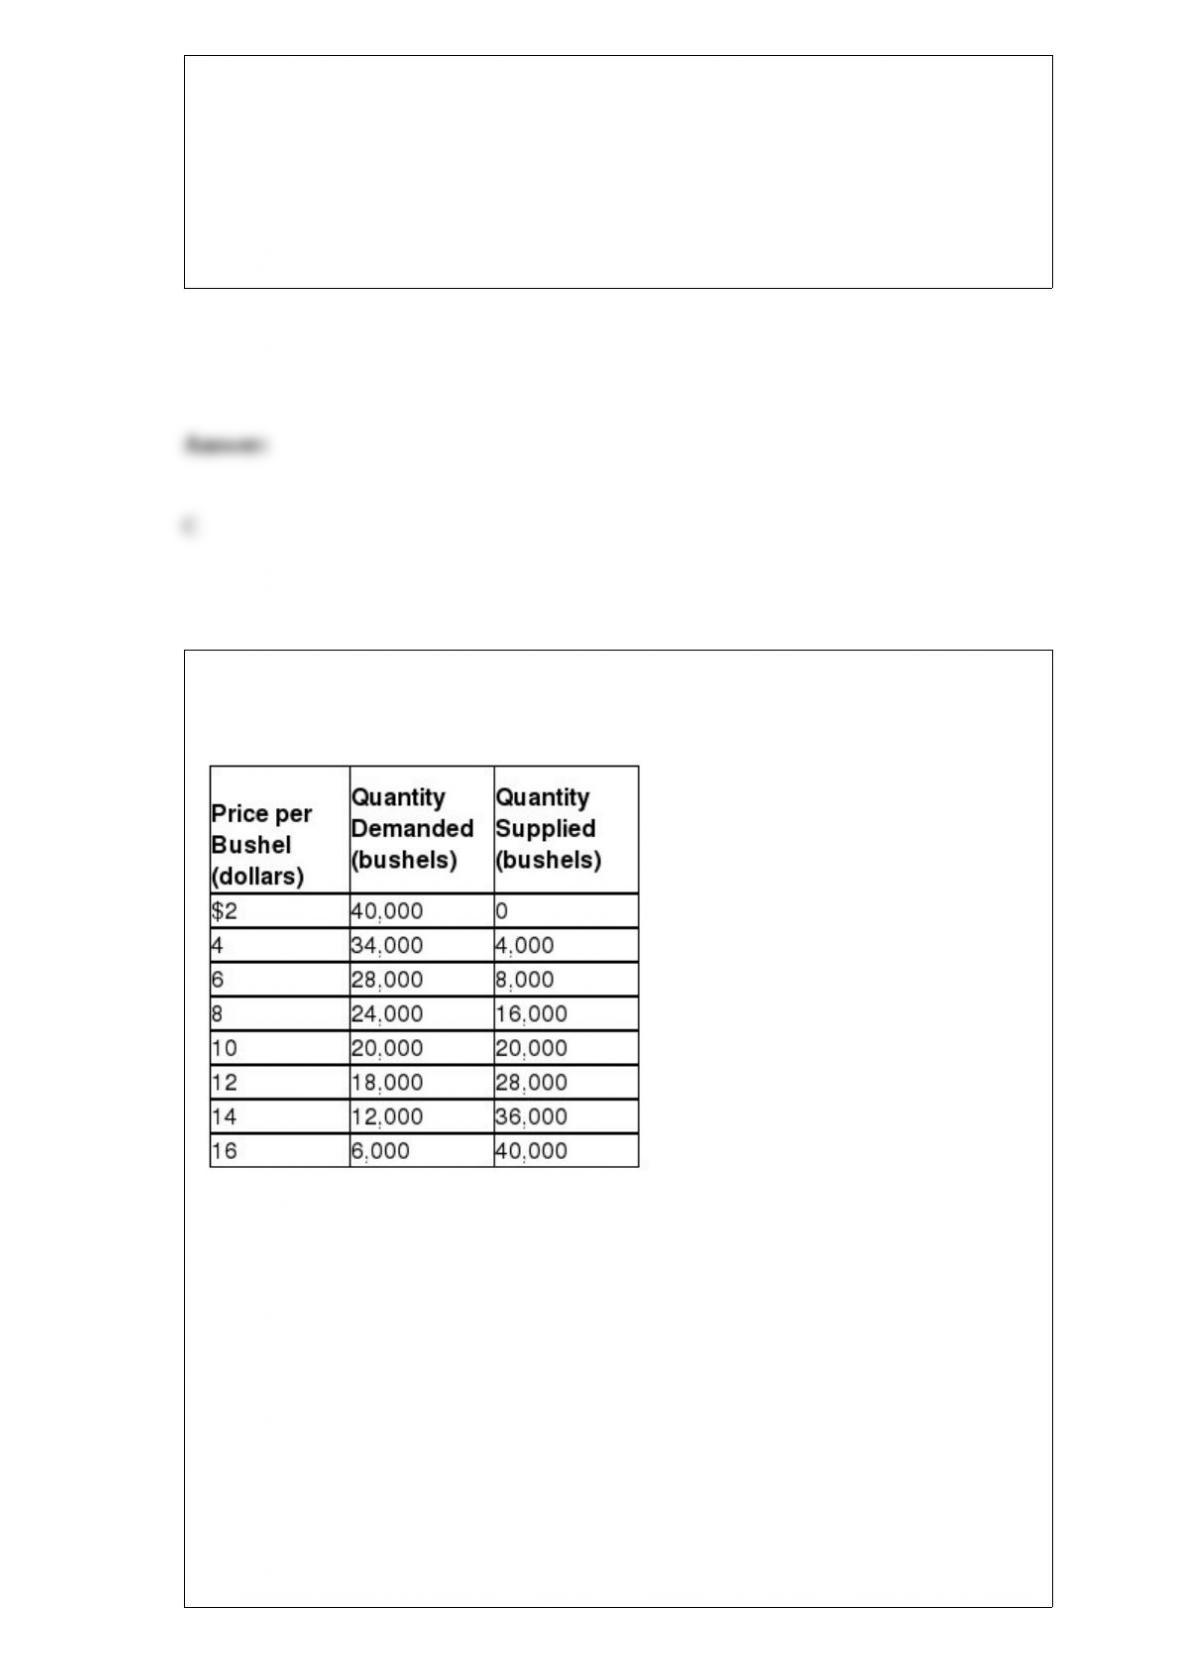
Table 4-5
Table 4-5 above contains information about the corn market. Answer the following
questions based on this table.
Refer to Table 4-5. An agricultural price floor is a price that the government guarantees
farmers will receive for a particular crop. Suppose the federal government sets a price
floor for corn at $12 per bushel.
a. What is the amount of shortage or surplus in the corn market as result of the price
floor?
b. If the government agrees to purchase any surplus output at $12, how much will it
cost the government?
c. If the government buys all of the farmers’ output at the floor price, how many bushels
of corn will it have to purchase and how much will it cost the government?
d. Suppose the government buys up all of the farmers’ output at the floor price and then
sells the output to consumers at whatever price it can get. Under this scheme, what is
the price at which the government will be able to sell off all of the output it had
purchased from farmers? What is the revenue received from the government’s sale?
e. In this problem we have considered two government schemes: (1) a price floor is
established and the government purchases any excess output and (2) the government
buys all the farmers’ output at the floor price and resells at whatever price it can get.
Which scheme will taxpayers prefer?
f. Consider again the two schemes. Which scheme will the farmers prefer?
g. Consider again the two schemes. Which scheme will corn buyers prefer?
Figure 2-10
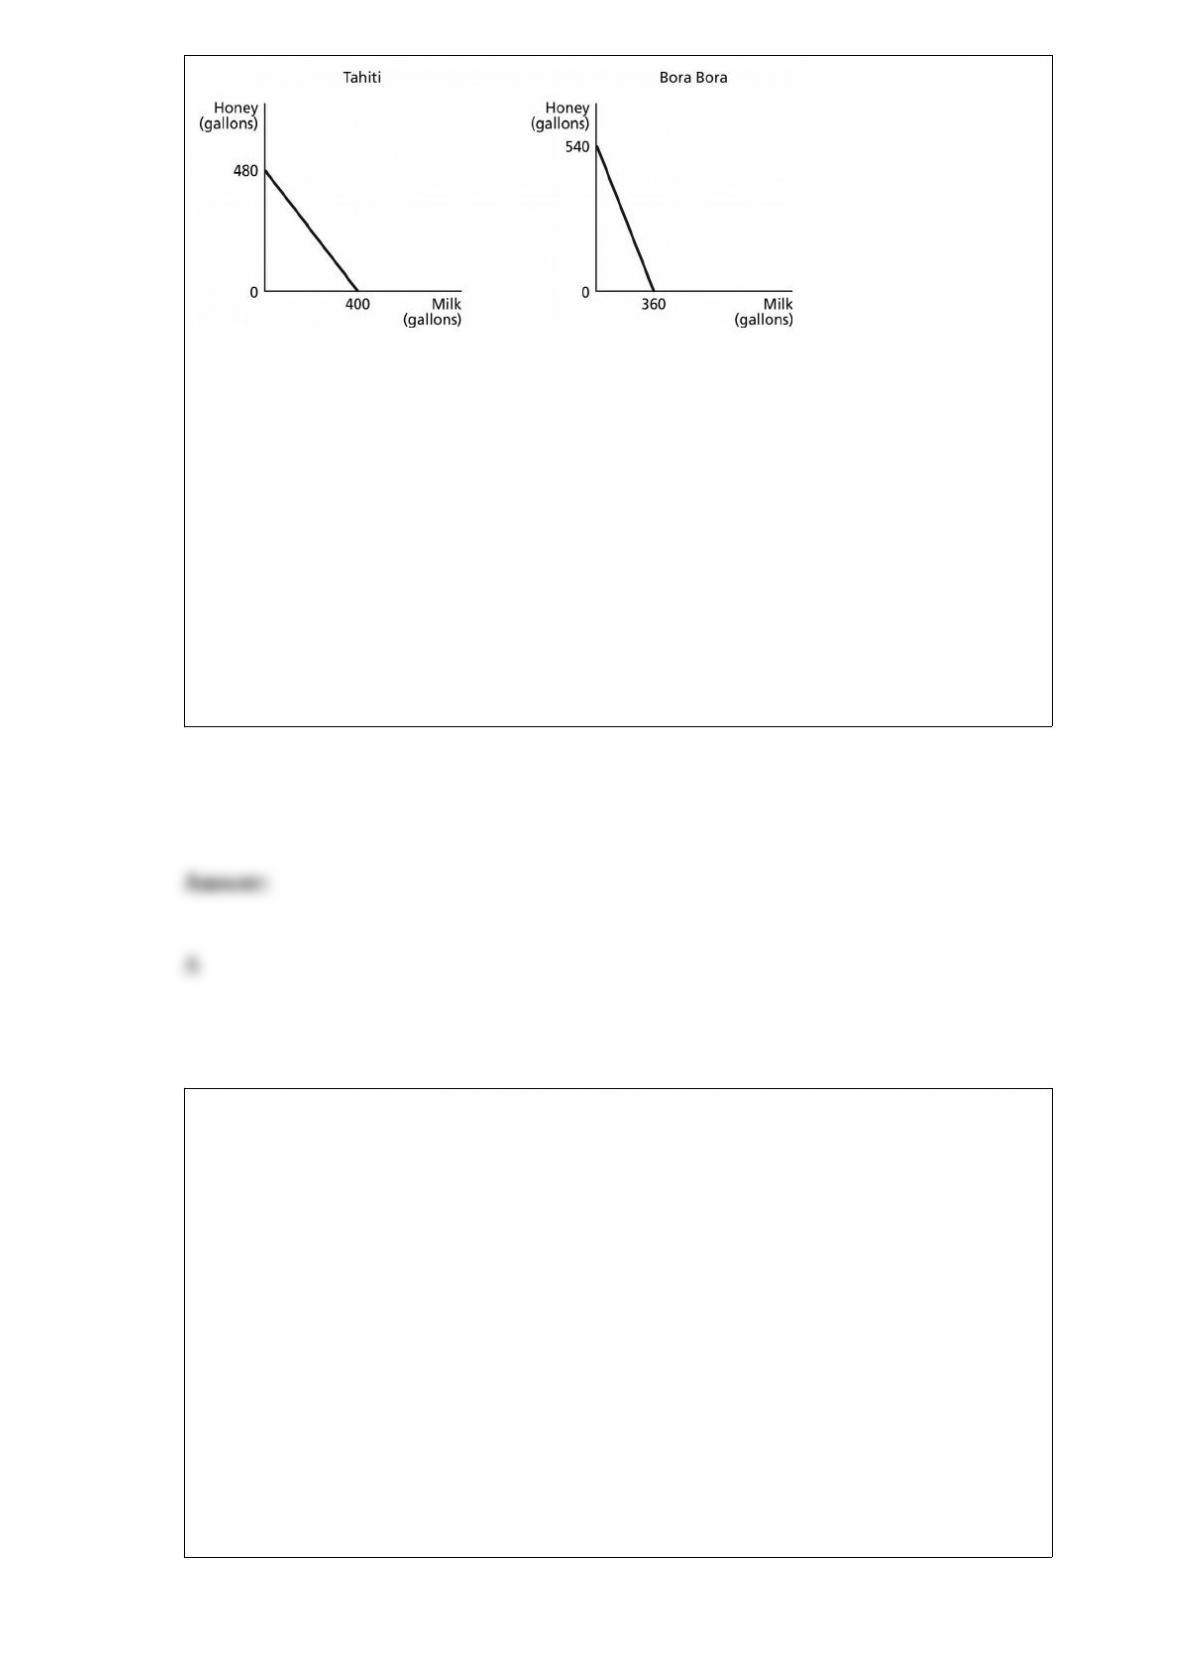
Figure 2-10 shows the production possibilities frontiers for Tahiti and Bora Bora. Each
country produces two goods, milk and honey.
Refer to Figure 2-10. What is the opportunity cost of producing one gallon of honey in
Bora Bora?
A) 2/3 of a gallon of milk
B) 9 gallons of milk
C) 1 1/3 gallons of milk
D) 5 gallons of milk
We can draw demand curves for firms in perfectly competitive and monopolistically
competitive industries, but not for oligopoly firms. The reason for this is
A) there are no barriers to entry in perfectly competitive and monopolistically
competitive industries. There are high barriers to entry in oligopoly industries.
B) we can assume that the prices charged by perfectly competitive and monopolistically
competitive firms have no impact on rival firms. For oligopoly this assumption is
unrealistic.
C) that perfectly competitive and monopolistically competitive firms are price takers.
Oligopoly firms are price makers.
D) perfectly competitive and monopolistically competitive firms sell standardized
products. Oligopoly firms sell differentiated products.

The term “payroll taxes” is often used to refer to
A) individual income taxes that are withheld from paychecks.
B) corporate income taxes.
C) Social Security and Medicare taxes.
D) sales taxes.
Tesla Motors manufacturers its cars at a plant in Fremont, California. At this plant,
Tesla is able to take advantage of the high level of technical training possessed by its
American workers, but it also sacrifices the ability to pay lower wages had it chosen to
open its plant in a low-wage country such as Mexico, India, or China. In deciding to
open the Fremont plant, Tesla
A) faced no trade-offs because employing more technically-skilled workers increased
efficiency.
B) faced a trade-off between higher cost and lower precision.
C) adopted a negative technological change because it chose high-skilled workers over
low-paid workers.
D) eroded some of its competitiveness in the luxury electric car market because of its
increased cost of production.

If opportunity costs are constant, the production possibilities frontier would be graphed
as
A) a ray from the origin.
B) a positively sloped straight line.
C) a negatively sloped curve bowed in toward the origin.
D) a negatively sloped straight line.
Figure 15-7
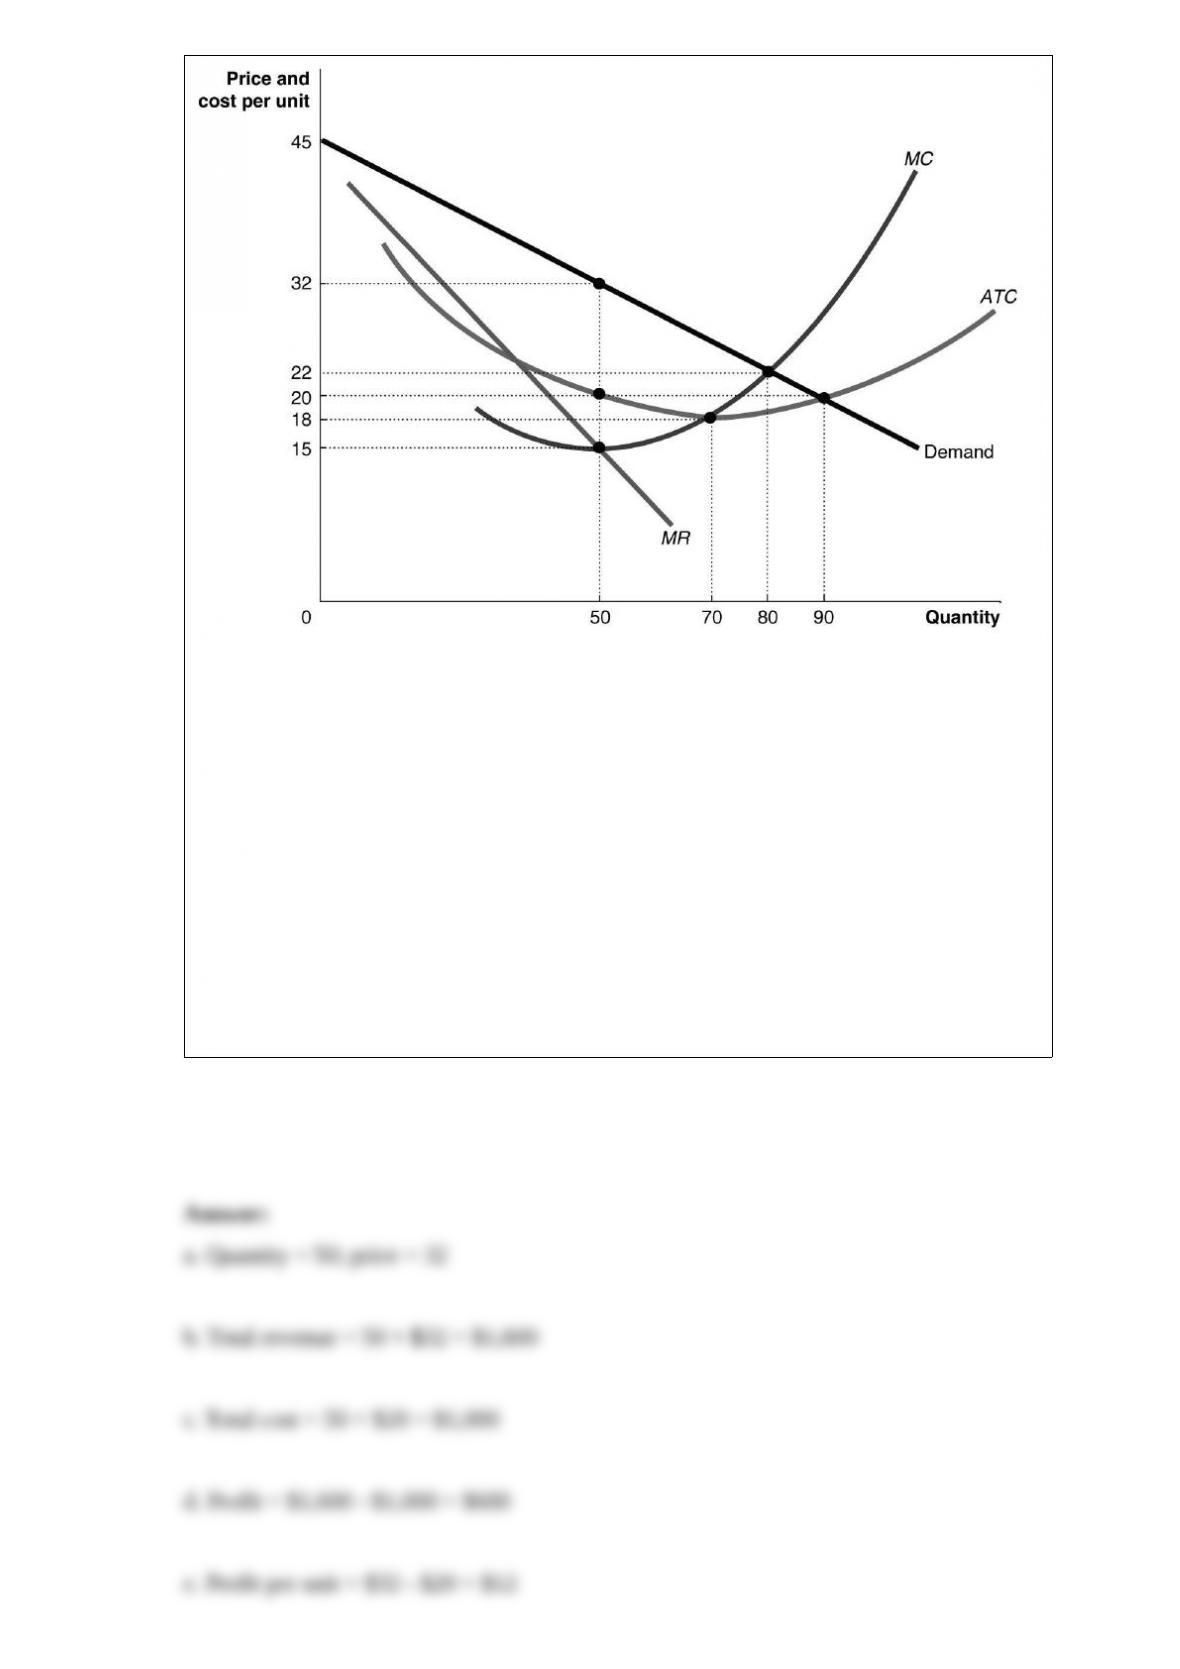
Refer to Figure 15-7. Use the figure above to answer the following questions.
a. What is the profit-maximizing quantity and what price will the monopolist charge?
b. What is the total revenue at the profit-maximizing output level?
c. What is the total cost at the profit-maximizing output level?
d. What is the profit?
e. What is the profit per unit (average profit) at the profit-maximizing output level?
f. If this industry was organized as a perfectly competitive industry, what would be the
profit-maximizing price and quantity?
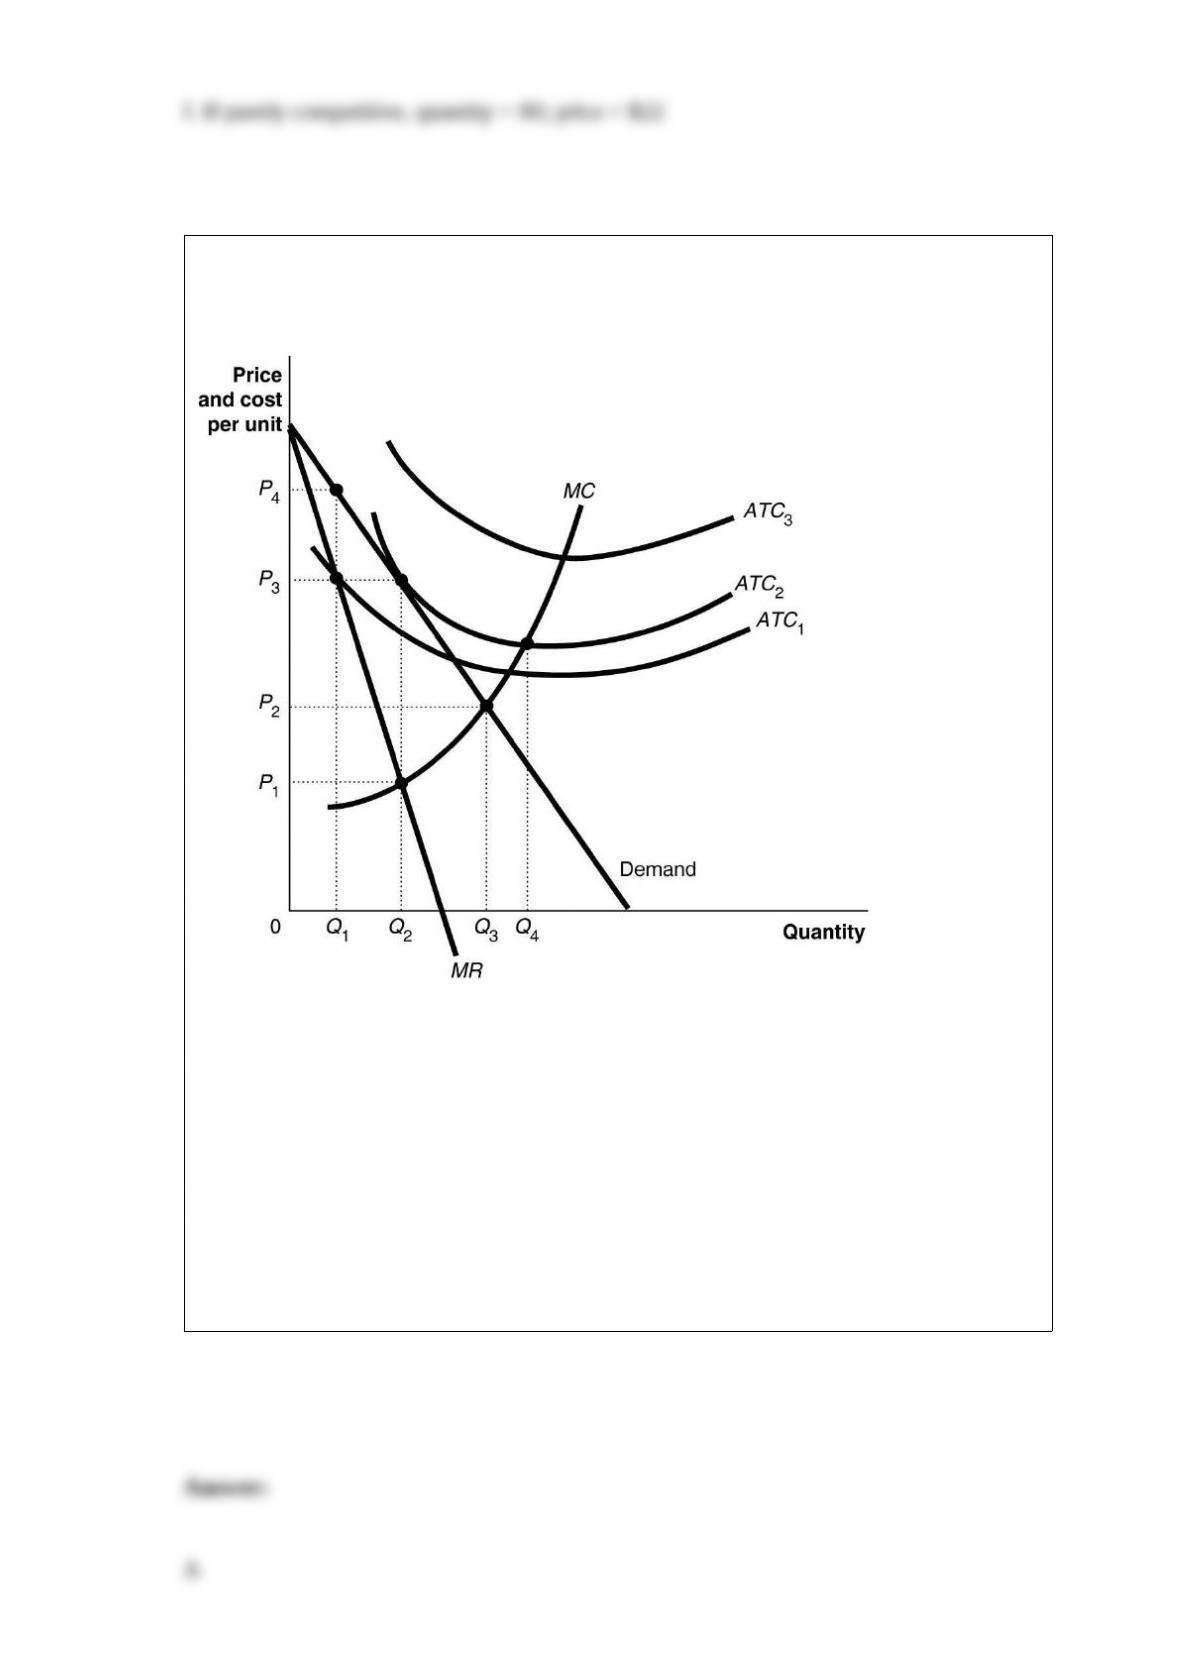
Figure 15-2
Figure 15-2 above shows the demand and cost curves facing a monopolist.
Refer to Figure 15-2. If the firm’s average total cost curve is ATC3, the firm will
A) suffer a loss.
B) break even.
C) make a profit.
D) face competition.

An example of a supplier that used its bargaining power to charge high prices to its
customers is
A) Walmart, which required many of its suppliers to alter their distribution systems to
accommodate Walmart’s need to control the flow of goods to its stores.
B) the firms that supply paper napkins to McDonald’s restaurants.
C) the Technicolor Company, the sole producer of cameras and film that movie studios
needed to produce color movies in the 1930s and 1940s.
D) the publishers of the Encyclopedia Britannica.
The income effect due to a price decrease will result in an increase in the quantity
demanded for
A) a Giffen good.
B) an inferior good.
C) a public good.
D) a normal good.
If a theatre company expects $250,000 in ticket revenue from five performances and

$288,000 in ticket revenue if it adds a sixth performance, the
A) marginal revenue of the sixth performance is $288,000.
B) marginal revenue of the sixth performance is $38,000.
C) cost of staging the sixth performance is probably higher than the cost of staging the
previous five.
D) company will be making a loss on the sixth performance because its ticket sales will
be less than the average revenue received from the previous five.
All else equal, the decrease in the price of complementary products for the Apple
Watch, such as Sensoria’s wearable technology, would
A) shift the supply curve for the Apple Watch to the right.
B) shift the supply curve for the Apple Watch to the left.
C) shift the demand curve for the Apple Watch to the right.
D) shift the demand curve for the Apple Watch to the left.
Consider a U-shaped long-run average cost curve that has a minimum efficient scale at
6,000 units of output. In this case, this industry would be
A) perfectly competitive if the market quantity demanded is 20,000 units.

B) monopolistically competitive if the market quantity demanded is 12,000 units.
C) an oligopoly if the market quantity demanded is 18,000 units.
D) an oligopoly if the four-firm concentration ratio is more than 10 percent.
The proposition that the outcome of a majority vote is likely to represent the
preferences of the voter who is in the political middle is called
A) the mean (or average) voter theorem.
B) the voting paradox.
C) the Arrow impossibility theorem.
D) the median voter theorem.
How does the owner of a corporation relate to the business?
A) The owners of the business have a separate legal distinction from the business.
B) The owners of the business have no separate legal distinction from the business.
C) The personal assets are part of the corporation’s assets.
D) None of these describe the legal relationship of corporate owners to the business.
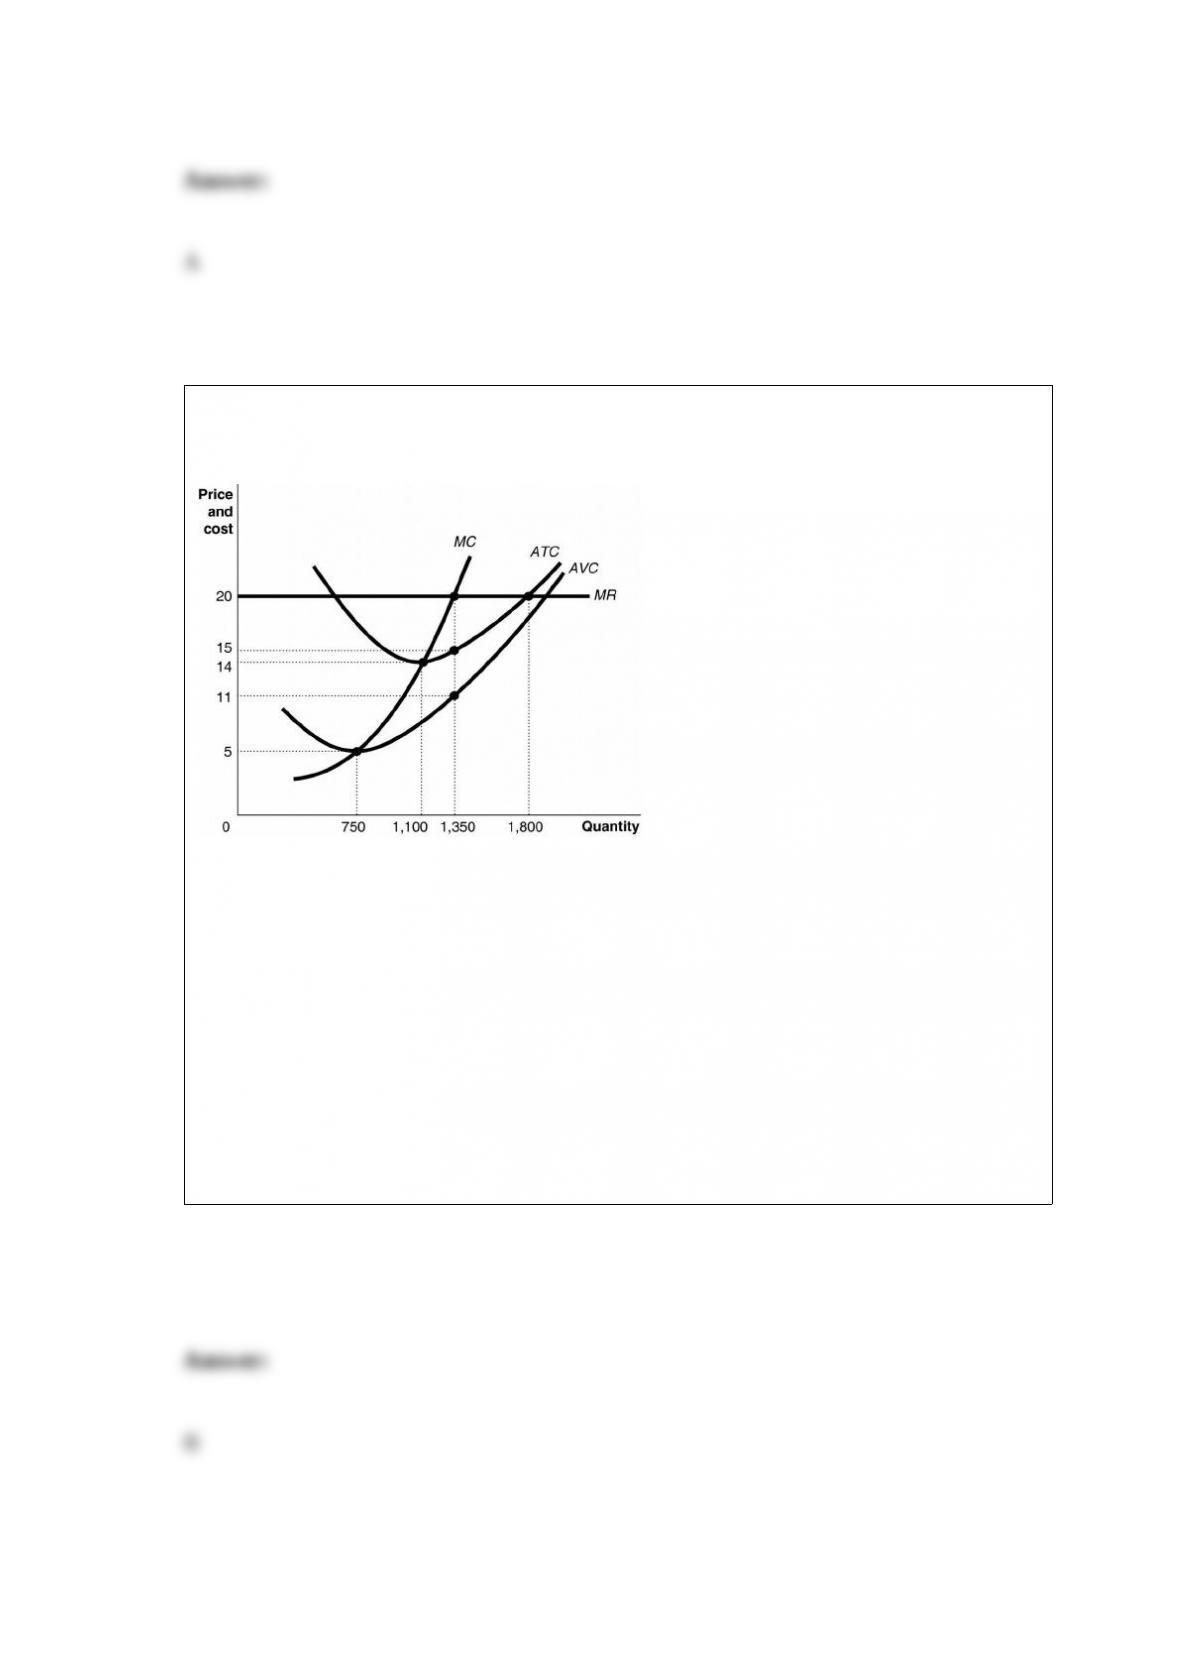
Figure 12-5
Figure 12-5 shows cost and demand curves facing a typical firm in a constant-cost,
perfectly competitive industry.
Refer to Figure 12-5. If the market price is $20, what is the amount of the firm’s profit?
A) $5,400
B) $6,750
C) $8,100
D) $16,200

A(n) ________ is represented by a leftward shift of the demand curve while a(n)
________ is represented by a movement along a given demand curve.
A) decrease in demand; increase in demand
B) decrease in demand; increase in quantity demanded
C) increase in demand; decrease in quantity demanded
D) decrease in quantity demanded; decrease in demand